Tsunamis: Knowing them to forecast them better
PDF
Well-known in the Pacific for many centuries, tsunamis [1] have been revealed worldwide following the catastrophic tsunamis of 2004 (Sumatra) and 2011 (Japan). Outside the Pacific, and throughout history, similar events are also well known. Thus in 1755, the Lisbon tsunami caused major damage in many European countries (mainly Portugal, Spain, but also Ireland, Great Britain…), African countries (Morocco), as well as in the West Indies. More recently, the tsunamis in 2018 in Palu or Krakatau (Indonesia) have emphasized these phenomena again, and recall the recurrent issues: has progress been made in understanding tsunamis, to better preventing them, or even considering their forecast? Whatever their origin (major earthquake or landslide), the coastal effects of tsunamis result in flooding several kilometres inland, run-up reaching several metres to tens of metres, strong currents in ports, often causing considerable destruction. Some tsunamis can be forecast/prevented by a warning system.
1. What is a tsunami?
Any motion that deforms the surface of the Earth’s crust and is capable of impacting the surrounding water layers (ocean, sea, fjord, bay, lake, etc.), inducing significant vertical deformation, is likely to trigger a tsunami. The return to equilibrium of the water layer by the play of gravity forces induces the initiation and then the propagation of a gravity wave train. Through an amplification phenomenon when it reaches the coast, the tsunami can impact all the close and distant shorelines.
1.1. Triggered by an earthquake
Oceanic subduction zones, where one oceanic plate sinks under another tectonic plate, and which are associated with the most active volcanic chains (e.g. Indonesia, the West Indies, Japan, Chile, Peru, etc.), produce so-called convergence motion. They cause the largest known earthquakes (e.g. 365 in Greece, 1843 in the West Indies, 1957 in the Aleutians, 1960 in Chile, etc.), generally triggering tsunamis, five to ten times a century.
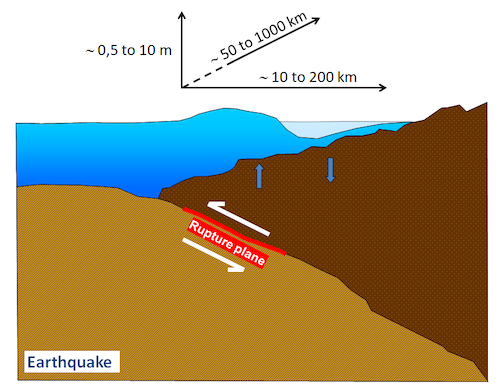
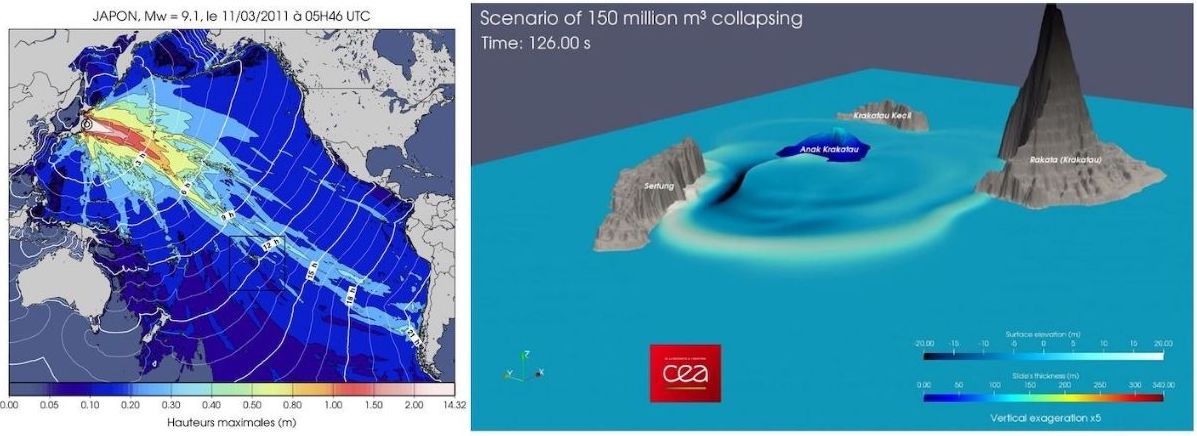
2004 and 2011 tsunamis were triggered by subduction earthquakes of magnitude [2] greater than 9. The rapid release, in a few minutes, of the elastic stresses accumulated over decades or even centuries of subduction (Figure 1) generates a vertical deformation of the water layer and initiates the tsunami.
The deformation of the overlying water layer has a vertical amplitude of the order of one to several metres. It extends over horizontal dimensions of a few tens to hundreds of kilometres in the direction of subduction, sometimes up to a thousand kilometres or more along the deep-sea trench. The latter length is generally correlated with magnitude, with orders of magnitude of 50 km (magnitude ~ 7.5), 200 km (magnitude ~ 8), 500 km (magnitude ~ 8.5) to 1000 km and more (magnitude ~ 9).
Submarine earthquakes outside the subduction context also produce tsunamis when the vertical deformation involved is significant:
- for example, on 21 May 2003, an earthquake of magnitude 6.8 occurred off the coast of Algeria, in the Boumerdès region. This region of active tectonic convergence regularly produces major coastal and/or submarine earthquakes [3]; the fault planes [4] involved, which are fairly steep, favour sufficient vertical deformations from around magnitude 6.0;
- similarly, the November 2004 earthquake in Les Saintes (West Indies), of magnitude 6.3, involved a fault in extension, or opening (the so-called normal fault) steep enough to produce vertical deformation that is more tsunamigenic;
- lastly, earthquakes involving predominantly horizontal movements (the so-called strike-slip fault), with little vertical deformation, however, sometimes induce a tsunami. Tsunamis are amplified by horizontal movements of steep sea-bed topography close to the coast and/or by submarine rock avalanches triggered by seismic tremors (e.g. Izmit, Turkey, in August 1999, Haiti in January 2010, Palu in September 2018) [5].
1.2. Triggered by a gravity source
Tsunamis generated by volcanic collapses have been very prominent in history, such as the eruption of Santorini in Greece (around 1600 BC), the explosion of the volcano Krakatoa (Indonesia) in 1883 (more than 30 m of tsunami in Probe Strait), and the explosion of Mount Pelee (Martinique, 1902) [6]
Rock avalanches, either completely or partially submarine, have also produced remarkable events, such as in the North Sea (Storegga, about 8000 years ago), in Lake Geneva in 563, at Nice airport in 1979. The numerous events also show the occurrence of such gravity-induced tsunamis following strong seismic tremors, as in 1958 in the Bay of Lituya (Alaska). Today, rock destabilisation occurs more frequently as a result of global warming, as in Greenland (in 2000, 2017) [7].
1.3. Physics of propagation
The excitation due to a sudden change in the sea floor causes the water body to rise and fall, resulting in the propagation of gravity waves in all directions.
Several situations can be distinguished according to the type of source:
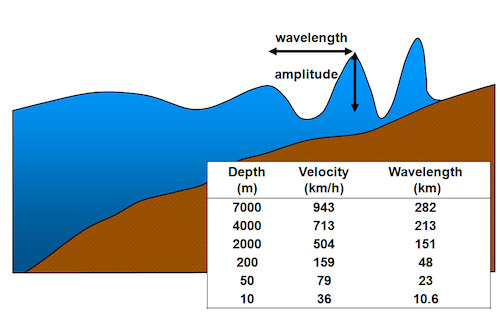
- In the case of earthquakes, λ wavelengths are generally much greater than the water depth, which is a few hundred to a few thousand metres. This approximation, called “shallow water” or “thin layer”, is used to express the first-order propagation velocity simply as √gh, where g is the gravity constant, and h is the water depth (see values in Figure 3).
The simplicity of this expression for velocity makes it possible to calculate, a few seconds after a submarine earthquake, the times of the first arrivals of the tsunami.
A seismic-type source produces imposes oscillations (or periods) of the water body approximately every 10 to 60 minutes, depending on the extension of the source and the depth of water above. These periods remain dominant at first order during the propagation of the wave train.
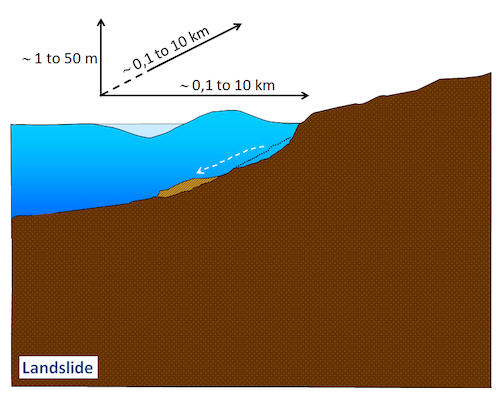
- For landslides, the wavelengths are shorter relative to the water depth, and the oscillations (periods) are close(about 1 to 10 min). In this case the speed of propagation also depends on the wavelength: shorter waves propagate more slowly than longer waves. The spreading of the different wavelengths leads to a more pronounced attenuation of the amplitudes: very high at the source, they decrease rapidly with distance.
So the tsunami has a geological origin. However, there are also tsunamis of atmospheric origin. This is the case when a significant pressure gradient, of large spatial extent and associated with meteorological disturbances, moves on the water surface at a velocity of shallow waves (less than 200 m). A resonance (known as Proudman resonance) can then generate the propagation of a tsunami-like wave train, known as a meteotsunami, whose periods of 5 to 15 minutes are similar to those of a tsunami. These phenomena are frequently observed in regions where the seabed is shallow (Adriatic Sea, the Balearic Rissagas, Sea of Japan, etc.). Their effects can be destructive.
Generally speaking, a tsunami is therefore made up of a series of waves, which amplitude depends on the water depth. Near the source its amplitude can be a few meters, but the attenuation during propagation leads to amplitudes offshore to a few centimeters to tens of centimeters. Then as it approaches the coast (Figure 3) the influence of the way the water depth decreases, becomes considerable. A steep slope tends to reflect waves. On the other hand, a gently sloping bottom slows down the waves by a factor of 5 to 20, and thus tightens the wave train. This results in a corresponding increase in the amplitude of the waves: the tsunami is amplified at the coast, where it then potentially invades the shoreline.
1.4. Effects on the coast
The impact of the tsunami on the coast results in a succession of ebbs and flows of the sea, of varying amplitude over time. These sea motions can lead successively to inundation of the shoreline and recessions, beyond the usual low tide levels in the case of major tsunamis. Bore phenomena in rivers or canals are frequently observed as a result of rising water levels. On the other hand, although not systematic, the arrival of a tsunami can start with a recession of water initially at rest, which is a major warning signal, all the more striking in low-tide areas, and especially if a tremor has been felt.
The periods, depending on the event, range a few minutes to sometimes about 60 minutes, and the phenomenon at the coast lasts for several hours. Usually the highest waves are observed during the first two hours, but late arrivals several hours later may produce significant effects, and the return to normal state usually occurs at least 24 hours after the first arrival.
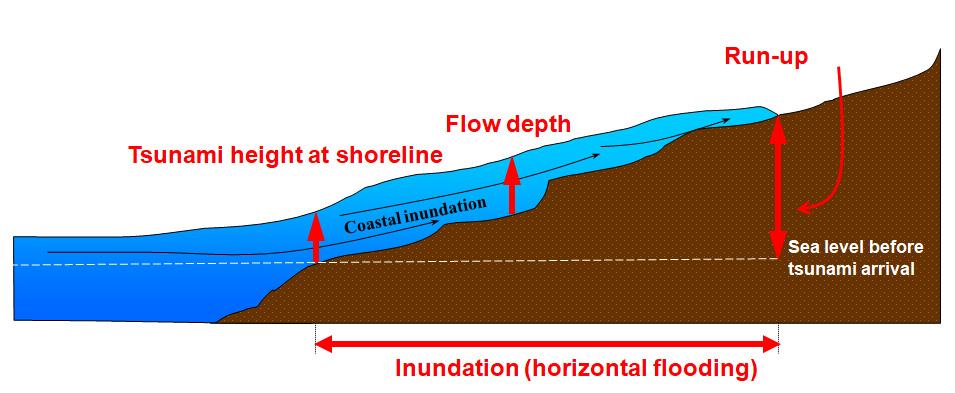
Coastal phenomena result in complex hydraulic effects. Even not inundating, in relatively moderate cases, tsunamis with less than 1 m amplitude create rise and strong currents in ports or bays, sometimes with eddies at the end of the dikes, all of which can potentially disrupt navigation and port infrastructure. For tsunamis producing inundation inland, it can be noted that waves as low as 50 cm flowdepth can destroy facilities, and are capable of displacing light vehicles and hitting standing people. A lot of debris is potentially carried along, and the destructive power increases as it is carried along. Extreme tsunamis destroy virtually any construction, sometimes up to several kilometres inland.
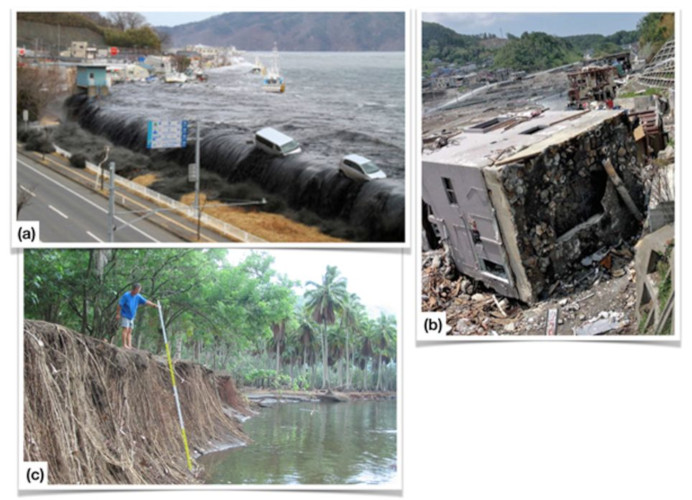
Figure 4 shows how the water body in Miyako Bay (Iwate Prefecture, Japan) is flooded when the 2011 tsunami arrives, 30 to 40 minutes after the earthquake: the tsunami is not an isolated wave, but a rise in the water level for several minutes, capable of overflowing and destroying protective sea walls and gates. The power of the sea’s floods (ebb and flow) causes a great deal of destruction, and is capable of overturning constructions without solid foundations (Figure 4, right).
2. How to observe and study a tsunami
2.1. Sea level measurements from open sea to coast

Port tide gauges have been significantly upgraded since the 2004 tsunami, which led to the deployment of warning systems requiring this type of properly sampled measurements to monitor the tsunamis propagation. Having properly specified instruments for tsunami measurements is still needed in some basins, especially for all short-period events (landslides).
2.2. Complementary measures
Other physical measurements provide information: GPS sensors deployed on buoys, satellite data, analysis of the total electronic content of the ionosphere [9] (see Focus 1).
3. Preparing for a tsunami
3.1. Catalogues and statistics
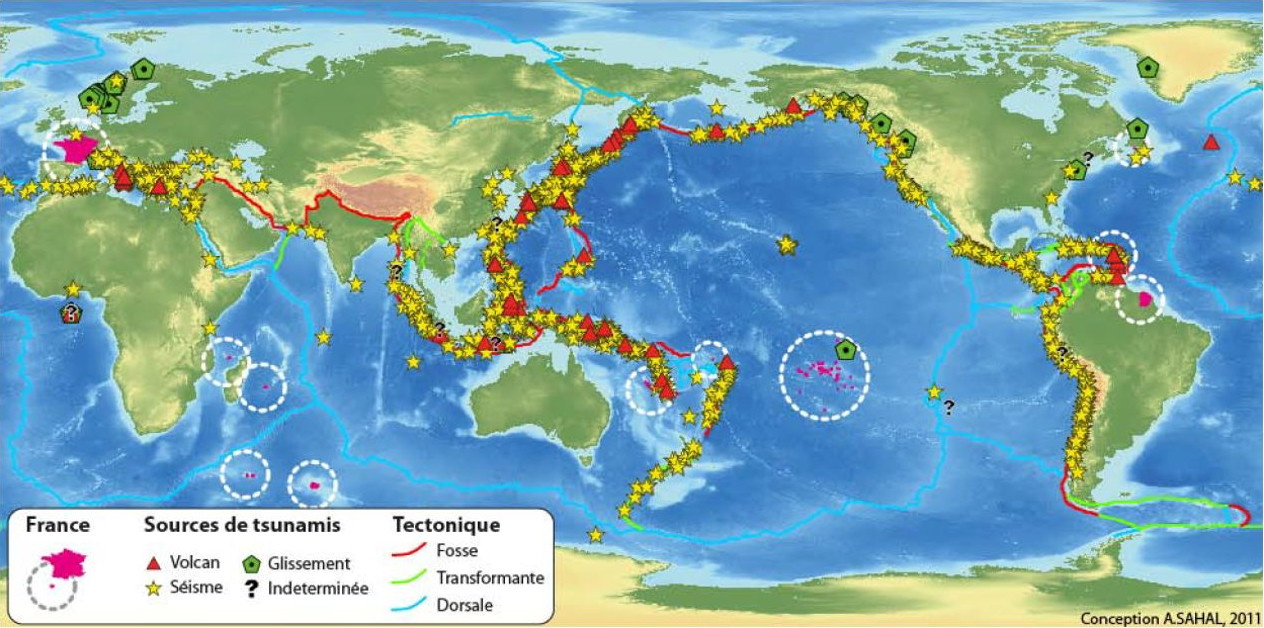
The Pacific Ocean is the region where the majority of tsunamis occur, and earthquakes are their main origin. Time analysis is biased due to the short period of time available for a complete analysis. Thus, very rare events known to have occurred in the past are not represented (e.g., the great tsunami of 365 in western Crete), as well as cases of tsunamis in periods not easily documented historically (e.g., the West Indies before the 15th century).
These statistics should be considered as first element in assessing the hazard for a specific region; earthquakes are not predictable but always occur in active areas, with various return periods, associated tsunamis would occur repeatedly.
3.2. Hazard studies and tsunami modelling
Since the 1980s, numerical simulation has provided an increasing number of quantitative elements to assess the tsunami hazard. Earlier models, based on ray tracing in a variable-velocity medium (the ocean), already took advantage of the increasingly well known global bathymetry to calculate travel times as a function of water depth (Figure 9).
Starting in the 1990s, simulation methods, generally in the form of numerical methods, made it possible to integrate the source model (seismic, gravity collapse) [11], coupled with a wave propagation model, and finally with a coastal impact model. The complex steps to be modelled are the source and the coastal impact, two areas where the physical complexities require either very advanced models, sometimes in three dimensions, or approximations whose limits must be known.
During propagation, the long-wave approximation described above allows the evolution of the wave train to be simulated using the equations of fluid mechanics in two horizontal dimensions.
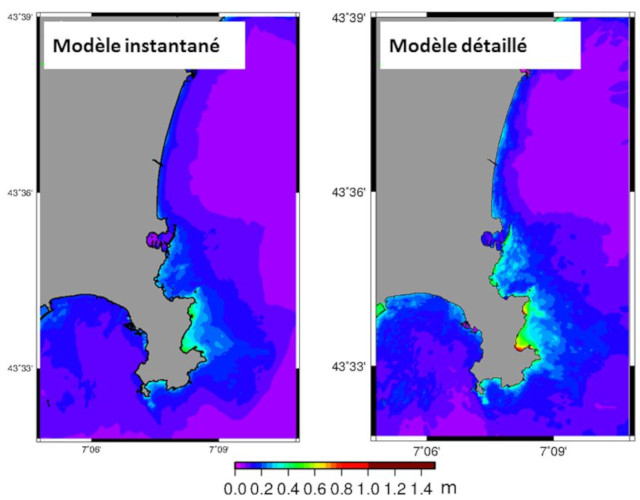
At the coast, the non-linear amplification must be resolved, and the narrowing of wavelengths requires knowing the velocity, and therefore the bathymetry, very finely. Typically, to model a tsunami at the harbour scale, the “gridsize” of the models must be less than 20 m. Finally, land-based modelling requires a good knowledge of the topography at the same resolution, and the equations to be solved can take into account the interaction of the waves with the buildings and vegetation.
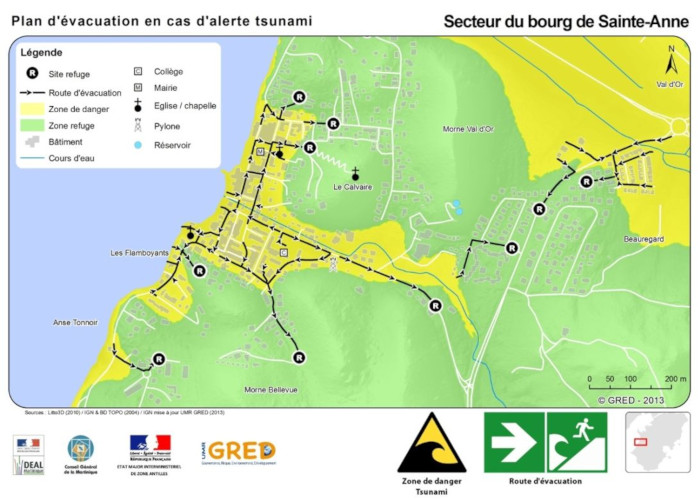
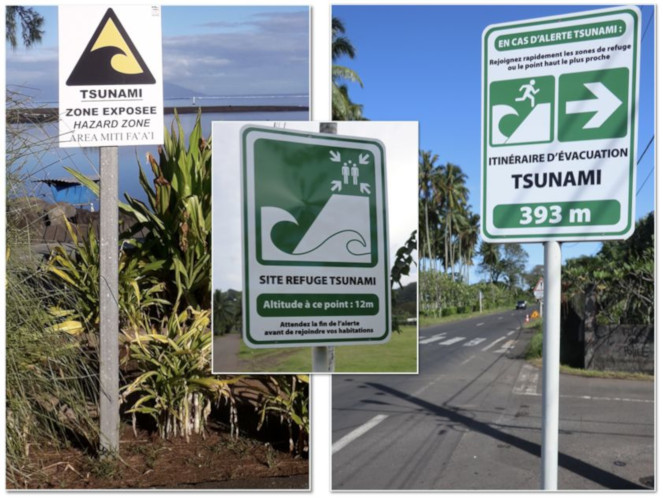
3.3. Coastal exposure and shoreline preparation
4. Forecasting tsunami impacts
4.1. Tsunami warning systems
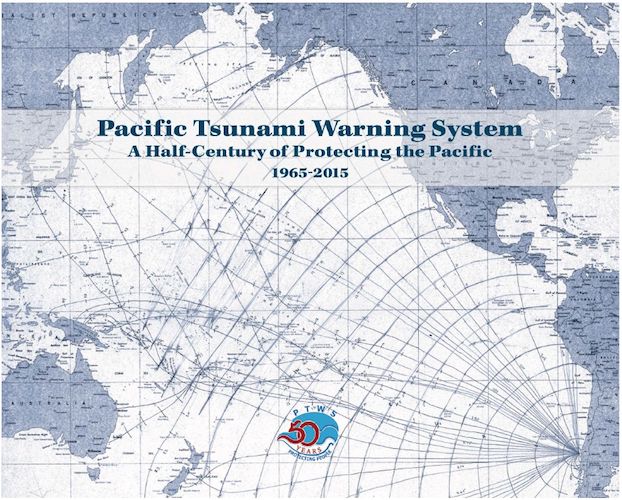
The first national warning centres were established in the mid-20th century by the United States, followed by Japan, Russia, Chile and France (in French Polynesia, see Focus 2), following major tsunami disasters (Aleutians 1946, Kamchatka 1952, and Chile 1960). In 1965, following the establishment at Unesco of the Intergovernmental Oceanographic Commission (IOC), the International Co-ordination Group (ICG) of the Tsunami Warning System in the Pacific was established to warn Pacific states in the event of a major earthquake that could cause a tsunami.
These groups are responsible for defining the architecture and coordinating the establishment of the warning systems and encourage all Member States to contribute to and participate in the activities. The three pillars of the warning systems are: (i) hazard and risk assessment; (ii) monitoring and warning; and (iii) prevention and mitigation.
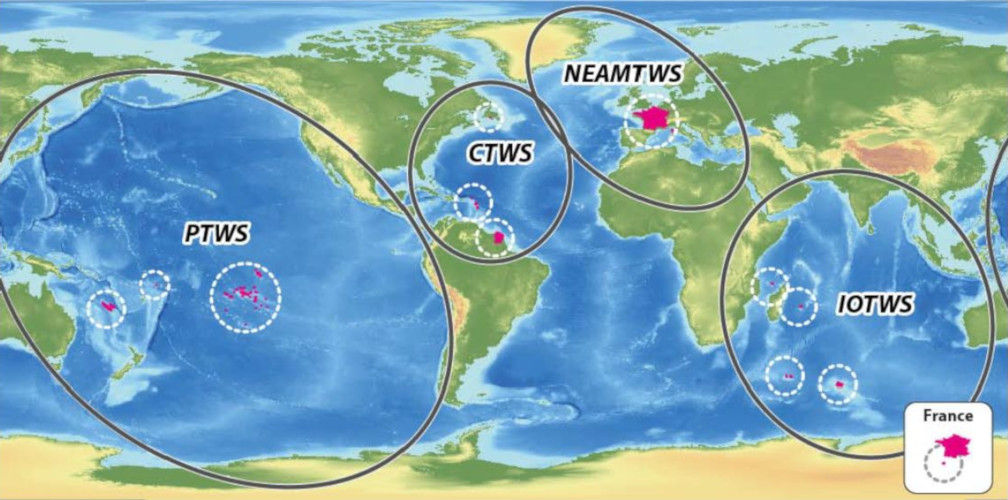
Since 2012, the four ocean basins (Figure 13) are monitored and alerted by 11 tsunami service providers.
4.2. Operational forecasting of tsunami impacts
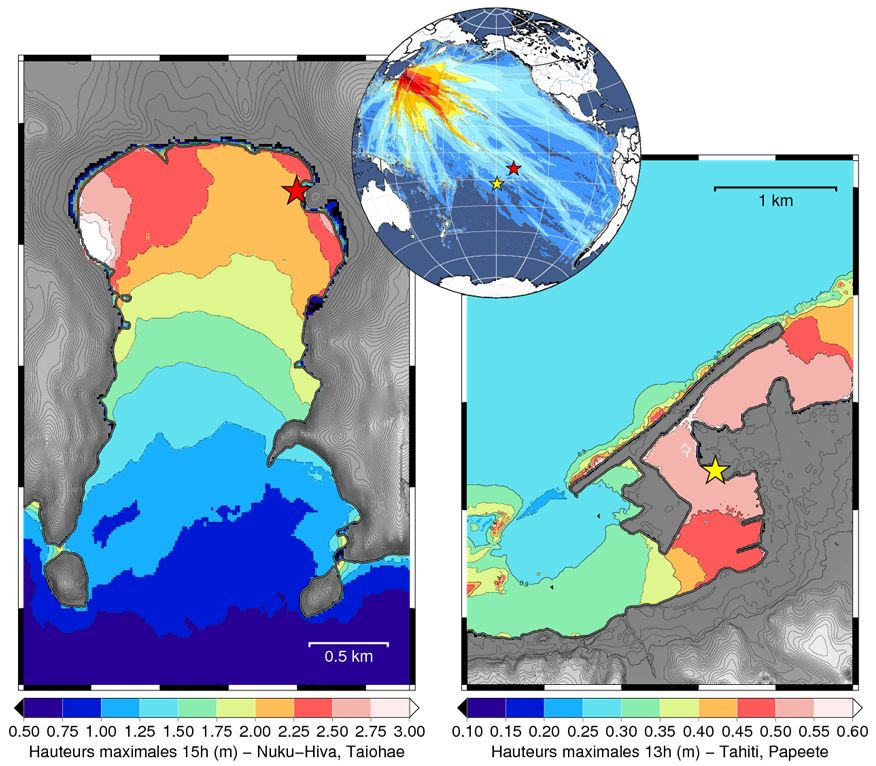
The source parameters are used to calculate the coseismic deformations and then to simulate the tsunami propagation. Arrival times are calculated and tsunami heights are then estimated in the form of forecast inundation maps. In French Polynesia, where propagation times are generally more than 7 to 8 hours (except for sources in the Southwest Pacific), these simulation results allow the expected tsunami heights to be specified down to the coastal detail level (Figure 14). This information is transmitted to the Civil Protection to decide whether or not to create a crisis cell for the management of the tsunami warning in progress.
5. Messages to remember
Tsunamis have a geological cause, and are able to hit close and remote coastlines where they can inundate and cause major destruction.
- The Pacific Ocean is the most exposed region due to its tectonic activity;
- However, all ocean and sea basins can be affected, especially in tectonic and volcanic areas, more or less frequently;
- Data needed to monitor a tsunami are seismic data and sea level measurements from open sea to coast;
- Outside the Pacific, which has already been equipped since the 1960s, warning systems have been built in other basins between 2005 and 2012;
- Numerical simulation allows a tsunami to be simulated from its initiation to coastal inundation, and is all the more efficient if the numerical tools are regularly compared with seismic and sea level data;
- Warning systems are effective if the data are numerous, transmitted and analysed in real time, and comparable to high-performance numerical models;
- Warning messages are effective when risk awareness is developed, based on education of the general public and training of the authorities: repeated exercises are necessary to prepare;
- A better education and understanding of the phenomena is essential for the prevention of exposed populations, and it must be coupled with political decisions for an adapted development of the coastline (signalling, constructability, evacuation…).
It is under these conditions that tsunamis, sometimes very rare, sometimes surprising, and still forgotten or underestimated in many regions, can be properly prevented and mitigated the next time they occur.
This article is based on contributions from the two lead authors, as well as A. Gailler, P. Heinrich and A. Paris (CEA, DAM, DIF, Arpajon) as well as A. Jamelot, O. Hyvernaud and D. Reymond (Laboratoire de Géophysique de Pamatai, French Polynesia).
Notes and References
Cover image. Modelling of the surface of the Atlantic Ocean, for a scenario similar to the tsunami resulting from the Lisbon earthquake of 1755, extracted after 3 hours of propagation
[1] Propagation of waves in an ocean or a sea, following an underwater geological phenomenon (earthquake, landslide or volcanic explosion). The tsunami is greatly amplified when it arrives at the coasts where it can cause major flooding.
[2] Dimensionless quantity characterizing the energy released by the seismic source. A unit of magnitude corresponds to an energy multiplied by 30.
[3] ROGER, J. (2011) Tsunamis générés par des séismes au niveau de la zone de collision entre les plaques africaine et eurasienne : études de cas pour l’évaluation du risque tsunami en Méditerranée occidentale et Atlantique nord. Doctoral thesis, Université Pierre et Marie Curie, 347 p.
[4] A fault is a fracture plane that divides a boulder into two compartments or separates two tectonic plates
[5] JAMELOT, A, GAILLER A, HEINRICH P, VALLAGE A, CHAMPENOIS J (2019) Tsunami Simulations of the Sulawesi Mw 7.5 Event: Comparison of Seismic Sources Issued from a Tsunami Warning Context Versus Post-Event Finite Source, Pure Appl Geophys 176. 3351-3376 https://doi.org/10.1007/s00024-019-02274-5
[6] PARIS, R (2015) Source mechanisms of volcanic tsunamis, Philos T Roy Soc A 373, 20140380, http://doi.org/10.1098/rsta.2014.0380
[7] PARIS, A., OKAL, E. A., GUERIN, C. et al. (2019) Numerical Modeling of the June 17, 2017 Landslide and Tsunami Events in Karrat Fjord, West Greenland. Pure Appl. Geophys. 176, 3035-3057. https://doi. org/10.1007/s00024-019-02123-5
[8] ALLGEYER, S. (2012). Modélisation de l’aléa tsunamis et des résonances côtières en France. PhD thesis, Université Paris Diderot, 202 p.
[9] OCCHIPINTI G, ROLLAND L, LOGNONNÉ P, WATADA S (2013) From Sumatra 2004 to Tohoku-Oki 2011: The systematic GPS detection of the ionospheric signature induced by tsunamigenic earthquakes, J Geophys Res Space 118. 3626-3636. https://doi.org/10.1002/jgra.50322
[10] SAHAL, A. (2011) Le risque tsunami en France : contributions méthodologiques pour une évaluation intégrée par scénarios de risque. Doctoral thesis, Université de Paris 1 Panthéon-Sorbonne, 315 p.
[11] HEBERT, H., SCHINDELE F., SLADEN A. (2005) Comprendre et prévenir les tsunamis. Les apports de la simulation numérique, Annales des Mines, 40 « Les Catastrophes naturelles », 35-47.
[12] SCHINDELE, F and HEBERT, H. (2006). A quand la prévision des tsunamis, Geosciences, 4, 76-81.
[13] PEROCHE, M. (2016) La gestion de crise tsunami dans la Caraïbe : contribution géographique aux dispositifs d’alerte et d’évacuation des populations. Doctoral thesis, Université de Montpellier 3, 406 p.
[14] CENALT is the National Tsunami Warning Centre for the French metropolitan coasts and for seismic-type sources.
[15] GAILLER, A. et al (2019). Vers une estimation en temps réel de l’amplification côtière au centre national d’alerte aux tsunamis français. Chocs Avancées, 12, 42-43.
The Encyclopedia of the Environment by the Association des Encyclopédies de l'Environnement et de l'Énergie (www.a3e.fr), contractually linked to the University of Grenoble Alpes and Grenoble INP, and sponsored by the French Academy of Sciences.
To cite this article: HEBERT Hélène, SCHINDELE Francois (December 14, 2021), Tsunamis: Knowing them to forecast them better, Encyclopedia of the Environment, Accessed April 25, 2024 [online ISSN 2555-0950] url : https://www.encyclopedie-environnement.org/en/soil/tsunamis-knowing-them-to-forecast/.
The articles in the Encyclopedia of the Environment are made available under the terms of the Creative Commons BY-NC-SA license, which authorizes reproduction subject to: citing the source, not making commercial use of them, sharing identical initial conditions, reproducing at each reuse or distribution the mention of this Creative Commons BY-NC-SA license.