Climate variations in the last millennium
PDF
To understand the mechanisms that govern the dynamics of the current climate and predict its future evolution, it is important to differentiate between anthropogenic and natural climate variations. In this context, studying the climate before the influence of human activities becomes preponderant is particularly instructive. The last millennium is a privileged target for paleoclimatologists because this period is rich in natural archives that allow us to reconstruct the climate. The amplitude of the global temperature variations observed up to the end of the 19th century is relatively small and does not exceed ½ degree by taking 25-year averages. This allows us to put into perspective the magnitude of recent changes due to human activities. At the regional level, some of the variations observed during the last millennium may be rapid and reach or even exceed the degree for several years. Analysis of the mechanisms that govern these variations provides crucial information to better understand climate at scales important for implementing measures to protect against climate-related risks.
- 1. Reconstructing past climates
- 2. Global temperature changes
- 3. Origin of changes: contribution of climate forcings and internal variability
- 4. Simulations of the climate of the last millennium
- 5. Medieval Optimum and the Small Ice Age on a Regional Scale
- 6. Changes in the hydrological cycle
- 7. Messages to remember
1. Reconstructing past climates
1.1. Instrumental data and written sources
Many sources of information are available to study past climates and they must generally be combined to provide reconstructions over several centuries.
Instrumental data, obtained for example by means of thermometers or rain gauges, are very useful as they provide direct and generally reliable information on the modern climate. However, in most regions, these data cover less than a century, which is not sufficient to study some of the climatic variations that occur over longer periods of time.
In Europe, some time series from thermometers cover up to several centuries, but their number is insufficient to know precisely how the climate is changing. Information on climate is also present in various written documents, such as newspapers, columns, or annals. These documents sometimes relate directly to weather observations, and sometimes give indirect indications of climate such as crop yields, harvest dates, etc. However, again, the spatial coverage of these data is relatively limited, with most sources located in Europe, China and Japan.
1.2. Natural Climate Archives
As a result, paleoclimatologists generally reconstruct the climate based on different natural archives that indirectly record climate fluctuations. The time series obtained from these records are often referred to as climate proxies, proxy-data or simply proxies.
We have a relatively large amount of data for the last millennium (Figure 1) compared to more distant periods in time, with generally low uncertainty about the dating of observations. This makes it possible to obtain a large number of reconstructions based on these natural archives, with relatively good reliability.
To obtain a climate reconstruction from a natural archive, it is necessary to study a biological or physical system that is sensitive to climate and leaves a trace that can be measured. This is the case, for example, with ice cores, marine sediments, stalagmites (see for example ref. [1]), or living or dead trees.

2. Global temperature changes
2.1. Rebuild past temperatures
Observations made on natural archives allow local or regional climatic conditions to be reconstructed. To obtain estimates of climate change on a continental scale or even on a global scale, different observations must be combined.
To do this, many techniques have been applied (see for example PAGES 2k Consortium 2013 [2], 2017 [3]), with very different levels of complexity. Many of these techniques are based on the relationship between the variable to be reconstructed (e. g. global temperature) and the time series derived from paleoclimatic observations.The [4] method is first calibrated over the recent period using instrumental observations and then applied to the last millennium assuming that the relationship between the reconstructed variable and the measured data is stable over time.
The reconstructions of temperature on a continental or global scale covering the last millennium are of course less accurate than those based on instrumental data for the last few decades. They show differences according to the selected data and the techniques used to carry out the reconstruction. However, some characteristics are common to all reconstructions, and are therefore considered robust, making it possible to describe in a fairly reliable way the main variations in the global climate of the last millennium.
2.2. A general cooling during the last millennium
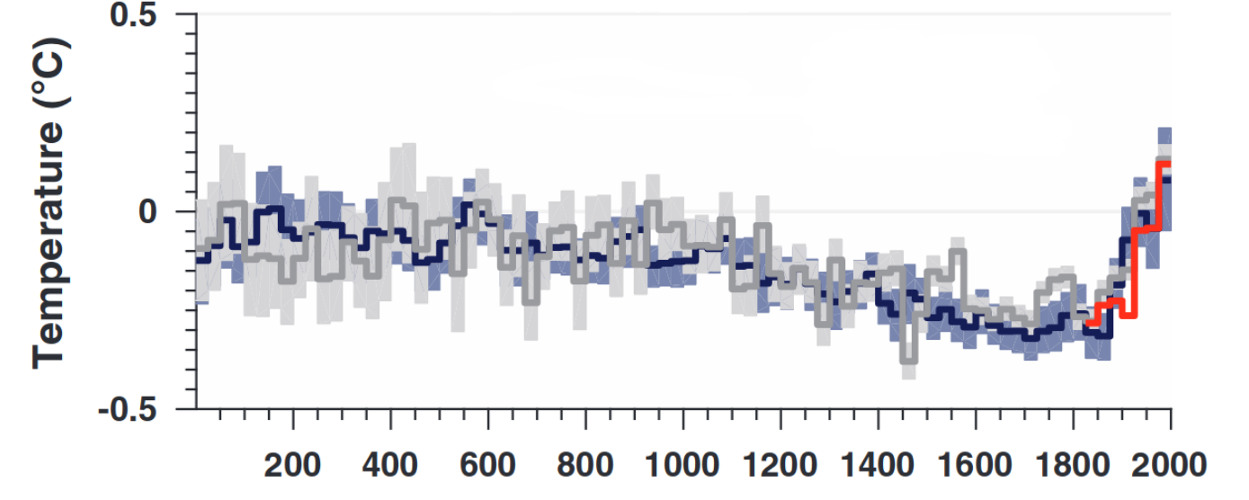
In addition to these general trends, more rapid fluctuations are observed. In particular, the first part of the millennium is not uniformly hot with a cooling for example around 1100. On the other hand, the following period is not uniformly cold with a hot episode for example at the end of the 18th century.
The amplitude of the variations on the global scale is relatively small, being less than half a degree when taking 25-year averages. The warming observed during the 20th century therefore appears exceptional compared to these small fluctuations and all available global reconstructions covering the last millennium until the recent period have their maximum during the latter period.
3. Origin of changes: contribution of climate forcings and internal variability
3.1. Anthropogenic and natural forcings
Forcing here refers to any disturbance that alters the Earth’s total energy balance. These forcings can either be of natural or anthropogenic origin.
The global warming observed over the past century has been unequivocally attributed to the impact of human activities, specifically the increase in the concentration of greenhouse gases in the atmosphere (see The Climate Machine and A Carbon Cycle Disturbed by Human Activities). The man-made changes in climate were not negligible until 1850. For example, land use change through deforestation has significantly affected regional temperatures. However, they have had a weaker influence at the global level.
At the scale of the last millennium, the two natural forcings that can potentially play a major role are variations in solar activity (see Solar Activity Variability and Climate Impacts: the case of recent centuries) and major volcanic eruptions. Astronomical forcing, which is dominant at longer time scales, and in particular one of the drivers of glacial-interglacial cycles, has a very limited effect on this period.
3.2. Response to solar and volcanic forcing
Many studies have been devoted to the impact of changes in solar activity on temperatures over the past few millennia. It is expected that a higher solar irradiance (see Solar Activity Variability and Climate Impacts: the case of recent centuries) will lead to higher temperatures and this is what is simulated by climate models (see section 4). However, the effect is probably relatively small at the millennium scale and it has not yet been possible to formally detect an impact of solar forcing in global temperature variations reconstructed from paleoclimatic records.
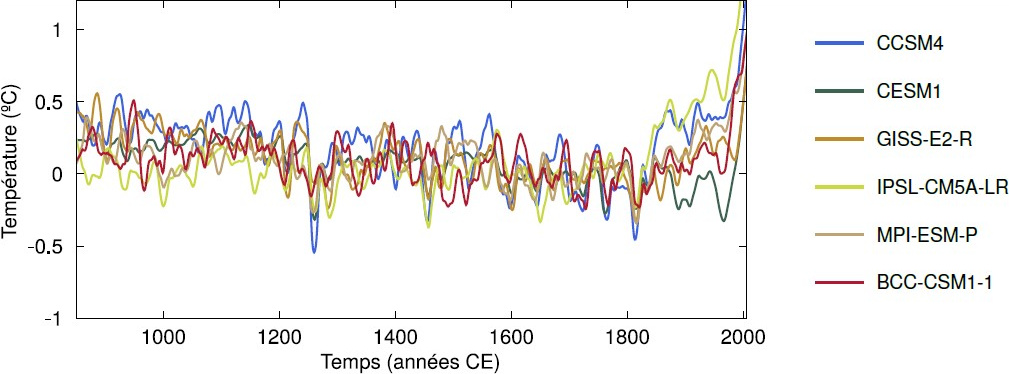
For this cooling to be perceptible on a large scale, the volcanic eruption must be powerful enough to send aerosols into the stratosphere at an altitude of over 10 km. The dust or elements that remain in the lower layers of the atmosphere settle too quickly or are washed away by rainfall. Although the impact of an individual eruption usually lasts only a few years, several nearby eruptions can have a longer-term influence. In particular, the large number of eruptions at the beginning of the 19th century largely explains why this period was particularly cold compared to the rest of the millennium, as simulated by climate models (Figure 3) [6].
3.3. Role of natural variability
However, a significant part of the observed changes cannot be linked to these external causes, and is directly related to internal climate variations (see Climate Variability: The North Atlantic Oscillation Example). Internal variability results from interactions between the different components of the climate system. It can, for example, be induced by a temporary change in winds or ocean currents influencing the transport of thermal energy from one point of the Earth to another.
This implies that internal variability is often characterized by warming in some regions and cooling in others, which leads to offsets when estimating an overall average. The magnitude of changes associated with internal variability is therefore smaller at the global scale than at the regional scale. But it is far from negligible, even globally, as evidenced by the several tenths of a degree increase in global temperature due to an El Niño event.
4. Simulations of the climate of the last millennium
4.1. Agreement between simulated temperatures and reconstructions
Climate models (see Biosphere, hydrosphere and Cryosphere models) are used to simulate past or future climate evolution. For the last millennium, they are forced by realistic estimates of natural (volcanic and solar) and anthropogenic forcings. Their results are then a source of information on past climates that complements climate reconstructions based on natural archives.
Although a disparity exists in their results (Figure 3), a comparison with Figure 2 shows that the models are able to simulate a large-scale temperature evolution in good agreement with the reconstructions, also showing a general cooling trend between the 11th and 19th centuries before recent warming. This is an excellent test of their validity and enhances their credibility to understand past variations and predict future changes.
4.2. Simulated response to forcing
The good performance of the models also allows us to better understand the processes responsible for the changes, in particular the contribution of different forcings and natural variability, by analyzing their results. This confirms, for example, that if changes during the pre-industrial period are related to natural forcings and internal climate variability, recent global warming can only be simulated if anthropogenic forcings are taken into account.
However, it is important to stress the significant uncertainties in past climate reconstructions, forcing estimates and model representation of climate dynamics. It is therefore important to take these uncertainties into account when comparing model results with reconstructions. However, the appropriate combination of these complementary sources of information provides us with valuable keys to quantifying and understanding climate variations from the 10- to 100-year scale.
5. Medieval Optimum and the Small Ice Age on a Regional Scale
5.1. Regional temperature changes
In the northern hemisphere, continental temperatures have similar characteristics to global temperatures with a tendency to cool until the 19th century followed by a strong warming.
However, the impact of some major volcanic eruptions is such that they generally lead to clearly identifiable regional colds. For example, the eruption of the Tambora in 1815 caused significant colds in many parts of Europe and North America the following year. Chroniclers have regularly referred to 1816 as “the year without summer”, with significant decreases in harvests.
5.2. Medieval warm period and medieval optimum
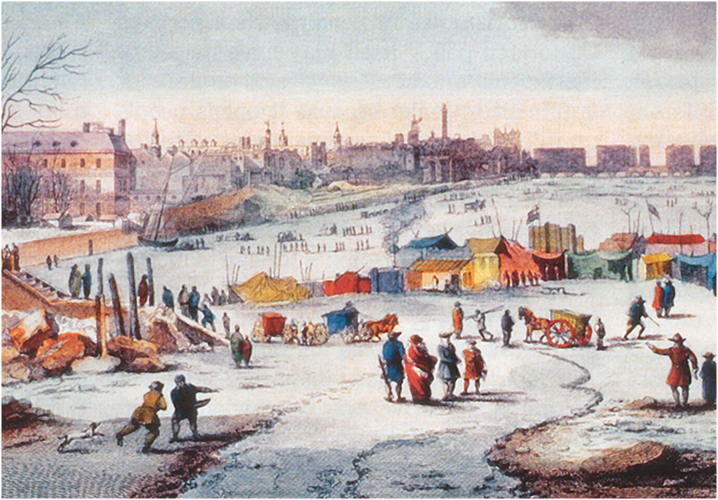
However, the interpretation of certain events is often complex. For example, developments on the Thames (especially bridges) have altered the flow of the river and thus strongly influenced the probability of freeze-up, regardless of changes in climatic conditions.
More generally, the concepts of medieval optimum and early ice age should be used with caution [8], being relatively vague. In particular, there is no precise definition of the years covered by these periods. It is possible to find warm decades in the early Ice Age and cold decades in the warm medieval period.
Moreover, climate variations during these periods are not consistent on a global scale. Maximum or minimum temperatures do not generally occur at the same time in different regions. It can be misleading to want to assign them a common origin or to seek a strong physical connection.
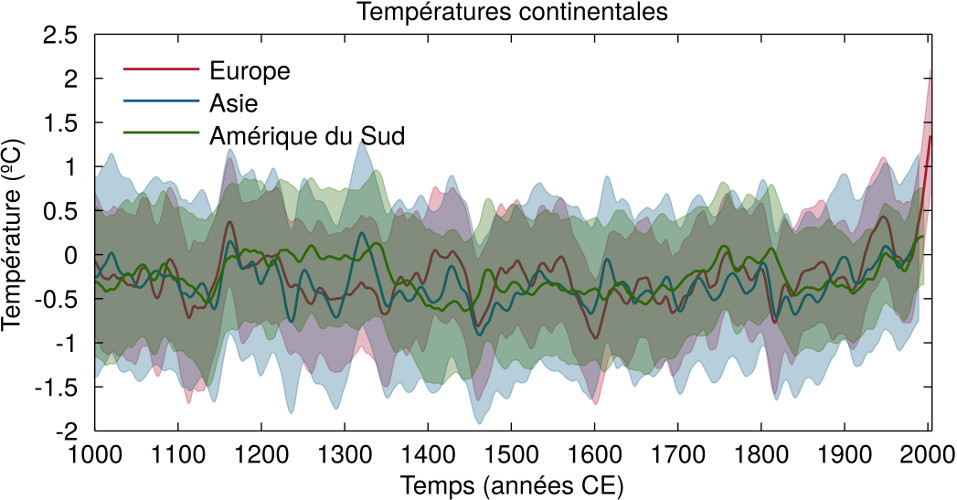
Finally, this distinction between a medieval optimum and a small ice age seems more appropriate for the continents of the Northern Hemisphere than for other regions of the world. Although cold conditions were observed in many places between the 17th and 19th centuries, maximum temperatures are not necessarily reached between the 10th and 12th centuries, particularly in the southern hemisphere (Figure 4).
6. Changes in the hydrological cycle
6.1. Global and regional variations
In inter-tropical regions, variations in the hydrological cycle have more consequences than temperature variations on ecosystems and physical systems such as lakes. These impacts therefore leave important signals in paleoclimatic records that allow us to reconstruct indices characterizing wet or dry conditions over the past millennium.
Changes in the hydrological cycle are highly variable from one region to another. As a result, there are no strong trends at the global or even continental level, except for a limited decrease in precipitation in some regions following volcanic eruptions. However, at the regional level, large variations have been reconstructed on the basis of paleoclimatic records.
6.2. Mega-droughts of the last millennium
Perhaps one of the most spectacular elements is the existence of long dry spells in some semi-arid regions such as the western United States. These mega-droughts observed over the past millennium can last several decades, and some of them correspond to conditions that have not (or very little) been observed during the instrumental period (Figure 6) [9]. One direct evidence of these droughts is the drop in the level of some lakes that has allowed trees to grow in dry areas before being submerged again in wetter periods. This is a striking example of how the last 150 years do not cover the full range of possible climate variations on a decadal and centennial scale, and that we need to look to more distant periods to obtain information complementary to that derived from instrumental observations.
6.3. Origin of precipitation changes
In general, precipitation is much more variable in time and space than temperature. Changes in precipitation are thus less well understood, and more difficult to reconstruct, than changes in temperature.
In many regions, temperature is influenced first-order and quite directly by large-scale energy balances that are quite well known. Circulation changes and local phenomena, which are more complex, also play a role for temperatures but are of less relative importance than for precipitation.
In addition, climate models generally have larger biases for precipitation. The conclusions that can be deduced from their results are therefore often more uncertain for precipitation than for temperature.
A clear conclusion is that natural variability generally has a dominant influence on precipitation, in relation to major modes of variability such as the North Atlantic Oscillation and the El Niño phenomenon that dominates interannual variations observed over the past decades. Changes in ocean surface temperature also seem to have a large impact on variations on a larger time scale.
7. Messages to remember
- The global temperature decreased between the beginning of the last millennium and the 19th century by a few tenths of a degree before increasing very rapidly.
- Global temperature is influenced by natural (especially volcanic) and anthropogenic forcings. Anthropogenic forcing has been dominant for a century and explains the recent warming.
- Natural climate variability has had a strong impact on regional temperature and precipitation changes over the past millennium.
Notes and references
Cover image. Pieter Brueghel the Elder. Les Chasseurs dans la neige (1565, Kunsthistorisches Museum Wien) and La Moisson (August-September) (1565, Metropolitan Museum of Art New York). [Source: Public domain]
[1] Evans, M.N., S.E. Tolwinski-Ward, D.M., Thompson, and K.J. Anchukaitis, 2013. Applications of proxy system modeling in high resolution paleoclimatology. Quaternary Science Reviews 76: 16-28, https://doi.org/10.1016/j.quascirev.2013.05.024.
[2] PAGES 2K Consortium, 2013. Continental-scale temperature variability during the past two millennia. Nature Geoscience, 6(5): 339-346, http://dx.doi.org/10.1038/ngeo1797.
[3] PAGES 2K Consortium, 2017. A global multiproxy database for temperature reconstructions of the Common Era. Scientific Data, 4, http://dx.doi.org/10.1038/sdata.2017.88.
[4] These methods are often based on linear regressions.
[5] Brönnimann S and D. Krämer, 2016. Tambora and the “Year Without a Summer” of 1816. A Perspective on Earth and Human Systems Science. Geographica Bernensia G 90. ISBN 978-3-905835-46-5 (http://www.geography.unibe.ch/services/geographica_bernensia/online/gb2016g9001/index_eng.html)
[6] PAGES2k-PMIP3 group, 2015. Continental-scale temperature variability in PMIP3 simulations and PAGES 2k regional temperature reconstructions over the past millennium. Climate of the Past, 11, 1673-1699, https://www.clim-past.net/11/1673/2015/.
[7] PAGES 2K Consortium, 2013. Continental-scale temperature variability during the past two millennia. Nature Geoscience, 6(5): 339-346, http://dx.doi.org/10.1038/ngeo1797.
[8] Diaz H.F., R. Trigo, M. K. Hughes, M. E. Mann, E. Xoplaki, and D Barriopedro, 2011. Spatial and temporal characteristics of climate in medieval times revisited. Bulletin of the American Meteorological Society 92: 1487-1500 (https://journals.ametsoc.org/doi/abs/10.1175/BAMS-D-10-05003.1)
[9] Cook, E.R., C.A. Woodhouse, C.M. Eakin, D.M. Meko and D.W. Stahle, 2004. Long-term aridity changes in the western United States. Science, 306(5698): 1015-1018, (https://doi.org/10.1126/science.1102586)
The Encyclopedia of the Environment by the Association des Encyclopédies de l'Environnement et de l'Énergie (www.a3e.fr), contractually linked to the University of Grenoble Alpes and Grenoble INP, and sponsored by the French Academy of Sciences.
To cite this article: GOOSSE Hugues, KLEIN François (August 16, 2019), Climate variations in the last millennium, Encyclopedia of the Environment, Accessed April 16, 2024 [online ISSN 2555-0950] url : https://www.encyclopedie-environnement.org/en/climate/climate-variations-last-millennium/.
The articles in the Encyclopedia of the Environment are made available under the terms of the Creative Commons BY-NC-SA license, which authorizes reproduction subject to: citing the source, not making commercial use of them, sharing identical initial conditions, reproducing at each reuse or distribution the mention of this Creative Commons BY-NC-SA license.