Are we at risk of water shortage?
PDF
Water on Earth is essentially salty, and it is the evaporation of this water on the oceans that mainly feeds the great water cycle, through evaporation, condensation and precipitation, whose thermal engine is solar radiation. This cycle supplies water to the continents and breaks down into blue water flowing in rivers and groundwater, and green water, which is stored in the soil after rain and is recovered and transpired by vegetation. These flows are almost entirely used by natural continental and coastal ecosystems, as life has developed everywhere to the limits of available resources. Globally, the share of this resource consumed by humanity is still modest: 7% of blue water and 9% of green water, but the spatial distribution of the humanity is not consistent with the spatial distribution of water resources: 21.5% of humanity is concentrated in steppes and arid zones with only 2% of the planet’s blue water resources… In addition, water needs are increasing due to population growth and changes in food habits, while water resources are being affected by climate change. How to solve this challenge of balancing supply and demand in 2050, and a fortiori in 2100, by avoiding, if possible, shortages, famines, bloody conflicts and migration?
1. How much water do we have?

Water on Earth is 97% salty, it is its evaporation by solar radiation that feeds the great water cycle, by condensation and precipitation. In this way, 113,000 km3/year are brought to the continents, an enormous volume (1270 times the volume of Lake Geneva) that is broken down into blue water, the one that falls and flows into rivers and aquifers (32%), in green water (see Figure 2), that stored in soils after rain, taken up by roots and transpired by vegetation (65%) and 3% in merge water from icebergs (Hoekstra and Mekonnen, 2012). Our water resource is essentially these inputs from the great water cycle.
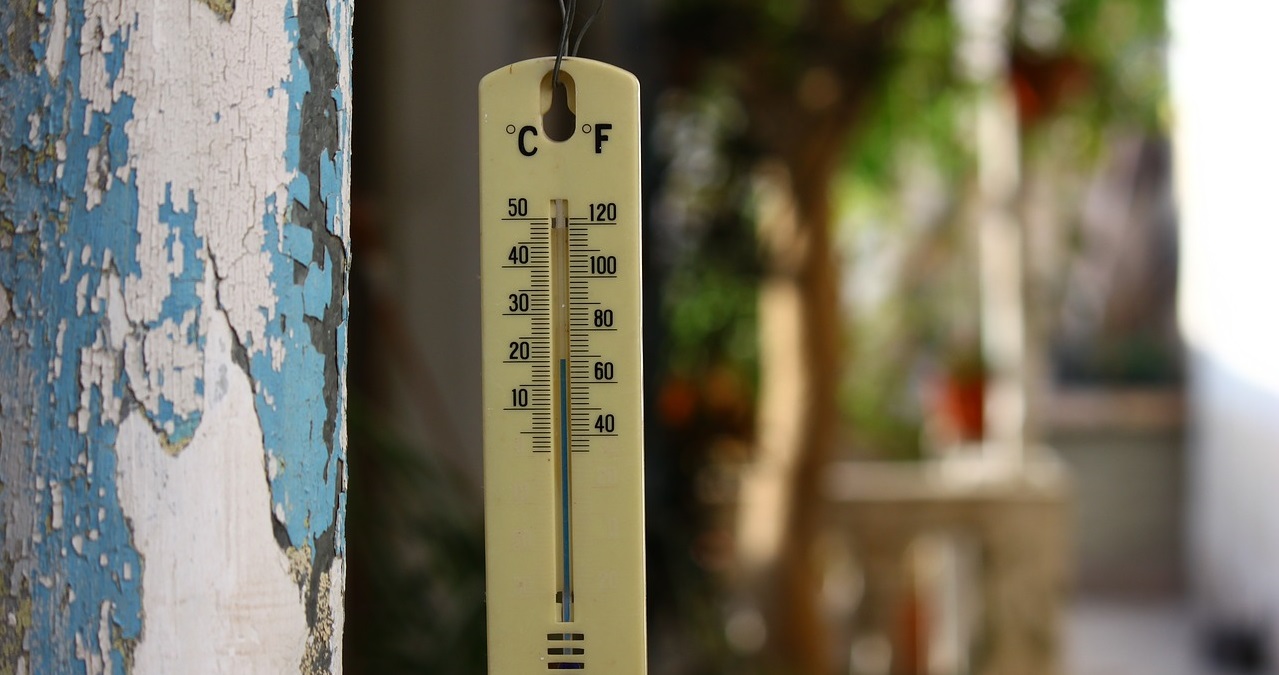
Global warming (read The climate machine) will accelerate this cycle and on average increase precipitation while displacing climate zones towards the poles, causing an aridification of Mediterranean latitudes: 110 million hectares (ha) cultivable in these latitudes should be lost, but 160 million ha should be won in northern latitudes (Canada, Siberia) by warming. The frequency of extreme events (floods, droughts) is also expected to increase. In France, a 10 to 20% decrease in precipitation is expected by the end of the century, mainly in summer.
2. The water we use
Men currently consume 7% of the blue water flow, but withdrawals are higher (13%), the consumed part (mainly irrigation water) evaporates and returns to the atmosphere; the unused part remains liquid, infiltrates and returns to groundwater and rivers. We use 9% of the green water for agriculture, the rest goes to natural ecosystems (forests, savannahs, wetlands). We also take a little of fossil water from the stocks contained in the large aquifers of a few countries (India, United States, China, China, Pakistan, Iran, Mexico) at a rate of about 100 km3/year (Döll et al, 2014), but this situation is not sustainable, the stocks of these aquifers will be depleted in a few decades, requiring the collection of water by channels in the large Himalayan rivers (Yang Tse, Gange….) or in other water-rich sites. The fusion of high mountain glaciers due to the overheating of some rivers from the Alps, Himalayas, Rocky Mountains, and especially the Andes Cordillera, where cities like La Paz and the Pacific coast of Peru now live mainly on these melting waters, which will have dried up in less than 30 years.

The quantity of domestic water, a definition of which can be found in Figure 2, used ranges from 20 to 500 l/day per person, on average 300 l/d, or 110 m3/year per person. In France, it is estimated at 150 l/day. In 2050, the world population world population should increase to 9.5 billion (Gerland et al., 2014) and to 11 billion in 2100, with worrying growth mainly in Africa (1 billion in 2000, 2.5 billion in 2050 and 4.2 billion in 2100…). With 250 l/d, the total amount of water needed for the planet in 2050 would represent 870 km3/year, or 0.8% of precipitation, or 2.4% of blue water. Domestic water is therefore not a problem of quantity, but only of transport and quality, so of supply and treatment infrastructure. The planet will never have a shortage of domestic water if it builds these infrastructures in time. The city of Windhoek (350,000 inhabitants), the capital of Namibia in the middle of the desert, has been supplied with water for 30 years by a dam and an 800 km long pipe, as well as by the recycling of its treated wastewater, which is re-injected into the local groundwater… !
For industrial water, we each use about 1,300 m3/year. But this water is only 10% consumed; 90% of it is discharged into the environment, sometimes heated (cooling water) or polluted, if it is not treated.
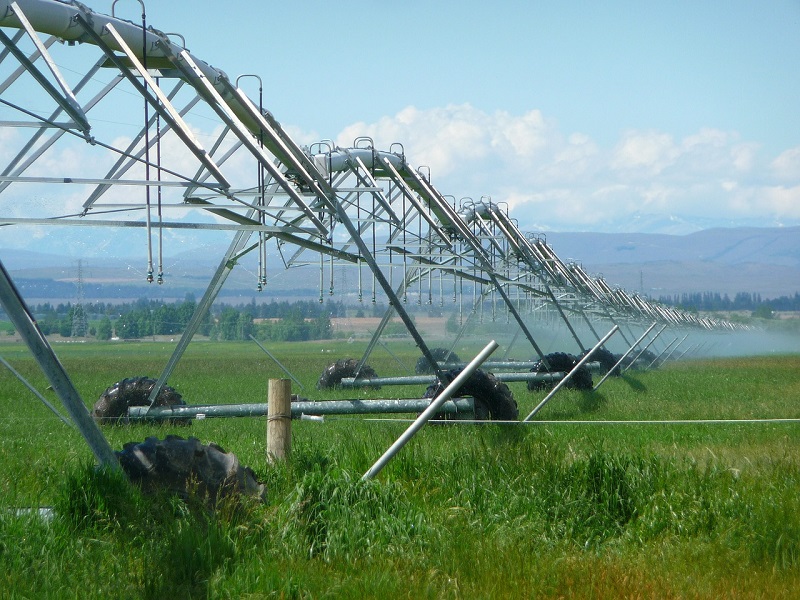
Agricultural water (see Figure 3) is the dominant term (Griffon, 2006; Agrimonde, 2010; Leridon et al., 2011; Marsily (et al.), 2006, 2015a, 2015b). A few 10,000 km3/year of water are needed to feed 7.2 billion people today: 6,500 km3of green water falling on 1.5 billion ha of rainfed agriculture and 3.2 billion ha of pasture land. In addition, 3,500 km3 blue water (50% of which is lost) is collected from rivers and groundwater to water 280 million ha irrigated. It is therefore 8,000 km3/year in the end that it takes to feed humans, i.e. 1,150 m3/year for each (ten times more than domestic water). Yet, and this is scandalous, 1 billion people are still undernourished, in sub-Saharan Africa and South-East Asia, in heavily watered areas, and not in the arid zone; this situation is due to underdevelopment (inefficient and insufficient agricultural production, very low use of inputs, lack of development: dams, irrigated areas,…); see Map 1. Demany countries are also unable to produce the food they need, due to a lack of cultivable land or water: their population has exceeded the country’s capacity to feed them from local resources, and eating habits have changed; they have to import food from countries with surplus production (North and South America, Australia, Thailand, France). More than 30% of the food produced on the planet is now transported from one country to another, mainly by boat; it is referred to as virtual water, because water-deficit countries balance this deficit not by importing water, but food, which required water to be produced.

Importing countries, to pay for these imports, sell energy or mineral raw materials, have industrial or tertiary activities, tourism, or have financial returns from the emigrant diaspora. Some countries export high-value agricultural products (coffee, cocoa, cotton) and import food. But importing countries are then dependent, with the risk of political pressure and price pressure in the event of a global shortage. Food autonomy is impossible to achieve today for all countries in the arid zone (North Africa, Middle East) and tomorrow for the whole of Asia, due to the lack of arable land. We see countries like China buying important farmland in developing countries (especially Africa and South America) to grow their own crops and then import the food they need into their countries. Jordan thus depends for 70% on virtual water from abroad, Djibouti for more than 90%. Figure 4 shows the regions of the world according to their blue water resources or needs.
3. The water of tomorrow
In 2050, to supply everyone with the current diet, 11,000 km3 of water per year would be needed, which is possible if deficit countries can afford to buy their food from exporting countries, and if they agree to produce beyond their own needs. If meat consumption accelerates, it will take 13,000 km3/year. Meat consumption has a very large effect on water requirements: 13,000 litres of water are required to produce 1 kg of grain-fed beef, which is 13 times more than for 1 kg of wheat!
These 11,000 to 13,000 km3/year will be divided between rainfed and irrigated agriculture: we will have to increase yields and cultivated areas everywhere. But who says more rainfed agriculture ditclearance and who says more irrigation dit dam construction. The construction of dams or clearing will necessarily have harmful environmental consequences, but if the world’s population continues to grow, should we not try to feed it in the least harmful way possible? Seawater desalination has a cost of about 0.7 €/m3, and an electricity consumption of 2 to 4 kWh/m3 : this is about ten times too much for irrigation water, but acceptable for domestic water.
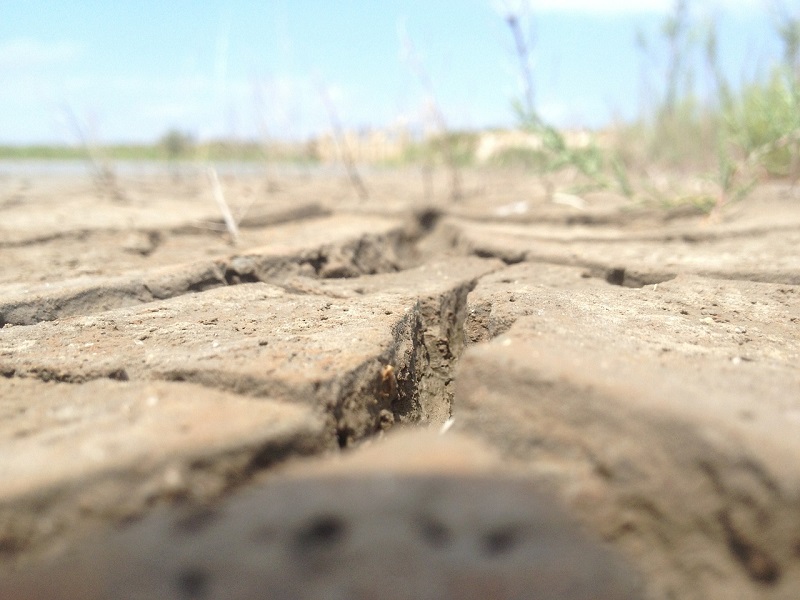
Unfortunately, it seems that we can once again get to know worldwide-families. In 1998, a severe drought in Southeast Asia (China and Indonesia) led to massive purchases of cereals on world markets, with a sharp reduction in stocks, which would have been insufficient if the drought had continued (Rojas et al. 2014; Lizumi et al. 2014). However, stocks have gone from 10 months of global consumption 20 years ago to 2 months today… These years of severe drought in monsoon areas are linked to very intense El Niño events, which occur on average twice a century, according to statistics compiled from parish registers in South America (Orltieb, 2000), and were observed for example in 1876-1878 and 1896-1900 at 19th century, each time causing about 30 million deaths (Sen and Drèze, 1999); in the 20th century, they occurred in 1940 and 1998. The effect of climate change on the frequency and intensity of El Niño events is currently under discussion.
To this worrying image of future agricultural production needs, we can first of all contrast the reduction of waste, because today about 30% of the food purchased is thrown away in rich countries, or lost through poor harvest or poor conservation in poor countries ; we can also contrast the sobriety of diets, because the amount of water needed to feed a landowner varies from 600 to 2500 m3/year depending on the country, the consumption of animal products being the main factor of variation : rich countries consume about twice as many animal products as nutritional needs, emerging countries are on average at the right level, and poor countries on average one-third below needs. But to meet the food needs of water-deficit countries, there are only three options: transfer water through large channels, as China has decided to do (or should decide to do in India), transfer virtual waterin the form of food, or ultimately accept the migration of populations from deficit countries to rich countries, driven from their homes by bloody conflicts and hunger riots, whose recent history has given grim examples (see the focus associated with this article). The problem of migrants that we face today is only the beginning of a long history, which will intensify with climate change, population growth and increased consumption of animal products…
References and notes
AGRIMOND (2010) Scenarios and challenges for feeding the world in 2050. Coordinated by S. PAILLARD, S. TREYER & B. DORIN. Editions Quae, Versailles, 295 p.
DIAMOND, J. (2006) Collapse. How societies decide on their disappearance or survival. Gallimard, Paris, 648 p. (Translated from the English, “Collapse”, Viking Penguin, 2005).
DÖLL, P., MÜLLER SCHMIED, H., SCHUH, C., PORTMAN, F.T., EICKER, A. (2014) Global-scale assessment of groundwater depletion and related groundwater abstractions: combining hydrological modeling with information from well observations and GRACE satellites. Water Resour Res. doi:10.1002/2014WR015595
GERLAND P., RAFTERY A., SEVCIKOVA H., LI N., GU D., SPOORENBERG T., ALKEMA L., FOSDICK B., CHUNN J., LALIC N., BAY G., BUETTNER T., HEILIG G. & WILMOTH J. (2014) World population stabilization unlikely this century. Science, 346 : 234-237 ; doi: 10.1126/science.1257469.
GLEICK, P.H. (2014) Water, Drought, Climate Change, and Conflict in Syria. Wea. Climate Soc., 6, 331-340; doi: http://dx.doi.org/10.1175/WCAS-D-13-00059.1.
GRIFFON M. (2006) Feeding the planet. Odile Jacob, Paris: 456 p.
HOEKSTRA, A., M. MEKONNEN (2012) The water footprint of humanity. Proceedings of the National Academy of Sciences of the USA. www.pnas.org/cgi/doi/10.1073/pnas.1109936109
IWMI (INTERNATIONAL WATER MANAGEMENT INSTITUTE) (2007) Water for Food, Water for Life: the Comprehensive Assessment of Water Management in Agriculture. D. Molton (ed.), Earthscan, London, UK, 645 p.
LERIDON, H., MARSILY G. de, coord. (2011) Demography, climate and global food supply. EDP Sciences – Report of the Académie des Sciences, Paris, 313 p. (and www.academie-sciences.fr)
LIZUMI, T., LUO, J., CHALLINOR, A., SAKURAI, G., YOKOZAWA, M., SAKUMA, H., BROWN, M., YAMAGATA, T. (2014) Impacts of El Niño southern oscillation on the global yields of major crops. Nat Commun 5:3712. doi:10.1038/ncomms4712
MARSILY, G. de (2006) Les Eaux Continentales. EDP Sciences, Report of the Académie des Sciences, Paris, 328 p. (and www.academie-sciences.fr)
MARSILY, G. de (2015a) Water, a coveted renewable resource and unequally distributed. Ann. Northern Geol. Soc. T. 22 (2nd series), December 2015.
MARSILY, G. de, ABARCA DEL RIO, R. (2015b) Water and Food in the 21st Century. Surveys in Geophysics, v.36, n°4, July 2015, DOI 10.1007/s10712-015-9335.
ORTLIEB, L. (2000) The documented historical period of El Niño events in Peru: an update of the Quinn record (16th to 19th centuries). In: DIAZ H.F. & MARKGRAF V. eds, El Niño and the southernoscillation. Multiscale variability and local and regional impacts. Cambridge University Press: 496 p.
ROJAS, O., LI, Y., CUMANI, R. (2014) Understanding the drought impact of El Niño on the global agricultural areas: an assessment using FAO’s Agricultural Stress Index (ASI), FAO, Climate, energy and tenure division (nRc) publications. ISBN: 978-92-5-108671-1, ISSN 2071-0992
SEN, A., DRÈZE, J. (1999) Omnibus. Oxford University Press, New Delhi (India): 945 p.
WILS, W., CARAEL, M., TONDEUR, G. (1986) Le kivu Montagneux : overpopulation, undernutrition, soil erosion. Mem. Acad. Royale Sc.Outremer Belgique, tome 21,fasc.n° 3.
WELZER, H. (2012) Climate Wars: what people will be killed for in the 21st century. Wiley. ISBN: 978-0-7456-5145-3
The Encyclopedia of the Environment by the Association des Encyclopédies de l'Environnement et de l'Énergie (www.a3e.fr), contractually linked to the University of Grenoble Alpes and Grenoble INP, and sponsored by the French Academy of Sciences.
To cite this article: DE MARSILY Ghislain (February 7, 2019), Are we at risk of water shortage?, Encyclopedia of the Environment, Accessed April 20, 2024 [online ISSN 2555-0950] url : https://www.encyclopedie-environnement.org/en/water/are-we-at-risk-of-water-shortage/.
The articles in the Encyclopedia of the Environment are made available under the terms of the Creative Commons BY-NC-SA license, which authorizes reproduction subject to: citing the source, not making commercial use of them, sharing identical initial conditions, reproducing at each reuse or distribution the mention of this Creative Commons BY-NC-SA license.