Meteorological observations over the past centuries

PDF
observation meteorologique annees 1950 - meteo 1950 - meteorological observations

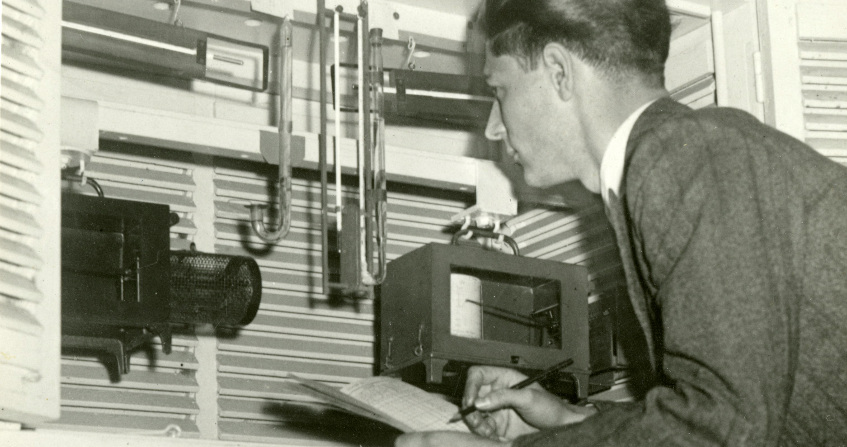
Meteorology has been a constant concern of humankind. The first writings are rich in meteorological descriptions, such as that of the Flood, the most shared myth of all civilizations. In Europe, in the Middle Ages, chroniclers recorded weather events directly (storms, cold, etc.) or indirectly via the date of the grape harvest, for example. However, it was not until the end of the 16th century that the first measuring instruments essential for the scientific description of the state of the atmosphere were developed. The concept of an observation network appeared in the 17th century. The objective is to characterize the earth’s climates on a quantified basis. As early as 1860, the development of the telegraph and, more generally, of transmissions made it possible to consider using meteorological observations to predict the weather. Upper-air weather observations begin in the early 20th century. Their interest increases with progress in forecasting. Since 1960, observations have also been made from satellites. Today, weather observations are archived and stored in databases for use in numerical weather prediction or climate change models.

1. Observations before measurements

1.1. The first writings

Figure 1. Rainbow and end of the flood, Palermo Palatine Chapel. [Source : © By Jean-Pierre Dalbéra from Paris, France, CC BY 2.0 (https://creativecommons.org/licenses/by/2.0), via Wikimedia Commons]
All texts relating very ancient episodes of human history mention weather events. The most famous of them is probably the Flood. The Mahâbhârata speaks of the shock of a comet that ignites the horizon before a torrential rain of twelve years. In the Bible, the rainbow marks the end of the rains after the Flood and the new covenant between God and men (see Figure 1).

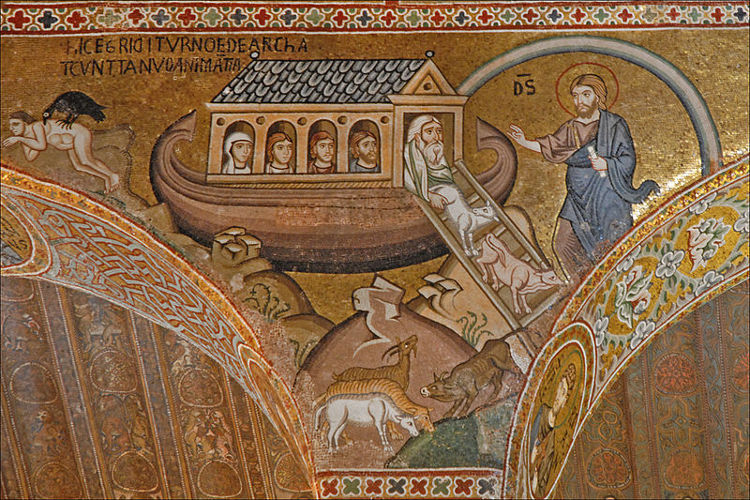
The Chinese have the longest series of weather observations. As early as 1216 BC, there is a trace of text recording meteorological events every ten days. The wind direction is even specified. The Chaldean or Babylonian magicians left descriptions of celestial phenomena on clay tablets. The Greeks, for their part, thought of meteorology as a science and, around 334 BC, Aristotle wrote the first meteorological treatise linking meteorological observations to a physical reality and not to divine action [1].

1.2 In Europe, in the Middle Ages and up to the 17th century

Figure 2. The harvest dates used to know the climate of the past – Manuscript 39, Psalter, 13th century. [© Bibliothèque municipale de Beaune]
The historian Emmanuel Le Roy Ladurie has used the chronicles left by medieval scholars to put into perspective the history of mankind and the climatic disasters they suffer. He used weather observations qualified as direct and secondary sources, such as grape harvest dates (Figure 2), harvest dates and production quantity and quality, significant, at least for this period, in the weather [2]. Other historians also use complementary indicators such as, for example, reports of trials for time modification [3].

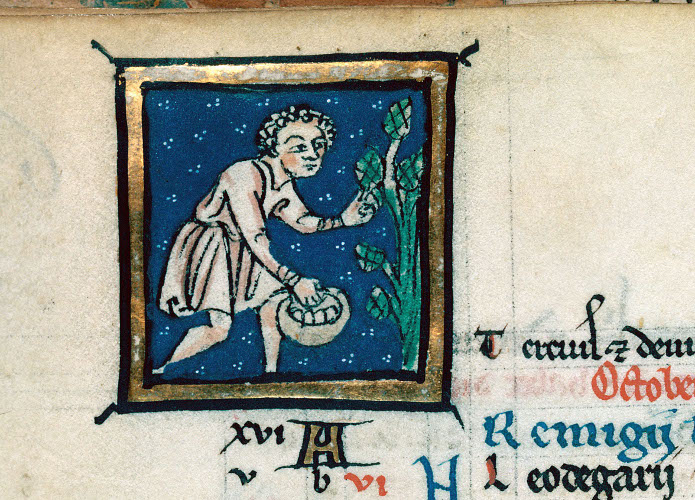
Popular sayings that predict the weather, some of which date back to that time, also testify to man’s ability to observe the sky and to seek to predict its evolution.

2. Observation instruments

Although there is evidence of meteorological instruments long before, most of the instruments needed to measure atmospheric conditions were not developed until the 16th century.

2.1. The barometer

toricelli experience du vide
Figure 3. Torricelli and the experience of the vacuum in 1643. [© D’ALENCE J. (1688) Traité des baromètres, thermomètres et notiomètres, Amsterdam]
Torricelli (1608-1647) lays down the principle of the first barometer, proving, in 1644, the existence of atmospheric pressure through a tube filled with mercury (Figure 3). Pascal (1623-1662) shows, in 1648, that the atmospheric pressure measured with Torricelli’s tubes decreases as the altitude increases. In 1663, he developed a siphon barometer [4]. The name barometer was first used in 1665 by the English scientist Robert Boyle (1627-1691) [5]. Since then, the barometer has undergone many changes. One of the most important is that of Lucien Vidie (1805-1866). It provided the scientific expeditions of the 19th century with a portable, mercury-free instrument: the aneroid barometer. It includes a deformable metal box (or Vidie capsule) in which a partial vacuum is made. Its compression is limited by springs whose tension is a function of pressure. The Vidie capsule continues to be the sensitive element of many of today’s barometers.

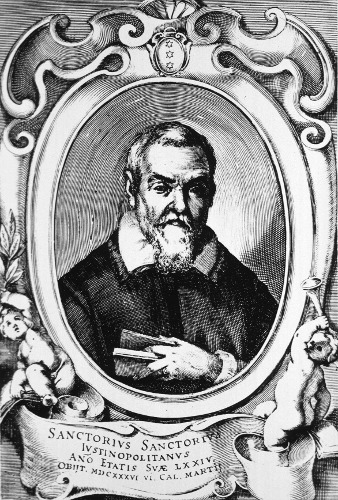
2.2. The thermometer

 thermoscope de Telioux
Figure 4: Reproduction of the Telioux thermoscope manufactured in 1995 in Trappes. [© Météo-France]
Even if we know that Greek physicists of antiquity, such as Philo of Byzantium or Hero of Alexandria, measured variations in air temperature, several 17th century scientists claim responsibility for them. Barlomeo Telioux described in 1611 the principle of a thermoscope, which makes it possible to estimate variations in air pressure and temperature by measuring the height of a water column (Figure 4).

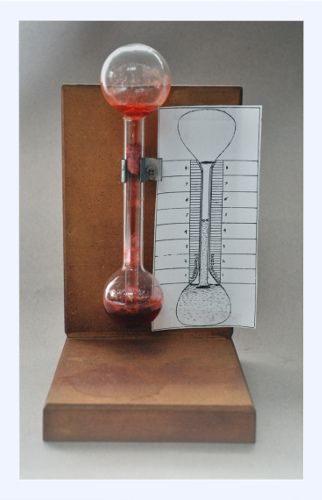
The Italian doctor, Santorio Santorio (1561-1636) used a thermoscope in 1612 to assess a patient’s fever [6]. The Dutchman Cornelis Drebbel describes, in 1621, a thermometer with a basic functioning: a glass balloon, equipped with a long tapered neck that plunges into a container filled with water. The water rises in the tube. When the patient places his hand on the ball; the heat released expands the air in the sphere and lowers the water level to a certain height. Temperature variations can be monitored by repeating the experiment at regular intervals and measuring this height each time [7].

medecin santorio
Figure 5. The Italian doctor Santorio, who created several meteorological instruments. [By Giacomo Puccini (Public domain), via Wikimedia Commons]
In 1641 in Florence, under the aegis of the Grand Duke of Tuscany Ferdinand II, the Santorio thermoscope was perfected to free itself from the effects of atmospheric pressure: water was trapped in a hermetic tube. The German David Fahrenheit (1686-1736) improved its reliability by introducing mercury into the closed tube and establishing a scale of variations. The Swede Anders Celsius (1701-1744) proposes a scale where zero corresponds to the boiling of water and 100 to the melting temperature of ice. Once reversed, this scale gradually becomes the reference. In 1954, the Kelvin became the international unit for measuring temperature. To switch from Celsius to Kelvin, you have to add 273.15. However, the World Meteorological Organization (WMO) continues to use Celsius for some messages.

2.3. The hygrometer

Leonardo da Vinci’s Atlanticus codex gathers scientific and technical drawings made between 1478 and 1518. Among them, the weighing device, one of the trays of which carries a sponge and the other a stone, makes it possible to measure the variation in the humidity of the air, since the weight of the sponge varies according to the degree of ambient humidity while, on the other hand, the weight of the stone remains stable. It is one of the ancestors of hygrometers used in meteorology.
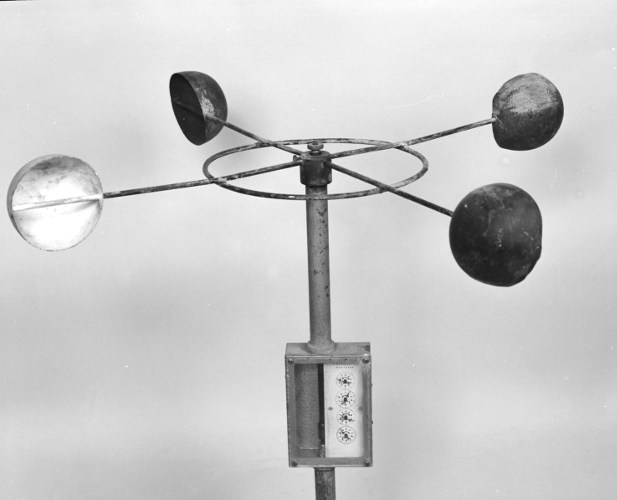
hygro-transmetteur à cheveux
Figure 6. Hygro-transmitter with hair. [© Météo-France]
The Italian Santorio (Figure 5), already mentioned for the thermometer, identifies several possible methods. Several scientists of the 17th and 18th centuries offered instruments to measure air humidity, but it was the Swiss Horace Benedict de Saussure (1740-1799) who developed the hair hygrometer (Figure 6), a simple, cheap, portable instrument that had long been used in weather networks [8].

2.4. The anemometer

anemometre robinson compteurs
Figure 7. Robinson anemometer with counters. [© Météo-France]
If observing wind direction has been common since ancient times, it was not until 1450 that Leone Battista Alberti (1414-1472) proposed an improved weather vane that estimated wind strength based on the angle made by a plate moving about a horizontal axis. In 1664, the Englishman Robert Hooke (1635-1703) developed an anemometer capable of measuring both wind direction and strength. In 1806, the English admiral Sir Francis Beaufort (1774-1857) introduced a very simple numerical scale, based on the observation of the sail of a three-masted frigate [9]. It was not until 1846, with the invention of the cup anemometer (Figure 7) by Thomas Romney Robinson (1792-1882), that wind force measurements can be considered relatively reliable, although it is important to know how they were carried out, as wind is an extremely variable parameter in time and space.

3. Observation networks

ferdinand II
Figure 8. Ferdinand II created the first network of meteorological observations. [Source : Attributed to Giusto Sustermans (Public domain), via Wikimedia Commons]
The development of measurement instruments allows scientists at the time to compare their measurements in order to characterize the climates of the regions where they are made. Ferdinand II (Figure 8), Grand Duke of Tuscany, provided with barometer and thermometer, eleven cities (Florence, Pisa, Vallombrosa, Curtigliano, Bologna, Milan, Parma, Oaris, Osnabrück, Innsbruck, Warsaw) and collected their observations for ten years under the auspices of the Academia del Cimento. The hostility of the Catholic Church put an end to this first meteorological network in 1667 [10].

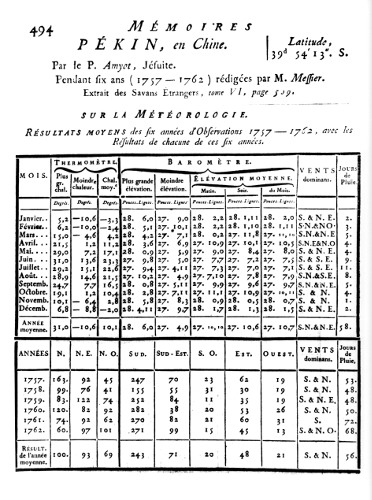
In 1776, in France, the Royal Society of Medicine created a network of meteorological observations to study the link between ambient weather conditions and diseases. Louis Cotte (1740-1815), an Oratorian priest, organized its operation: he listed the instruments to be used, set their installation and maintenance conditions, provided the forms to be completed and organized their collection and archiving. In 1784, the network included seventy-six observatories from all over the world. The Palatinate Meteorological Society in Mannheim, for its part, selected 57 institutions with which it exchanged meteorological observations from 1780 onwards. The French revolution put an end to the functioning of these networks in 1792 but the records collected by Cotte [11] (Figure 9) and by the Palatinate Society [12] have been preserved.

observations de Pekin meteo
Figure 9. Observations from Beijing (1757-1762) collected by Louis Cotte. [© Météo-France]
The measures were nevertheless continued by enthusiasts, particularly farmers and doctors. In France, it was not until 1848 that the first Annuaire météorologique de la France was published, which brought together voluntary meteorological observations. Charles Sainte-Claire Deville (1814-1876) and Emilien Renou (1815-1902) took up the idea and founded the Société météorologique de France (SMF) in 1852, which took over the publication of the yearbook.

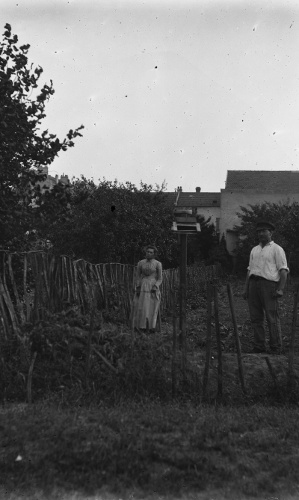
The creation of professional meteorological services provides the different networks with the necessary coherence for the operational use of observations. In France, in 1864, Urbain Le Verrier (1811-1877) used the network of primary teacher training colleges to provide meteorological observation in France. Departmental meteorological commissions were created in 1865. In 1914, they managed a network of more than 2000 volunteer observers (Figure 10).

Figure 10. Rainfall observation in Noisy le Sec in 1897. [© Météo-France]
In Germany, at the Prussian Meteorological Institute created in 1847, climatologist Wilhem Mahlmann (1812-1848) defines the notion of local climate and organizes the observation network. At the Brussels Observatory created in 1833, meteorological records are daily and Adolphe Quetelet (1796-1874) uses them statistically in an attempt to identify physical laws on the evolution of time. The Royal Meteorological Society of London, created in 1850, federates the English observations already available since, as early as 1848, the British newspaper Daily News published a table of the weather observed in different cities. As early as 1853, Admiral Robert Fitzroy proposed prediction rules based on observations collected at sea, but it was the American Matthew Fontaine Maury who in 1853 obtained the standardization of maritime observations so that they could be used by everyone.

James Pollard Espy (1785-1860) obtained from the American Congress that each county be equipped with a meteorological station including a barometer, thermometers and a rain gauge. These observations enabled him to draw up synoptic maps as early as 1841. However, the Weather Bureau was not created until February 9, 1870.

C.-H. Buys-Ballot - premier président de l’Organisation Météorologique internationale
Figure 11. C.-H. Buys-Ballot, first president of the International Meteorological Organization. [© Météo-France]
The International Meteorological Organization was founded in Vienna in 1873. Its president is the Englishman Charles-Henri Buys Ballot (1817-1890) (Figure 11). Its main objective is the exchange of meteorological observations and is therefore focused on standardizing them and defining their coding.

4. Transmission of observation data

In 1851, on the occasion of the London World Fair, the telegraph company displayed a map on which the state of time, wind pressure and direction were displayed at twenty-two points as they were received.

The possibility of quickly exchanging meteorological observations, with telegraph or radio, gives these networks an increased importance because the analysis of observations received a few hours after they have been made makes it possible to predict the weather and no longer only to study the climate.

statue Urbain Le Verrier
Figure 12. Statue of Urbain Le Verrier by Henri Chapu in front of the Paris Observatory. [© P. Taburet, Météo-France]
In France, in 1855, U. Le Verrier (Figure 12) demonstrated to Napoleon III that the existence of a telegraphic meteorological network would have allowed him to avoid the Sevastopol disaster.

The storm that caused the loss of a large part of the French fleet on November 14, 1854, was indeed predictable, if the appropriate observation network had been available.

The decision to create an international meteorological service with telegraphic transmission of observations was taken in 1856.

On 2 November 1857, a table of meteorological observations was published in the International Bulletin of Paris Observatory.

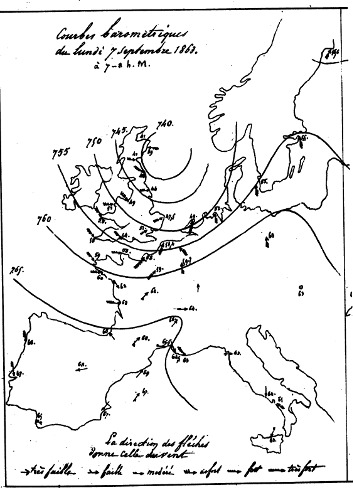
On September 7, 1863, the first isobaric map of the situation of the previous day in Europe was presented (Figure 13).

Wilhem Brandes (1777-1834) had led the way by illustrating

premiere carte isobarique 1863
Figure 13. The first isobaric map published in France in 1863. [© Météo-France]
four maps his 1826 thesis on the route of the strong depression from England to Norway between 24 and 26 December 1821 [13].

5. Upper air observations

5.1. The balloons probe

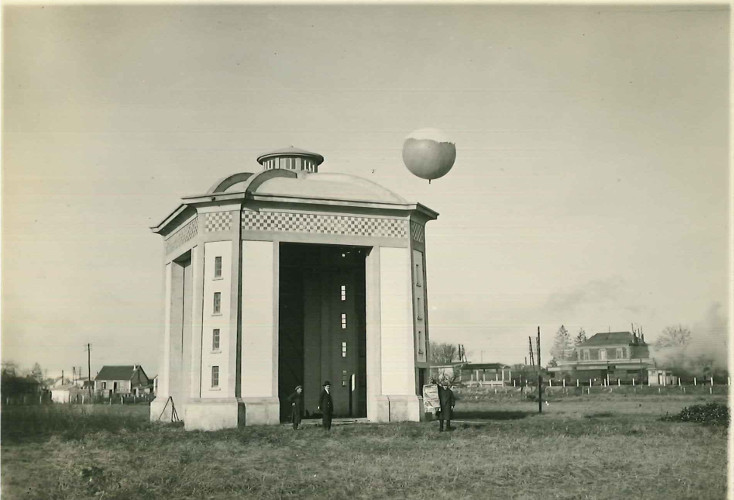
In 1898, Léon Teisserenc De Bort (1855-1913) began vertical exploration of the atmosphere using kites and then balloons. In 1899, he highlighted the existence of the stratosphere. But it was with the First World War that the major interest of these observations was recognized and a network of sounding stations was set up.

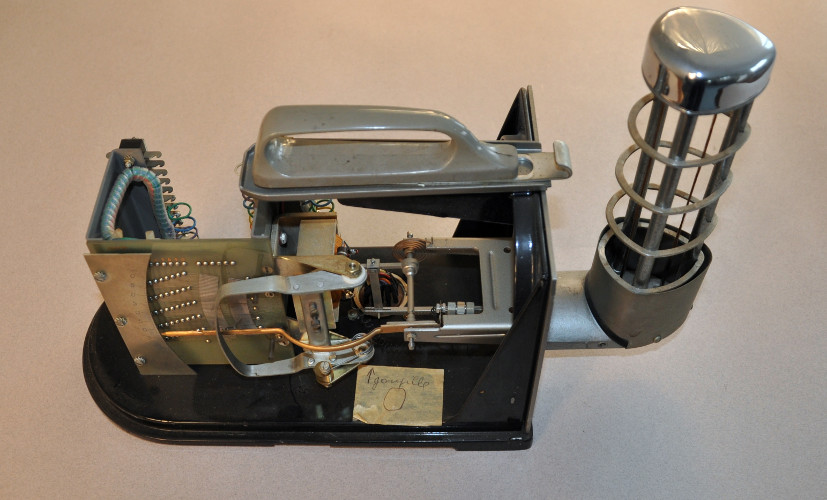
In 1927, Robert Bureau (1892-1965) and Pierre Idrac (1885-1935) developed the radiosonde, which made it possible to receive on the ground, by radio, the measurements of the instruments carried by the balloon (Figure 14).
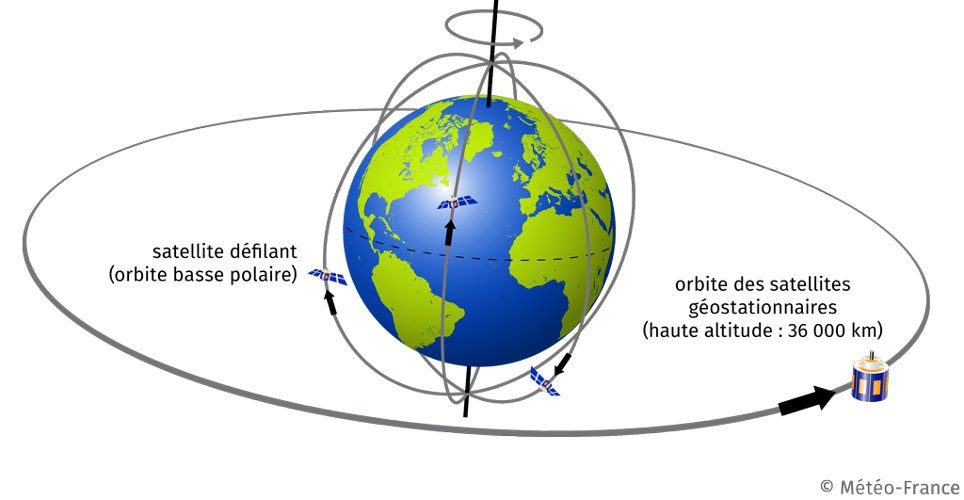
ballon-sondes meteo - premiers radiosondages
Figure 14. First radiosondes in Trappes around 1930. [© Météo-France]. Extract from the ONM report and correspondence 1925-1953/Observatoire de Trappes
These observations are, until the arrival of satellite data, the main observations assimilated in numerical forecast models.

5.2. The satellites

satellites - observation meteo satellite
Figure 15. Earth weather observation by satellites. [© Météo-France]
The first meteorological satellite, TIROS-1, was launched on April 1, 1960. In 1966, the geostationary satellite ATS1 provided spectacular images of the Earth and cloud formations in the atmosphere. The decision to provide meteorological coverage of the planet is made. The first geostationary satellite, American, was launched in 1974. The European satellite, Meteosat, was launched in 1977. Scrolling satellites complete the device (Figure 15).

5.3. Radar observations

Melodi Dammartin
Figure 16. One of the first French precipitation radars, the Melodi, in Dammartin, in 1974. [© Météo-France]
In 1889, Heinrich Hertz (1857-1894) laid down the principles of detecting metal surfaces by electromagnetic waves. During the Second World War, while operators routinely used radars to detect aircraft, the existence of echoes linked to precipitation was highlighted. The link between the reflectivity measured by the radar and the intensity of precipitation (Z-R law) is established. The first precipitation detection radar, the WSR-57, is developed by the US Meteorological Service. In France, the Aramis network that provides radar meteorological coverage for France was created in the 1980s [14], after the installation of pilot radars, such as the Melodi radar in Dammartin (Figure 16).

6. Use in weather prediction and climate change models

6.1. Numerical prediction models

ENIAC
Figure 17. ENIAC is the computer on which the first numerical weather forecast was made in 1950. See page for author (Public domain), via Wikimedia Commons. [© U. S. Army]
Lewis Fry Richardson (1881-1953) established, in 1922, how from a set of meteorological observations, it is possible to calculate its evolution [15]. In 1938 Carl-Gustav Rossby (1898-1957) proposed simpler equations to calculate the displacement of disturbances at temperate latitudes. In August 1946, John von Neuman (1903-1957) organized the first conference on “Dynamic Meteorology and High-Speed Automatic Electronic Computing” in Princeton. Jule Charney (1917-1981) designed the first model and tested it in March 1950 in Aberdeen, on the ENIAC (Figure 17), one of the first electronic computers. Even if it takes five weeks to make three conclusive forecasts, the numerical forecast is launched [16].

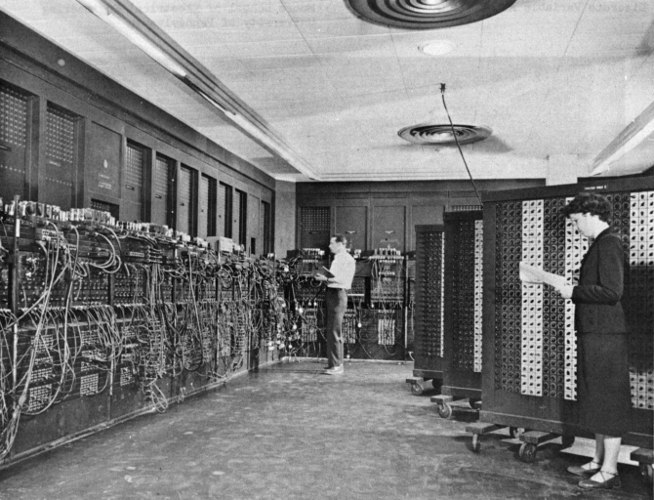
The first set of 24-hour forecasts was published in 1954 by the Weather Bureau. It is based on a human analysis of meteorological observations. In France, it was not until the 1970s and the development of the Amethyst forecast model that numerical prediction, with radiosonde observations as input data, became operational [17]. The forecasts are limited to metropolitan France with a three-hour time horizon [18].

6.2. Climate models

projet date rescue
Figure 18. The Data Rescue project for meteorological observations. [© Météo-France]
Unlike forecasting models, climate models are not permanently fed by meteorological observations. These are used to define an initial state of the atmosphere, then the model calculates its evolution, according to the defined rules and assumptions such as, for example, the greenhouse gas content over a 100-year period [19]. Observations are also used to verify the model’s ability to reconstruct past climate in order to conclude on its relevance in simulating future climate. The observations used are homogenized meteorological observations to take into account the variability of the conditions under which they were made. The World Meteorological Organization (WMO) has launched a vast programme to recover meteorological records (Data Rescue) in order to make observations available to researchers (Figure 18) in order to reconstruct the Earth’s recent past climates [20].

7. Messages to remember

  • The arrival of meteorological instruments in the 16th century provided the measurements.
  • The establishment of meteorological networks that standardize measurements makes it possible to transform measurements into climatological observations and to compare the Earth’s climates.
  • The arrival of the telegraph, which allowed for rapid exchanges of observations, made it possible in the second half of the 19th century to consider forecasting the weather.
  • The development of aviation and the resources given to meteorology during the two great wars of the 20th century allowed major advances in the knowledge of the functioning of the atmosphere.
  • The development of computing facilities and satellites in the 1970s marked a decisive turning point in the field of meteorological observation and its use to predict the weather and study climate change.


References and notes

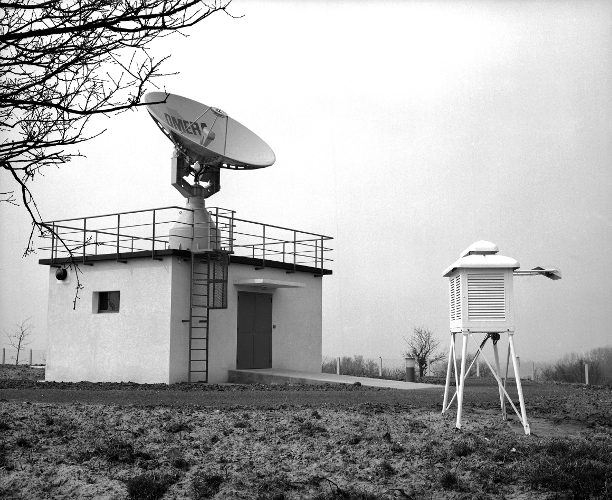
Cover image. Meteorological observation in the 1950s. [Source: © Météo-France]

[1] FIERRO A. (1991). History of meteorology. Paris: Denoël

[2] THE ROY LADURIE E. (1967) History of climate since the year 1000. Paris: Flammarion

[3] LITZENBURGER L. (2015), A City Facing Climate: Metz at the End of the Middle Ages, Nancy: PUN

[4] PASCAL B. (1663) Treatises on the balance of liquors, and the gravity of air mass…Paris: Guillaume Desprez

[5] JAVELLE JP, ROCHAS M., PASTRE C., HONTARREDE M., BEAUREPAIRE M., JACOMY B. (2000), Du baromètre au satellite, Paris : Delachaux & Nestlé

[6] JAVELLE JP, ROCHAS M., PASTRE C., HONTARREDE M., BEAUREPAIRE M., JACOMY B. (2000), Du baromètre au satellite, Paris : Delachaux & Nestlé

[7] RENOW E. (1876), Histoire du thermomètre, Annuaire de la Société météorologique de France, n°24, http://bibliotheque.meteo.fr/exl-php/oaidoc/DOC00028778.html

[8] AVELLE JP, ROCHAS M., PASTRE C., HONTARREDE M., BEAUREPAIRE M., JACOMY B. (2000), Du baromètre au satellite, Paris : Delachaux & Nestlé

[9] JAVELLE JP, ROCHAS M., PASTRE C., HONTARREDE M., BEAUREPAIRE M., JACOMY B. (2000), Du baromètre au satellite, Paris : Delachaux & Nestlé

[10] FIERRO A. (1991). History of Meteorology, Paris: Denoël

[11] COTTE L (1774), Traité de météorologie, Paris: Imprimerie Royale http://gallica.bnf.fr/ark:/12148/bpt6k94863w

[12] SOCIETAS METEOROLOGICA PALATINA (1781-1786), Ephemerides Societatis meteorologicae palatinae, Manheim : Schwan, http://bibliotheque.meteo.fr/exl-php/vue-consult/mf_-_research_advance/ISO0000008104

[13] PARROCHIA D. (1998), Météores – Essay on the sky and the city, Paris:ChampVallon

[14] PARENT OF CHATELET J. (2003), Aramis, the French radar network for precipitation monitoring, La Météorologie, n°40, http://documents.irevues.inist.fr/handle/2042/36263

(1922), Weather prediction by natural process, Cambridge University Press, https://archive.org/details/weatherpredictio00richrich

[15] RICHARDSON LF. (1922),  Weather prediction by natural process, Cambridge University Press, https://archive.org/details/weatherpredictio00richrich

[16] ROCHAS M., JAVELLE .-P. (1993), La météorologie : la prévision numérique du temps et du climat, Aubenas : Syros

[17] PAILLEUX J., (2002), Les besoins en observations pour la prévision numérique du temps, La Météorologie, n°39, p29-35, http://documents.irevues.inist.fr/bitstream/handle/2042/36244/meteo_2002_39_29.pdf?sequence=1&isAllowed=y

[18] ROUSSEAU D., LE PHAM H, JUVANON DU VACHAT R. (1995), Vingt-cinq ans de prévision numérique du temps, La Météorologie, n°spécial, p129-134. http://documents.irevues.inist.fr/bitstream/handle/2042/52038/meteo_1995_SP_129.pdf

[19] ,PLANTON S., DUFRESNE J.-L. (2007), Description of a generic organizational chart, Le climat à découvert, p150-153, https:https://books.openedition.org/editionscnrs/11431?lang=en

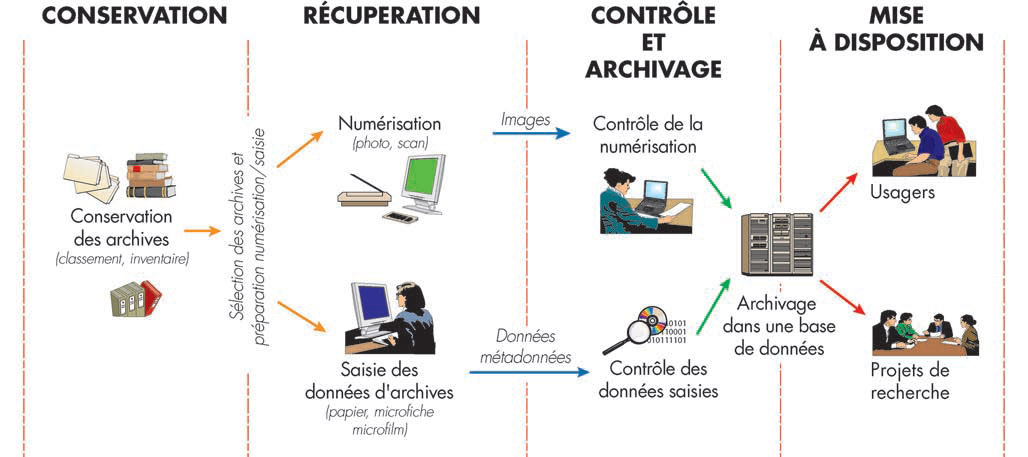
[20] JOURDAIN S., ROUCAUTE E., DANDIN P., JAVELLE JP, DONET I., MENASSERE S., CENAC N., (2015), Le sauvetage de données climatologiques, La Météorologie, N°89, p47-55


The Encyclopedia of the Environment by the Association des Encyclopédies de l'Environnement et de l'Énergie (www.a3e.fr), contractually linked to the University of Grenoble Alpes and Grenoble INP, and sponsored by the French Academy of Sciences.

To cite this article: PEPIN Marie-Hélène (March 5, 2019), Meteorological observations over the past centuries, Encyclopedia of the Environment, Accessed April 23, 2024 [online ISSN 2555-0950] url : https://www.encyclopedie-environnement.org/en/air-en/meteorological-observations-over-past-centuries/.

The articles in the Encyclopedia of the Environment are made available under the terms of the Creative Commons BY-NC-SA license, which authorizes reproduction subject to: citing the source, not making commercial use of them, sharing identical initial conditions, reproducing at each reuse or distribution the mention of this Creative Commons BY-NC-SA license.