Meteorological observations over the past centuries

PDF
observation meteorologique annees 1950 - meteo 1950 - meteorological observations

Meteorology has been a constant concern of humankind. The first writings are rich in meteorological descriptions, such as that of the Flood, the most shared myth of all civilizations. In Europe, in the Middle Ages, chroniclers recorded weather events directly (storms, cold, etc.) or indirectly via the date of the grape harvest, for example. However, it was not until the end of the 16th century that the first measuring instruments essential for the scientific description of the state of the atmosphere were developed. The concept of an observation network appeared in the 17th century. The objective is to characterize the earth’s climates on a quantified basis. As early as 1860, the development of the telegraph and, more generally, of transmissions made it possible to consider using meteorological observations to predict the weather. Upper-air weather observations begin in the early 20th century. Their interest increases with progress in forecasting. Since 1960, observations have also been made from satellites. Today, weather observations are archived and stored in databases for use in numerical weather prediction or climate change models.

1. Observations before measurements

1.1. The first writings

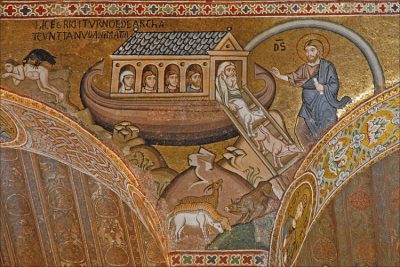
Figure 1. Rainbow and end of the flood, Palermo Palatine Chapel. [Source : © By Jean-Pierre Dalbéra from Paris, France, CC BY 2.0 (https://creativecommons.org/licenses/by/2.0), via Wikimedia Commons]
All texts relating very ancient episodes of human history mention weather events. The most famous of them is probably the Flood. The Mahâbhârata speaks of the shock of a comet that ignites the horizon before a torrential rain of twelve years. In the Bible, the rainbow marks the end of the rains after the Flood and the new covenant between God and men (see Figure 1).

The Chinese have the longest series of weather observations. As early as 1216 BC, there is a trace of text recording meteorological events every ten days. The wind direction is even specified. The Chaldean or Babylonian magicians left descriptions of celestial phenomena on clay tablets. The Greeks, for their part, thought of meteorology as a science and, around 334 BC, Aristotle wrote the first meteorological treatise linking meteorological observations to a physical reality and not to divine action [1].

1.2 In Europe, in the Middle Ages and up to the 17th century

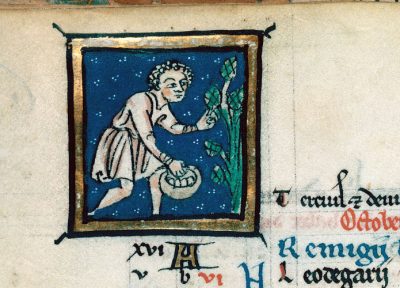
Figure 2. The harvest dates used to know the climate of the past – Manuscript 39, Psalter, 13th century. [© Bibliothèque municipale de Beaune]
The historian Emmanuel Le Roy Ladurie has used the chronicles left by medieval scholars to put into perspective the history of mankind and the climatic disasters they suffer. He used weather observations qualified as direct and secondary sources, such as grape harvest dates (Figure 2), harvest dates and production quantity and quality, significant, at least for this period, in the weather [2]. Other historians also use complementary indicators such as, for example, reports of trials for time modification [3].

Popular sayings that predict the weather, some of which date back to that time, also testify to man’s ability to observe the sky and to seek to predict its evolution.

2. Observation instruments

Although there is evidence of meteorological instruments long before, most of the instruments needed to measure atmospheric conditions were not developed until the 16th century.

2.1. The barometer

toricelli experience du vide
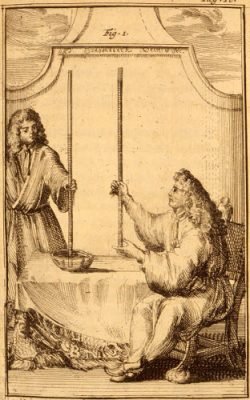
Figure 3. Torricelli and the experience of the vacuum in 1643. [© D’ALENCE J. (1688) Traité des baromètres, thermomètres et notiomètres, Amsterdam]
Torricelli (1608-1647) lays down the principle of the first barometer, proving, in 1644, the existence of atmospheric pressure through a tube filled with mercury (Figure 3). Pascal (1623-1662) shows, in 1648, that the atmospheric pressure measured with Torricelli’s tubes decreases as the altitude increases. In 1663, he developed a siphon barometer [4]. The name barometer was first used in 1665 by the English scientist Robert Boyle (1627-1691) [5]. Since then, the barometer has undergone many changes. One of the most important is that of Lucien Vidie (1805-1866). It provided the scientific expeditions of the 19th century with a portable, mercury-free instrument: the aneroid barometer. It includes a deformable metal box (or Vidie capsule) in which a partial vacuum is made. Its compression is limited by springs whose tension is a function of pressure. The Vidie capsule continues to be the sensitive element of many of today’s barometers.

2.2. The thermometer

 thermoscope de Telioux
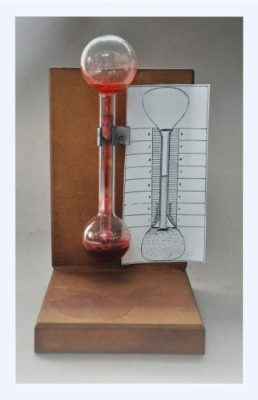
Figure 4: Reproduction of the Telioux thermoscope manufactured in 1995 in Trappes. [© Météo-France]
Even if we know that Greek physicists of antiquity, such as Philo of Byzantium or Hero of Alexandria, measured variations in air temperature, several 17th century scientists claim responsibility for them. Barlomeo Telioux described in 1611 the principle of a thermoscope, which makes it possible to estimate variations in air pressure and temperature by measuring the height of a water column (Figure 4).

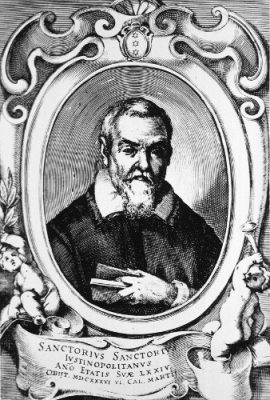
The Italian doctor, Santorio Santorio (1561-1636) used a thermoscope in 1612 to assess a patient’s fever [6]. The Dutchman Cornelis Drebbel describes, in 1621, a thermometer with a basic functioning: a glass balloon, equipped with a long tapered neck that plunges into a container filled with water. The water rises in the tube. When the patient places his hand on the ball; the heat released expands the air in the sphere and lowers the water level to a certain height. Temperature variations can be monitored by repeating the experiment at regular intervals and measuring this height each time [7].

medecin santorio
Figure 5. The Italian doctor Santorio, who created several meteorological instruments. [By Giacomo Puccini (Public domain), via Wikimedia Commons]
In 1641 in Florence, under the aegis of the Grand Duke of Tuscany Ferdinand II, the Santorio thermoscope was perfected to free itself from the effects of atmospheric pressure: water was trapped in a hermetic tube. The German David Fahrenheit (1686-1736) improved its reliability by introducing mercury into the closed tube and establishing a scale of variations. The Swede Anders Celsius (1701-1744) proposes a scale where zero corresponds to the boiling of water and 100 to the melting temperature of ice. Once reversed, this scale gradually becomes the reference. In 1954, the Kelvin became the international unit for measuring temperature. To switch from Celsius to Kelvin, you have to add 273.15. However, the World Meteorological Organization (WMO) continues to use Celsius for some messages.

2.3. The hygrometer

Leonardo da Vinci’s Atlanticus codex gathers scientific and technical drawings made between 1478 and 1518. Among them, the weighing device, one of the trays of which carries a sponge and the other a stone, makes it possible to measure the variation in the humidity of the air, since the weight of the sponge varies according to the degree of ambient humidity while, on the other hand, the weight of the stone remains stable. It is one of the ancestors of hygrometers used in meteorology.

hygro-transmetteur à cheveux
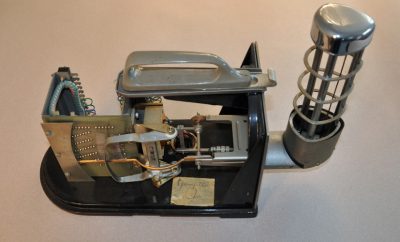
Figure 6. Hygro-transmitter with hair. [© Météo-France]
The Italian Santorio (Figure 5), already mentioned for the thermometer, identifies several possible methods. Several scientists of the 17th and 18th centuries offered instruments to measure air humidity, but it was the Swiss Horace Benedict de Saussure (1740-1799) who developed the hair hygrometer (Figure 6), a simple, cheap, portable instrument that had long been used in weather networks [8].

2.4. The anemometer

anemometre robinson compteurs
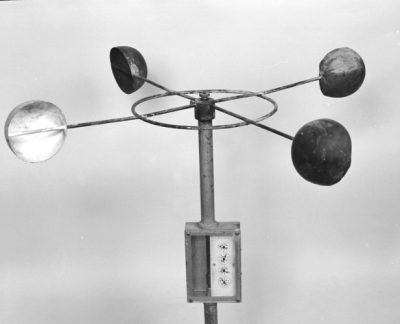
Figure 7. Robinson anemometer with counters. [© Météo-France]
If observing wind direction has been common since ancient times, it was not until 1450 that Leone Battista Alberti (1414-1472) proposed an improved weather vane that estimated wind strength based on the angle made by a plate moving about a horizontal axis. In 1664, the Englishman Robert Hooke (1635-1703) developed an anemometer capable of measuring both wind direction and strength. In 1806, the English admiral Sir Francis Beaufort (1774-1857) introduced a very simple numerical scale, based on the observation of the sail of a three-masted frigate [9]. It was not until 1846, with the invention of the cup anemometer (Figure 7) by Thomas Romney Robinson (1792-1882), that wind force measurements can be considered relatively reliable, although it is important to know how they were carried out, as wind is an extremely variable parameter in time and space.

3. Observation networks

ferdinand II
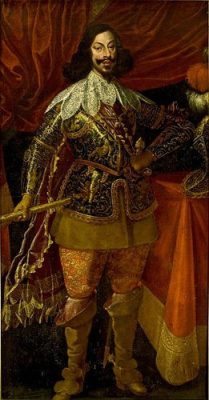
Figure 8. Ferdinand II created the first network of meteorological observations. [Source : Attributed to Giusto Sustermans (Public domain), via Wikimedia Commons]
The development of measurement instruments allows scientists at the time to compare their measurements in order to characterize the climates of the regions where they are made. Ferdinand II (Figure 8), Grand Duke of Tuscany, provided with barometer and thermometer, eleven cities (Florence, Pisa, Vallombrosa, Curtigliano, Bologna, Milan, Parma, Oaris, Osnabrück, Innsbruck, Warsaw) and collected their observations for ten years under the auspices of the Academia del Cimento. The hostility of the Catholic Church put an end to this first meteorological network in 1667 [10].

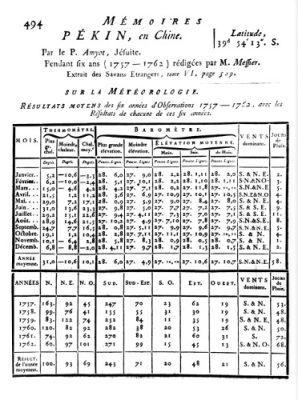
In 1776, in France, the Royal Society of Medicine created a network of meteorological observations to study the link between ambient weather conditions and diseases. Louis Cotte (1740-1815), an Oratorian priest, organized its operation: he listed the instruments to be used, set their installation and maintenance conditions, provided the forms to be completed and organized their collection and archiving. In 1784, the network included seventy-six observatories from all over the world. The Palatinate Meteorological Society in Mannheim, for its part, selected 57 institutions with which it exchanged meteorological observations from 1780 onwards. The French revolution put an end to the functioning of these networks in 1792 but the records collected by Cotte [11] (Figure 9) and by the Palatinate Society [12] have been preserved.

observations de Pekin meteo
Figure 9. Observations from Beijing (1757-1762) collected by Louis Cotte. [© Météo-France]
The measures were nevertheless continued by enthusiasts, particularly farmers and doctors. In France, it was not until 1848 that the first Annuaire météorologique de la France was published, which brought together voluntary meteorological observations. Charles Sainte-Claire Deville (1814-1876) and Emilien Renou (1815-1902) took up the idea and founded the Société météorologique de France (SMF) in 1852, which took over the publication of the yearbook.

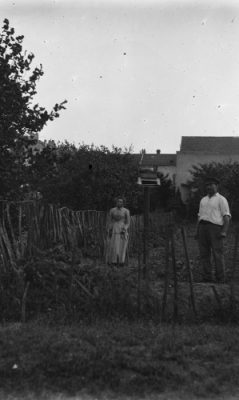
The creation of professional meteorological services provides the different networks with the necessary coherence for the operational use of observations. In France, in 1864, Urbain Le Verrier (1811-1877) used the network of primary teacher training colleges to provide meteorological observation in France. Departmental meteorological commissions were created in 1865. In 1914, they managed a network of more than 2000 volunteer observers (Figure 10).

Figure 10. Rainfall observation in Noisy le Sec in 1897. [© Météo-France]
In Germany, at the Prussian Meteorological Institute created in 1847, climatologist Wilhem Mahlmann (1812-1848) defines the notion of local climate and organizes the observation network. At the Brussels Observatory created in 1833, meteorological records are daily and Adolphe Quetelet (1796-1874) uses them statistically in an attempt to identify physical laws on the evolution of time. The Royal Meteorological Society of London, created in 1850, federates the English observations already available since, as early as 1848, the British newspaper Daily News published a table of the weather observed in different cities. As early as 1853, Admiral Robert Fitzroy proposed prediction rules based on observations collected at sea, but it was the American Matthew Fontaine Maury who in 1853 obtained the standardization of maritime observations so that they could be used by everyone.

James Pollard Espy (1785-1860) obtained from the American Congress that each county be equipped with a meteorological station including a barometer, thermometers and a rain gauge. These observations enabled him to draw up synoptic maps as early as 1841. However, the Weather Bureau was not created until February 9, 1870.

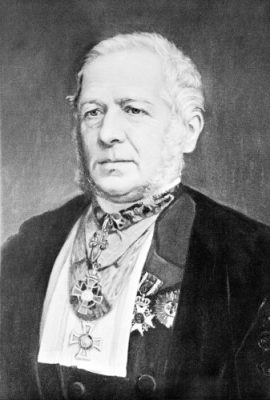
C.-H. Buys-Ballot - premier président de l’Organisation Météorologique internationale
Figure 11. C.-H. Buys-Ballot, first president of the International Meteorological Organization. [© Météo-France]
The International Meteorological Organization was founded in Vienna in 1873. Its president is the Englishman Charles-Henri Buys Ballot (1817-1890) (Figure 11). Its main objective is the exchange of meteorological observations and is therefore focused on standardizing them and defining their coding.

4. Transmission of observation data

In 1851, on the occasion of the London World Fair, the telegraph company displayed a map on which the state of time, wind pressure and direction were displayed at twenty-two points as they were received.

The possibility of quickly exchanging meteorological observations, with telegraph or radio, gives these networks an increased importance because the analysis of observations received a few hours after they have been made makes it possible to predict the weather and no longer only to study the climate.

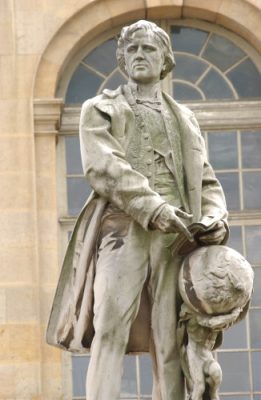
statue Urbain Le Verrier
Figure 12. Statue of Urbain Le Verrier by Henri Chapu in front of the Paris Observatory. [© P. Taburet, Météo-France]
In France, in 1855, U. Le Verrier (Figure 12) demonstrated to Napoleon III that the existence of a telegraphic meteorological network would have allowed him to avoid the Sevastopol disaster.

The storm that caused the loss of a large part of the French fleet on November 14, 1854, was indeed predictable, if the appropriate observation network had been available.

The decision to create an international meteorological service with telegraphic transmission of observations was taken in 1856.

On 2 November 1857, a table of meteorological observations was published in the International Bulletin of Paris Observatory.

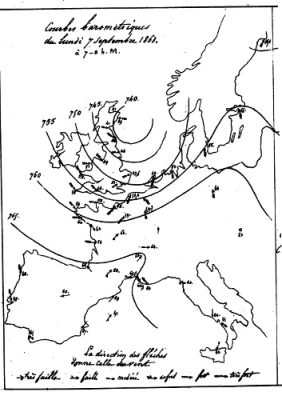
On September 7, 1863, the first isobaric map of the situation of the previous day in Europe was presented (Figure 13).

Wilhem Brandes (1777-1834) had led the way by illustrating

premiere carte isobarique 1863
Figure 13. The first isobaric map published in France in 1863. [© Météo-France]
four maps his 1826 thesis on the route of the strong depression from England to Norway between 24 and 26 December 1821 [13].

5. Upper air observations

5.1. The balloons probe

In 1898, Léon Teisserenc De Bort (1855-1913) began vertical exploration of the atmosphere using kites and then balloons. In 1899, he highlighted the existence of the stratosphere. But it was with the First World War that the major interest of these observations was recognized and a network of sounding stations was set up.

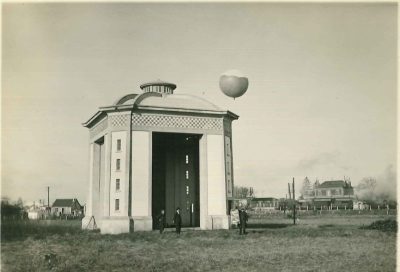
In 1927, Robert Bureau (1892-1965) and Pierre Idrac (1885-1935) developed the radiosonde, which made it possible to receive on the ground, by radio, the measurements of the instruments carried by the balloon (Figure 14).

ballon-sondes meteo - premiers radiosondages
Figure 14. First radiosondes in Trappes around 1930. [© Météo-France]. Extract from the ONM report and correspondence 1925-1953/Observatoire de Trappes
These observations are, until the arrival of satellite data, the main observations assimilated in numerical forecast models.

5.2. The satellites

satellites - observation meteo satellite
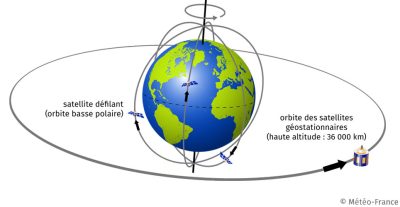
Figure 15. Earth weather observation by satellites. [© Météo-France]
The first meteorological satellite, TIROS-1, was launched on April 1, 1960. In 1966, the geostationary satellite ATS1 provided spectacular images of the Earth and cloud formations in the atmosphere. The decision to provide meteorological coverage of the planet is made. The first geostationary satellite, American, was launched in 1974. The European satellite, Meteosat, was launched in 1977. Scrolling satellites complete the device (Figure 15).

5.3. Radar observations

Melodi Dammartin
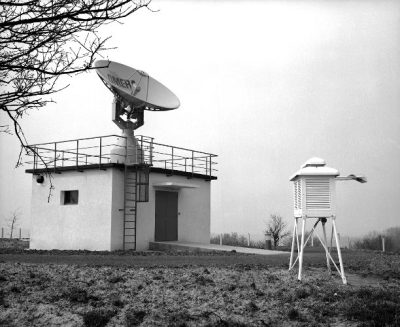
Figure 16. One of the first French precipitation radars, the Melodi, in Dammartin, in 1974. [© Météo-France]
In 1889, Heinrich Hertz (1857-1894) laid down the principles of detecting metal surfaces by electromagnetic waves. During the Second World War, while operators routinely used radars to detect aircraft, the existence of echoes linked to precipitation was highlighted. The link between the reflectivity measured by the radar and the intensity of precipitation (Z-R law) is established. The first precipitation detection radar, the WSR-57, is developed by the US Meteorological Service. In France, the Aramis network that provides radar meteorological coverage for France was created in the 1980s [14], after the installation of pilot radars, such as the Melodi radar in Dammartin (Figure 16).

6. Use in weather prediction and climate change models

6.1. Numerical prediction models

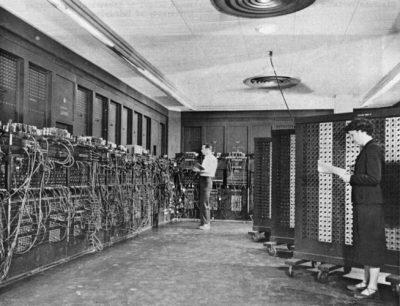
ENIAC
Figure 17. ENIAC is the computer on which the first numerical weather forecast was made in 1950. See page for author (Public domain), via Wikimedia Commons. [© U. S. Army]
Lewis Fry Richardson (1881-1953) established, in 1922, how from a set of meteorological observations, it is possible to calculate its evolution [15]. In 1938 Carl-Gustav Rossby (1898-1957) proposed simpler equations to calculate the displacement of disturbances at temperate latitudes. In August 1946, John von Neuman (1903-1957) organized the first conference on “Dynamic Meteorology and High-Speed Automatic Electronic Computing” in Princeton. Jule Charney (1917-1981) designed the first model and tested it in March 1950 in Aberdeen, on the ENIAC (Figure 17), one of the first electronic computers. Even if it takes five weeks to make three conclusive forecasts, the numerical forecast is launched [16].

The first set of 24-hour forecasts was published in 1954 by the Weather Bureau. It is based on a human analysis of meteorological observations. In France, it was not until the 1970s and the development of the Amethyst forecast model that numerical prediction, with radiosonde observations as input data, became operational [17]. The forecasts are limited to metropolitan France with a three-hour time horizon [18].

6.2. Climate models

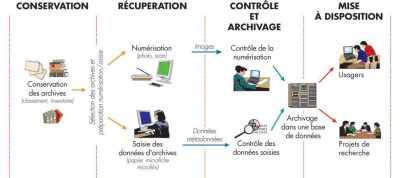
projet date rescue
Figure 18. The Data Rescue project for meteorological observations. [© Météo-France]
Unlike forecasting models, climate models are not permanently fed by meteorological observations. These are used to define an initial state of the atmosphere, then the model calculates its evolution, according to the defined rules and assumptions such as, for example, the greenhouse gas content over a 100-year period [19]. Observations are also used to verify the model’s ability to reconstruct past climate in order to conclude on its relevance in simulating future climate. The observations used are homogenized meteorological observations to take into account the variability of the conditions under which they were made. The World Meteorological Organization (WMO) has launched a vast programme to recover meteorological records (Data Rescue) in order to make observations available to researchers (Figure 18) in order to reconstruct the Earth’s recent past climates [20].

7. Messages to remember

  • The arrival of meteorological instruments in the 16th century provided the measurements.
  • The establishment of meteorological networks that standardize measurements makes it possible to transform measurements into climatological observations and to compare the Earth’s climates.
  • The arrival of the telegraph, which allowed for rapid exchanges of observations, made it possible in the second half of the 19th century to consider forecasting the weather.
  • The development of aviation and the resources given to meteorology during the two great wars of the 20th century allowed major advances in the knowledge of the functioning of the atmosphere.
  • The development of computing facilities and satellites in the 1970s marked a decisive turning point in the field of meteorological observation and its use to predict the weather and study climate change.


References and notes

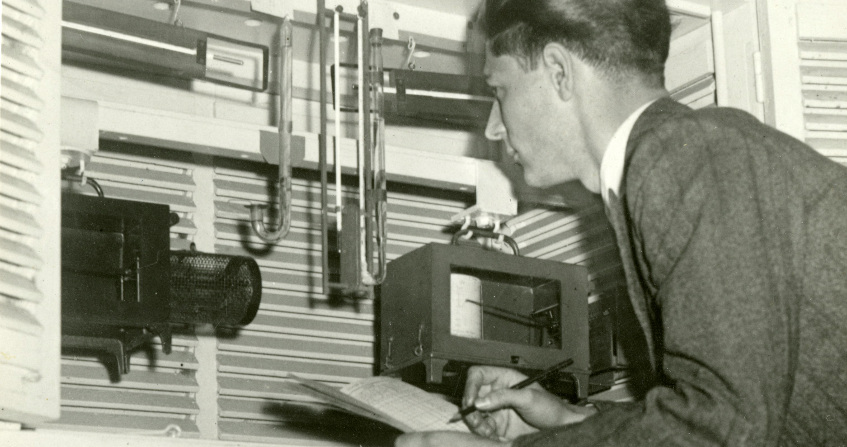
Cover image. Meteorological observation in the 1950s. [Source: © Météo-France]

[1] FIERRO A. (1991). History of meteorology. Paris: Denoël

[2] THE ROY LADURIE E. (1967) History of climate since the year 1000. Paris: Flammarion

[3] LITZENBURGER L. (2015), A City Facing Climate: Metz at the End of the Middle Ages, Nancy: PUN

[4] PASCAL B. (1663) Treatises on the balance of liquors, and the gravity of air mass…Paris: Guillaume Desprez

[5] JAVELLE JP, ROCHAS M., PASTRE C., HONTARREDE M., BEAUREPAIRE M., JACOMY B. (2000), Du baromètre au satellite, Paris : Delachaux & Nestlé

[6] JAVELLE JP, ROCHAS M., PASTRE C., HONTARREDE M., BEAUREPAIRE M., JACOMY B. (2000), Du baromètre au satellite, Paris : Delachaux & Nestlé

[7] RENOW E. (1876), Histoire du thermomètre, Annuaire de la Société météorologique de France, n°24, http://bibliotheque.meteo.fr/exl-php/oaidoc/DOC00028778.html

[8] AVELLE JP, ROCHAS M., PASTRE C., HONTARREDE M., BEAUREPAIRE M., JACOMY B. (2000), Du baromètre au satellite, Paris : Delachaux & Nestlé

[9] JAVELLE JP, ROCHAS M., PASTRE C., HONTARREDE M., BEAUREPAIRE M., JACOMY B. (2000), Du baromètre au satellite, Paris : Delachaux & Nestlé

[10] FIERRO A. (1991). History of Meteorology, Paris: Denoël

[11] COTTE L (1774), Traité de météorologie, Paris: Imprimerie Royale http://gallica.bnf.fr/ark:/12148/bpt6k94863w

[12] SOCIETAS METEOROLOGICA PALATINA (1781-1786), Ephemerides Societatis meteorologicae palatinae, Manheim : Schwan, http://bibliotheque.meteo.fr/exl-php/vue-consult/mf_-_research_advance/ISO0000008104

[13] PARROCHIA D. (1998), Météores – Essay on the sky and the city, Paris:ChampVallon

[14] PARENT OF CHATELET J. (2003), Aramis, the French radar network for precipitation monitoring, La Météorologie, n°40, http://documents.irevues.inist.fr/handle/2042/36263

(1922), Weather prediction by natural process, Cambridge University Press, https://archive.org/details/weatherpredictio00richrich

[15] RICHARDSON LF. (1922),  Weather prediction by natural process, Cambridge University Press, https://archive.org/details/weatherpredictio00richrich

[16] ROCHAS M., JAVELLE .-P. (1993), La météorologie : la prévision numérique du temps et du climat, Aubenas : Syros

[17] PAILLEUX J., (2002), Les besoins en observations pour la prévision numérique du temps, La Météorologie, n°39, p29-35, http://documents.irevues.inist.fr/bitstream/handle/2042/36244/meteo_2002_39_29.pdf?sequence=1&isAllowed=y

[18] ROUSSEAU D., LE PHAM H, JUVANON DU VACHAT R. (1995), Vingt-cinq ans de prévision numérique du temps, La Météorologie, n°spécial, p129-134. http://documents.irevues.inist.fr/bitstream/handle/2042/52038/meteo_1995_SP_129.pdf

[19] ,PLANTON S., DUFRESNE J.-L. (2007), Description of a generic organizational chart, Le climat à découvert, p150-153, https:https://books.openedition.org/editionscnrs/11431?lang=en

[20] JOURDAIN S., ROUCAUTE E., DANDIN P., JAVELLE JP, DONET I., MENASSERE S., CENAC N., (2015), Le sauvetage de données climatologiques, La Météorologie, N°89, p47-55


The Encyclopedia of the Environment by the Association des Encyclopédies de l'Environnement et de l'Énergie (www.a3e.fr), contractually linked to the University of Grenoble Alpes and Grenoble INP, and sponsored by the French Academy of Sciences.

To cite this article: PEPIN Marie-Hélène (March 5, 2019), Meteorological observations over the past centuries, Encyclopedia of the Environment, Accessed September 14, 2024 [online ISSN 2555-0950] url : https://www.encyclopedie-environnement.org/en/air-en/meteorological-observations-over-past-centuries/.

The articles in the Encyclopedia of the Environment are made available under the terms of the Creative Commons BY-NC-SA license, which authorizes reproduction subject to: citing the source, not making commercial use of them, sharing identical initial conditions, reproducing at each reuse or distribution the mention of this Creative Commons BY-NC-SA license.

过去几个世纪的气象观测

PDF
observation meteorologique annees 1950 - meteo 1950 - meteorological observations

  气象学一直是人类关注的主题。人类早期的著作中有大量关于气象的描述,例如洪水,这是所有文明中最常见的神话。在中世纪的欧洲,编年史学家直接记录天气事件(风暴,寒冷等),或通过葡萄收获日期间接记录。然而,直到16世纪末才出现了第一批对大气状况进行科学描述所必需的测量仪器。17世纪出现了观测网概念,目的是在量化的基础上描述地球气候的特征。早在1860年,电报以及更广泛的传输技术的发展使得通过气象观测预测天气成为可能。高空天气观测始于20世纪初。随着天气预报的发展,高空天气观测受到的关注与日俱增。自1960年以来,卫星被用于气象观测。今天,天气观测数据被存档和储存在数据库中,用于数值天气预报或气候变化模型。

1. 器测时期以前的观测

1.1. 最初的著作
环境百科全书-过去气象-巴勒莫帕拉廷教堂
图1. 洪水退去,出现彩虹。巴勒莫帕拉廷教堂。
[图片来源:© 让·皮埃尔·达尔贝拉(Jean-Pierre Dalbéra),法国巴黎,CC By 2.0 (https://creativecommons.org/licenses/by/2.0),通过维基共享]

  所有有关古代人类历史的文献都提到了天气事件,其中最著名的事件可能是洪水。摩诃婆罗多描述了一颗彗星划过地平线带来一场持续12年的暴雨。在《圣经》中,彩虹标志着洪水过后降雨结束,以及神与人之间的新约(见图1)。

  中国的天气观测历史悠久。早在公元前1216年,就有文字记录了每十天一次的气象事件。文中甚至明确指出了风向。迦勒底或巴比伦的巫师也在泥板上留下了对天气现象的描述。希腊人认为气象学是一门科学。公元前334年左右,亚里士多德写了第一篇气象论文,将气象观测与物理现实而非神的行为联系起来[1]

1.2. 中世纪到17世纪的欧洲

环境百科全书-过去气象-收获日
图2. 收获日期被用来了解过去的气候——13世纪《诗篇》手稿39。
[图片来源:博恩市立图书馆]

  历史学家埃马纽埃尔·勒·罗伊·拉迪里(Emmanuel Le Roy Ladurie)利用中世纪学者留下的编年史来了解人类历史及其遭受的气候灾害。他使用天气观测资料,如葡萄采摘日(图2)、收获日以及产量和质量,作为直接和辅助的资料来源。这些数据至少在这一时期对气象观测具有重要意义[2]。其他历史学家也使用了一些补充指标,例如,修改时间的实验报告[3]。有关预测天气的谚语(其中一些可以追溯到中世纪)也证实了人类观察天气并试图预测其变化。

2. 观测仪器

  尽管有证据表明很早以前就有气象观测仪器,但大多数测量气象要素所需的仪器直到16世纪才被发明出来。

2.1. 气压计
环境百科全书-过去气象托里拆利真空实验
图3. 1643年托里拆利进行的真空实验。
[图片来源:© D’ALENCE J.(1688) 关于气压计、温度计和气压计的论文,阿姆斯特丹]

  托里拆利(Torricelli,1608-1647)第一个提出了气压计的原理,并在1644年通过一个充满水银的管子证明了大气压力的存在(图3)。帕斯卡(Pascal,1623-1662)在1648年指出,用托里拆利管测量的大气压力随着海拔的升高而降低。1663年,他发明了虹吸气压计[4]。1665年,英国科学家罗伯特·博伊尔(Robert Boyle,1627-1691)首次使用气压计这个名称[5]。从那时起,气压计经历了许多变化和发展,其中最重要的一个变化是卢西安·维迪(Lucien Vidie,1805-1866)对其进行的改进。卢西安·维迪为19世纪的科学考察提供了一种便携式、无汞仪器:无液气压计。无液气压计包括一个可变形的金属盒(称为维迪(Vidie)胶囊),盒内部分是真空。它的压缩受到弹簧的限制,弹簧的张力是压力的函数。维迪胶囊仍然是当今许多气压计的敏感元件。

2.2. 温度计
环境百科全书-过去气象-Telioux温度计的复制品
图4. 1995年在特拉普(Trappes)生产的Telioux温度计的复制品。
[图片来源:法国气象局]

  即使我们知道古希腊的物理学家,如拜占庭的菲罗(Philo)或亚历山大的希罗(Hero)曾测量过气温的变化,但17世纪的几位科学家却声称应对气温变化负责。1611年,巴洛梅奥·泰利乌(Barlomeo Telioux)解释了温度计的原理,即可以通过测量水柱的高度来估计气压和温度的变化(图4)。

  1612年,意大利医生桑托里奥·桑托里奥(Santorio Santorio,1561-1636)使用温度计来诊断病人的发烧情况[6]。1621年,荷兰人科内利斯·德雷贝尔(Cornelis Drebbel)发明了一种具有基本功能的温度计:把一个一端是玻璃气球的细长管插入装满水的容器中。水在管中升降。当病人把手放在球上时,释放的热量会使球体内的空气膨胀,并将水位降低到一定的高度。温度变化可通过定期重复实验并每次测量这一高度来监测[7]

环境百科全书-过去气象-桑克托里奥医生
图5. 发明了多种气象测量仪器的意大利医生桑托里奥(Santorio)
[图片来源:贾科莫·普契尼(Giacomo Puccini,公共领域),通过维基共享]

  在1641年的佛罗伦萨,在托斯卡纳大公费迪南德二世的支持下,桑托里奥(Santorio)完善了温度计:将水置于一个密封管内以消除了大气压力的影响。德国的大卫·华氏(David Fahrenheit,1686-1736)通过将水银注入一个封闭的管中并通过标明刻度范围来提高其可靠性。瑞典人安德斯·摄尔修斯(Anders Celsius1701-1744)提出了一个标度,其中零相当于水的沸腾温度,100相当于冰的融化温度。将上述数值颠倒过来,这个标准就逐渐变成了现代水温变化的参考值。1954年,开尔文成为测量温度的国际单位,要从摄氏温度转换成开氏温度,需加上273.15。不过,世界气象组织(WMO)仍然使用摄氏温度。

2.3. 湿度计

  列奥纳多·达·芬奇(Leonardo da Vinci)的《大西洋手稿》收集了许多从1478年至1518年间绘制的科学和技术图纸,其中一张图画有一个称重装置。一个托盘装有海绵,另一个托盘装有石头。这种称重装置可以测量空气湿度的变化,因为海绵的重量会随环境湿度的变化而变化,而石头的重量则保持稳定。这是气象学中使用的湿度计的雏形。
环境百科全书-过去气象-毛发湿度计
图6. 毛发湿度计。
[图片来源:法国气象局]

  前文温度计小节中提到的意大利人桑托里奥·桑托里奥(图5)也提出了几种可能测量湿度的方法。17和18世纪的几位科学家也发明了某些测量空气湿度的仪器。瑞士的霍勒斯·本尼迪克特·德·索绪尔(Horace Benedict de Saussure,1740-1799)发明了毛发湿度计(图6),这是一种简单、廉价、便携的仪器,长期以来一直用于气象观测[8]

2.4. 风速计

环境百科全书-过去气象-罗宾逊风速计
图7. 带计数器的罗宾逊(Robinson)风速计。
[法国气象局]
  如果说观测风向自古以来就很普遍,那么直到1450年里昂·巴蒂斯塔·阿尔贝蒂(Leone Battista Alberti,1414-1472)才提出了一种改进的风向标,可以根据一块板绕水平轴移动的角度来估算风力强度。1664年,英国人罗伯特·胡克(Robert Hooke,1635-1703)发明了一种能同时测量风向和风力的风速计。1806年,英国海军上将弗朗西斯·博福特爵士(Sir Francis Beaufort,1774-1857)根据对一艘三桅护卫舰的观测,推出了一种非常简单的数字刻度[9]。然而直到1846年托马斯·罗姆尼·罗宾逊(Thomas Romney Robinson,1792-1882)发明了杯型风速计(图7),风力测量才被认为是相对可靠的。了解测量方法非常重要,因为风是一个在时间和空间上都极易变化的参数。

3. 观测网络

环境百科全书-过去气象-费迪南德二世
图8. 建立了第一个气象观测网络的费迪南德二世(Ferdinand)。
[图片来源:朱斯托·萨斯特曼斯(GiustoSustermans ,公共领域) ,通过维基共享]

  测量仪器的发展使当时的科学家能够对测量结果进行比较,从而确定测量区域的气候特征。费迪南德二世(图8)托斯卡纳大公在西芒托学院的支持下为11个城市(佛罗伦萨,比萨,瓦隆布罗萨,库蒂利亚诺,博洛尼亚,米兰,帕尔马,奥瑞斯,奥斯纳布鲁克,因斯布鲁克,华沙)提供了气压计和温度计,并收集了10年的观测数据。1667年,天主教会的敌意终止了这一首个气象观测网络[10]

  1776年,法国皇家医学会创建了一个气象观测网络,以研究环境气候条件与疾病之间的联系。奥尔特里亚神父路易·科特(Louis Cotte,1740-1815年)组织该网络的运行:他列出了要使用的仪器,规定了仪器的安装和维护条件,提供了要填写的表格,并组织了仪器的收集和数据的归档。1784年,该网络包含了来自世界各地的76个观测站。位于曼海姆的普法尔茨气象学会选择了57家机构,从1780年起与其进行合作并交换气象观测数据。在1792年,法国大革命事件终止了这些观测网络的运作,幸运的是,由科特[11](图9)和普法尔茨学会收集的观测记录[12]被保留了下来。
环境百科全书-过去气象-北京观测数据
图9. 路易斯∙科特(Louis Cotte)收集到的来自北京的观测数据(1757-1762)。
[图片来源:法国气象局]

  一些观测爱好者,尤其是农民和医生仍继续进行气象观测。在法国,直到1848年才出版了第一本《法国气象年鉴》,汇集了观测爱好者自发收集的气象观测数据。查尔斯·圣·克莱尔·德维尔(Charles Sainte-Claire Deville,1814-1876)和埃米利安·雷诺(Emilien Renou,1815-1902)于1852年提出并创立了法国气象学会(SMF),接管了该年鉴的出版工作。

  专业气象服务机构的建立为不同的网络提供了必要的一致性,以便观测数据的实际应用。1864年奥本勒维耶(Urbain Le Verrier,1811-1877)在法国利用初级教师培训学院网络提供气象观测。1865年,部门气象委员会成立。1914年,这些委员会管理了一个由2000多名志愿观察员组成的网络(图10)。
环境百科全书-过去气象-降雨观测
图10. 1897年在诺瓦西勒塞克(Noisy le Sec)观测降雨。
[图片来源:法国气象局]

  1847年,在德国成立了普鲁士气象研究所。气候学家威廉·马尔曼(Wilhem Mahlmann,1812-1848)定义了局地气候的概念,并组建了气象观测网络。在1833年创建的布鲁塞尔天文台,每天都有气象观测记录。阿道夫·凯特勒(Adolphe Quetelet,1796-1874)利用这些观测记录进行统计,并试图确定天气根据时间演变的物理规律。1850年成立了伦敦皇家气象学会,它将英国早在1848年出版的《每日新闻》中所有气象观测数据汇总在一起。早在1853年,海军上将罗伯特·菲茨罗伊(Admiral Robert Fitzroy)就提出了基于海上观测数据的预测规则,但美国人马修·方丹·毛利(Matthew Fontaine Maury)在同一年实现了海上观测数据的标准化,以便所有人都能使用。

  詹姆斯·波拉德·埃斯佩(James Pollard Espy,1785-1860)向美国国会建议每个县都应配备气象站,包括气压计、温度计和雨量计。这些观测数据使他早在1841年就绘制出了天气图。然而,美国直到1870年2月9日才成立了气象局。
环境百科全书-过去气象-世界气象组织首任主席白贝罗
图11. 世界气象组织首任主席白贝罗(C.-H. buy-ballot)。
[图片来源:法国气象局]

  1873年,世界气象组织在维也纳成立,第一任主席是英国人白贝罗(Charles-Henri Buys Ballot,1817-1890)(图11)。该组织的主要目的是交流气象观测数据,因此重点关注气象观测数据的标准化和定义其传输编码。

4. 观测数据的传输

  1851年,在伦敦世界博览会上,电报公司展示了一张地图,上面显示了二十二个接受点的时间、风压和方向。通过电报或无线电快速交流气象观测结果使这些观测网络变得越来越重要。能够在收到观测数据几个小时内对其进行分析使得预测天气成为可能。观测数据不再仅仅只是用于研究气候。
环境百科全书-过去气象-奥本·勒维耶雕塑
图12. 巴黎天文台前亨利·查普 (Henri Chapu) 创作的奥本·勒维耶(Urbain Le Verrier)雕像。
[图片来源:彭·塔布雷特(P. Taburet),法国气象局]

  1855年,奥本·勒维耶(U. Le Verrier)(图12)向拿破仑三世证明,电报气象观测网络的存在可以让他避免塞瓦斯托波尔灾难。

  1854年11月14日一场风暴使得法国舰队损失惨重。如果有适当的观测网络,这场风暴本是可以预测到的。

  1856年,法国决定建立一个国际气象服务机构,通过电报传送观测数据。

  1857年11月2日,《巴黎天文台国际公报》发布了一份气象观测表。

  1863年9月7日,首张欧洲前一天的等压线地图问世(图13)。
环境百科全书-过去气象-第一张等压线地图
图13. 1863年法国出版的第一张等压线地图。
[图片来源:法国气象局]

  威尔海姆·布兰德斯(Wilhem Brandes,1777-1834)在其1826年的论文中率先绘制了四幅图,描述了1821年12月24日至26日从英国到挪威的强低气压路线[13]

5. 高空观测

5.1. 探空气球

  1898年,莱昂·泰瑟伦·德·博尔特(Léon Teisserenc De Bort ,1855-1913) 开始使用风筝和气球对大气进行垂直探测。 1899年,他论证了平流层的存在。 但直到第一次世界大战,人们才认识到这些观测的意义所在,并建立了一个探空站网络。
环境百科全书-过去气象-第一次无线电探空观测
图14. 1930年左右特拉普斯天文台首批无线电探空仪。
[图片来源:法国气象局,摘自ONM的报告和通信1925-1953/特拉普斯天文台]

  1927年,罗伯特·伯克(Robert Bureau,1892-1965年)和皮埃尔·伊德拉克(Pierre Idrac,1885-1935年)发明了无线电探空仪,在地面上可以通过无线电接收气球携带仪器的测量数据(图14)。在卫星数据出现之前,这些观测数据是数值天气预报模式同化的主要观测数据。

5.2. 卫星观测
环境百科全书-过去气象-卫星观测地球大气
图15. 卫星观测地球大气。
[图片来源:法国气象局]
satellite défilant (orbite basse polaire) :卫星(低极轨轨道)
orbite des satellites géostationnaires (haute altitude : 36 000 km):地球静止轨道 (高空:36 000公里)

  1960年4月1日,第一颗气象卫星TIROS-1发射升空。1966年,地球同步卫星 ATS1提供了壮观的地球和大气云层图像。人们决定用气象卫星对地球进行全面观测。1974年,第一颗地球同步卫星American发射升空。1977年,欧洲卫星 Meteosat 发射升空(图15)。

5.3. 雷达观测
环境百科全书-过去气象-降水雷达
图16. 1974年,位于达马丁(Dammartin)的梅洛迪(Melodi)是法国最早的降水雷达之一。
[图片来源:法国气象局]

  1889年,海因里希·赫兹(Heinrich Hertz,1857-1894年)提出了通过电磁波检测金属表面的原理。第二次世界大战期间,当操作员例行使用雷达探测飞机时,发现了与降水有关的回波的存在。雷达测得的反射率与降水强度之间的联系(Z-R定律)得以确立。由此,美国气象局开发第一台降水探测雷达WSR-57。1980年代法国在安装了飞行雷达,如丹马丁的Melodi雷达(图16)之后,建立了为法国提供雷达气象覆盖的Aramis网络[14]

6. 在数值天气预报和气候模式中的应用

6.1. 数值天气预报模式

环境百科全书-过去气象-第一台数值天气预报的计算机
图17. 1950年首次进行数值天气预报的计算机ENIAC 。
[图片来源:参见作者页面(公共领域) ,通过维基共享资源,美国陆军]

  1922年,路易斯·弗莱·理查森(Lewis Fry Richardson,1881-1953年)提出了如何通过一组气象观测结果计算其演化的方法[15]。 1938年,卡尔·古斯塔夫·罗斯比(Carl-Gustav Rossby,1898-1957年)提出了更简单的方程来计算温带地区扰动的变化量。 1946年8月,约翰·冯·诺依曼(John von Neuman,1903-1957年)在普林斯顿组织了第一届“动态气象学和高速自动电子计算”会议。朱尔·查尼(Jule Charney,1917-1981年)设计了第一个模型,并于1950年3月在阿伯丁的ENIAC(图17,第一台数值天气预报计算机)上进行了测试。即使要花五周时间才能做出三次结论性预测,数值预报也算是成功进行了[16]

  1954年,通过人工分析气象观测数据,气象局发布了第一套24小时天气预报。在法国,直到1970年代随着Amethyst预报模型的发展,以无线电探空仪观测数据作为输入数据的数值预报才开始投入使用[17]。其预报范围仅限于法国市区,时间跨度为3小时[18]

6.2. 气候模式

环境百科全书-过去气象-气象观测数据恢复项目
图18. 气象观测数据恢复项目
[图片来源:法国气象局]
Conservation:保存
conservation des archives:档案保存
(Classement:分类; inventaire:清单)
Selection des archives et preparation numerisation/saisie: 档案选择及数字化准备/输入
Recuperation:恢复
Numerisation:数字化
Photo:拍照; scan:扫描
Saisie des donnees d’archieves 输入存档数据
(papier:文件; microfiche:缩微胶片; microfilm:缩微胶卷)
Images:图像
Donnees metadonnees:元数据
Controle et archivage:控制和存档
Controle de la numerisation:数字化控制
Controle des donnees saisies:检查输入的数据
Archivage dans une base de donnees:在数据库中存档
Mise a disposition:交付使用
Usagers:用户
Projets de recherche:研究项目

  与数值天气预报模式不同,气候模式不需要一直输入气象观测数据,而是将观测数据用于定义大气的初始状态,然后模型根据已定义的规则和假设(例如,100年的温室气体含量[19])计算气候演变。此外,观测数据还被用于验证模型重建过去气候的能力,从而得出其与模拟的未来气候的相关性。气候模式使用的是均一化的气象观测数据,以消除它们在不同观测条件下的差异和变化。 世界气象组织(WMO)启动了一项庞大的气象观测记录恢复(数据救援)项目以便研究人员获得观测数据(图18),从而重建地球近期的气候[20]

7. 需要记住的信息:

  • 16世纪气象观测仪器的出现为气象观测提供了测量数据。
  • 建立标准化的气象观测网络可以将测量数据转化为气候学观测数据,并对地球气候进行比较。
  • 19世纪下半叶,电报的出现使得人们可以快速交换观测数据从而预测天气。
  • 20世纪两次大战期间航空业的发展和气象资源的投入,使人们对大气有了更充分的认识。
  • 20世纪70年代,计算机和卫星的发展标志着气象观测领域的一个转折点,气象观测被用于预测天气和研究气候变化。


参考资料及说明

封面图片:1950年代的气象观测。[图片来源:©法国气象局]

[1] FIERRO A. (1991). History of meteorology. Paris: Denoël

[2] THE ROY LADURIE E. (1967) History of climate since the year 1000. Paris: Flammarion

[3] LITZENBURGER L. (2015), A City Facing Climate: Metz at the End of the Middle Ages, Nancy: PUN

[4] PASCAL B. (1663) Treatises on the balance of liquors, and the gravity of air mass…Paris: Guillaume Desprez

[5] JAVELLE JP, ROCHAS M., PASTRE C., HONTARREDE M., BEAUREPAIRE M., JACOMY B. (2000), Du baromètre au satellite, Paris : Delachaux & Nestlé

[6] JAVELLE JP, ROCHAS M., PASTRE C., HONTARREDE M., BEAUREPAIRE M., JACOMY B. (2000), Du baromètre au satellite, Paris : Delachaux & Nestlé

[7] RENOW E. (1876), Histoire du thermomètre, Annuaire de la Société météorologique de France, n°24, http://bibliotheque.meteo.fr/exl-php/oaidoc/DOC00028778.html

[8] AVELLE JP, ROCHAS M., PASTRE C., HONTARREDE M., BEAUREPAIRE M., JACOMY B. (2000), Du baromètre au satellite, Paris : Delachaux & Nestlé

[9] JAVELLE JP, ROCHAS M., PASTRE C., HONTARREDE M., BEAUREPAIRE M., JACOMY B. (2000), Du baromètre au satellite, Paris : Delachaux & Nestlé

[10] FIERRO A. (1991). History of Meteorology, Paris: Denoël

[11] COTTE L (1774), Traité de météorologie, Paris: Imprimerie Royale http://gallica.bnf.fr/ark:/12148/bpt6k94863w

[12] SOCIETAS METEOROLOGICA PALATINA (1781-1786), Ephemerides Societatis meteorologicae palatinae, Manheim : Schwan, http://bibliotheque.meteo.fr/exl-php/vue-consult/mf_-_research_advance/ISO0000008104

[13] PARROCHIA D. (1998), Météores – Essay on the sky and the city, Paris:ChampVallon

[14] PARENT OF CHATELET J. (2003), Aramis, the French radar network for precipitation monitoring, La Météorologie, n°40, http://documents.irevues.inist.fr/handle/2042/36263(1922), Weather prediction by natural process, Cambridge University Press, https://archive.org/details/weatherpredictio00richrich

[15] RICHARDSON LF. (1922),  Weather prediction by natural process, Cambridge University Press, https://archive.org/details/weatherpredictio00richrich

[16] ROCHAS M., JAVELLE .-P. (1993), La météorologie : la prévision numérique du temps et du climat, Aubenas : Syros

[17] PAILLEUX J., (2002), Les besoins en observations pour la prévision numérique du temps, La Météorologie, n°39, p29-35, http://documents.irevues.inist.fr/bitstream/handle/2042/36244/meteo_2002_39_29.pdf?sequence=1&isAllowed=y

[18] ROUSSEAU D., LE PHAM H, JUVANON DU VACHAT R. (1995), Vingt-cinq ans de prévision numérique du temps, La Météorologie, n°spécial, p129-134. http://documents.irevues.inist.fr/bitstream/handle/2042/52038/meteo_1995_SP_129.pdf

[19] PLANTON S., DUFRESNE J.-L. (2007), Description of a generic organizational chart, Le climat à découvert, p150-153, https:https://books.openedition.org/editionscnrs/11431?lang=en

[20] JOURDAIN S., ROUCAUTE E., DANDIN P., JAVELLE JP, DONET I., MENASSERE S., CENAC N., (2015), Le sauvetage de données climatologiques, La Météorologie, N°89, p47-55


The Encyclopedia of the Environment by the Association des Encyclopédies de l'Environnement et de l'Énergie (www.a3e.fr), contractually linked to the University of Grenoble Alpes and Grenoble INP, and sponsored by the French Academy of Sciences.

To cite this article: PEPIN Marie-Hélène (March 6, 2024), 过去几个世纪的气象观测, Encyclopedia of the Environment, Accessed September 14, 2024 [online ISSN 2555-0950] url : https://www.encyclopedie-environnement.org/zh/air-zh/meteorological-observations-over-past-centuries/.

The articles in the Encyclopedia of the Environment are made available under the terms of the Creative Commons BY-NC-SA license, which authorizes reproduction subject to: citing the source, not making commercial use of them, sharing identical initial conditions, reproducing at each reuse or distribution the mention of this Creative Commons BY-NC-SA license.