Hydrometry: measuring the flow rate of a river, why and how?
PDF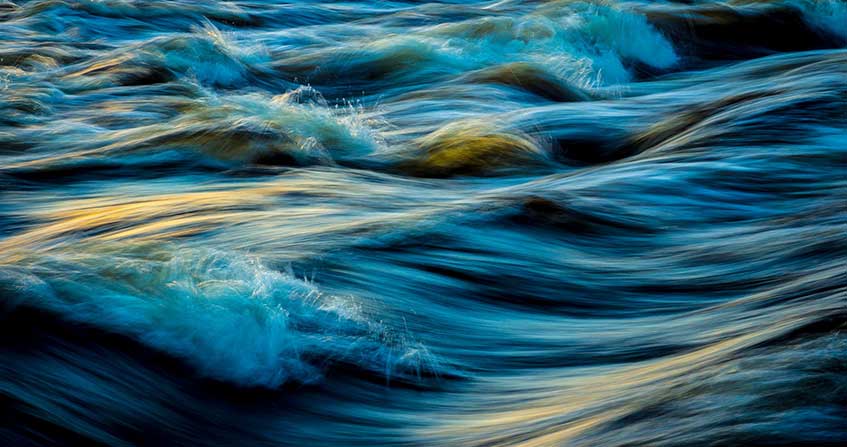
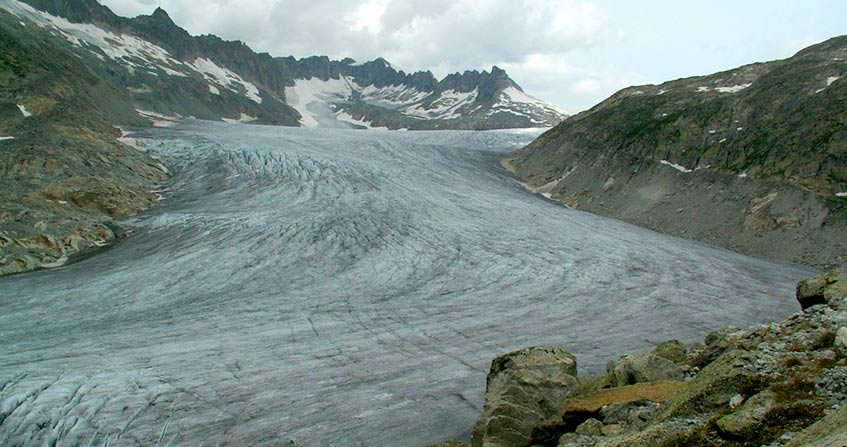
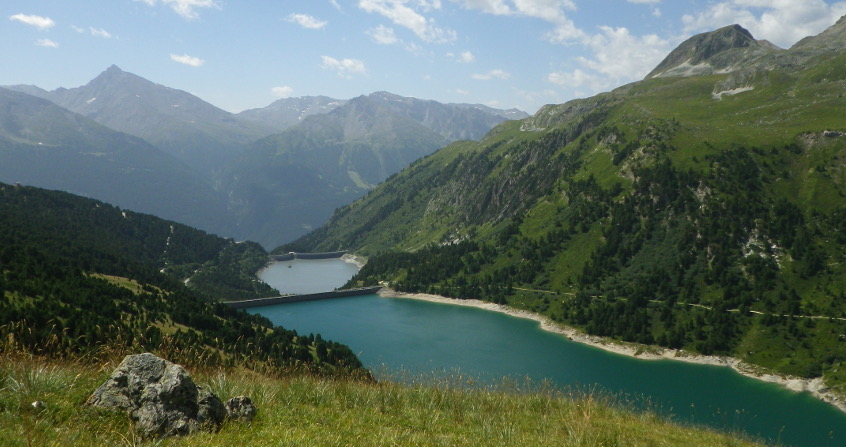
Predicting and managing river flows is a necessity for flood control, water supply, agriculture and energy production. However, knowing how to measure these flows is a prerequisite. This constitutes hydrometry, a science distinct and complementary to hydrology (science of water in its natural environment) and hydraulics (physics of flows). About one-third of the rain that falls on the continents returns to the sea and oceans (the other two-thirds evaporating directly or being consumed by plants). On a global scale, nearly 36,000 km3 of water flows through rivers each year. But these quantities can be very unevenly distributed, both from one continent to another, and – for the same river – from one year to another or within the same year. This irregularity can only be approached by permanently measuring the flows of these rivers. However, the continuous measurement of the flow of a watercourse cannot be obtained directly, but is the result of an experimental process combining several field observations..
1. Measuring river flow rates, an old but difficult issue
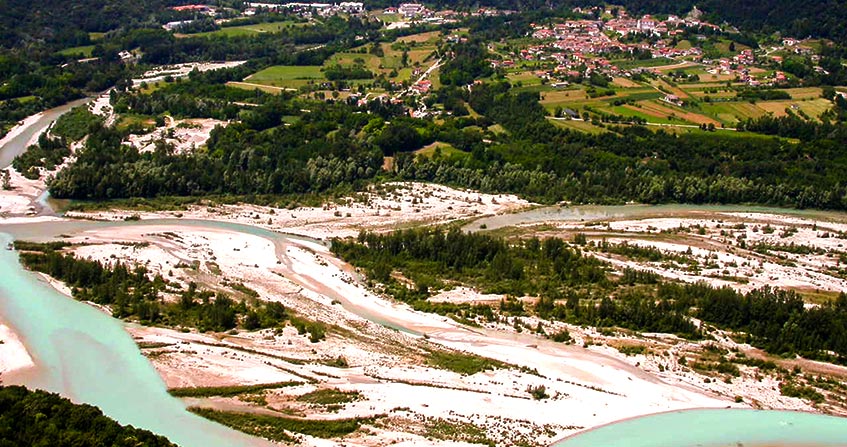
Each watercourse follows a particular regime, determined by the rhythm of precipitation and its hydrological “terroir”. For the world’s most populated river, the Amazon, the variation in flow between two extreme months of the same month is only one to two. And from one year to the next, its average annual flow at its mouth varies only 10 to 15% around its 206,000 m3/s value. The Amazon is an extremely regular river.
On the other hand, an African river like the Chari has an average flow of 1197 m3/s at its outlet in Lake Chad. Within the same year, the variation in flow between two extreme months is a factor of 20 (150 to 3000 m3/s). And from one year to the next, the average annual flow can vary by a factor of two: 739 m3/s in 1942, 1720 m3/s in 1956. The Chari therefore has a much more contrasting regime.
But how are these flows measured? Since ancient times, mankind has been interested in it, at the very least, when it became dependent on agriculture. But it is a much more difficult problem than its familiarity would suggest. What made James Jeans (British physicist, 1877-1946) write: “The total radiation emitted by the Sun in the unit of time, transformed into mass, is something like 10,000 times that of the water flowing in the Thames under the London Bridge; and incidentally, if the factor 10,000 is gross, it is not because we do not know the exact mass of the solar radiation, but because we are not able to measure the average flow of the Thames. »
2. Why are river flow rates being measured nowadays?
The measurement of river flows serves several purposes:
- operational management of hydraulic structures (hydroelectric facilities, irrigation systems, flood control tanks or low water level support systems, etc.);
- the dimensioning of these structures, through knowledge of the characteristics of these watercourses;
- regulatory control, for verification of flow release obligations downstream of structures (minimum flow to ensure fish survival, maintenance of other uses; non-aggravation of floods), declaration of disaster status (droughts…);
- protection of property and persons, through flood warning;
- of heritage, by the constitution of series of long-term observations, essential to know the evolution of river regimes, to raise awareness of natural risks, to assign a probability to extreme events (floods, low water levels).

It should be noted that there are currently about 3500 hydrometric stations in metropolitan France, mainly managed by the Ministry of the Environment and by operators of hydroelectric or irrigation works. More than 80% are teletransmitted in real time. This density (0.63/ 100 km²) is in the average of Western Europe, about the same as that of the United Kingdom, higher than Spain, but lower than Switzerland or Germany.
3. How is the flow of rivers measured?

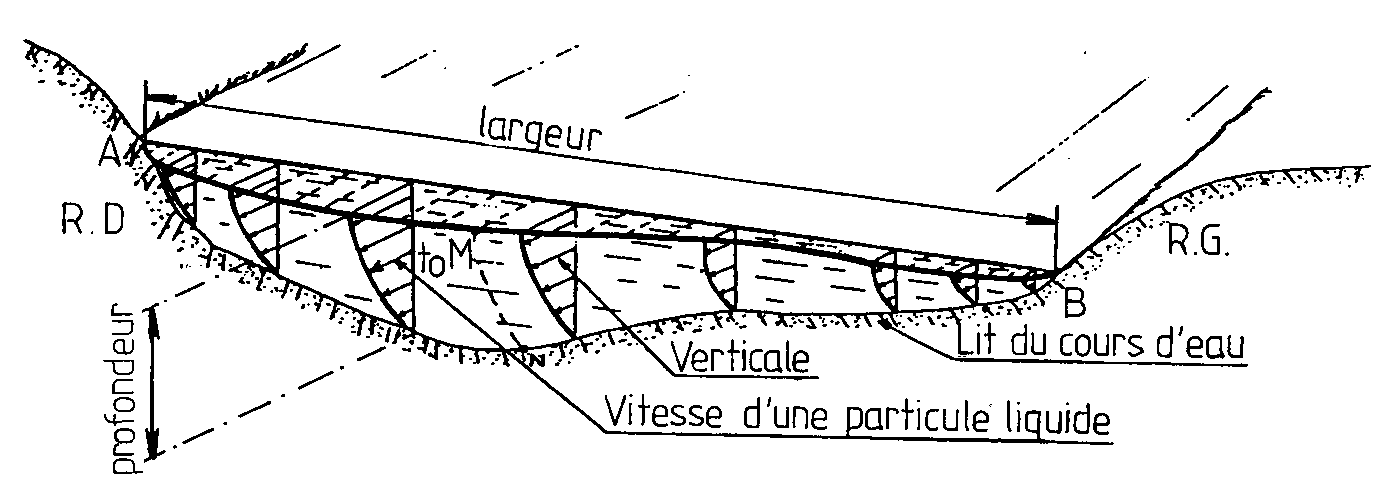
- the continuous measurement of heights upstream of a hydraulic control (see Figure 3), or at another location where a unique height-flow relationship can be established,
- the realization of periodic gauges to build this relationship (calibration curve), allowing to convert the heights into flows,
- the layout of this calibration curve and the detection of its evolutions,
- then, after conversion of heights into flow, critical analysis of spatial and temporal fluctuations, then their archiving.
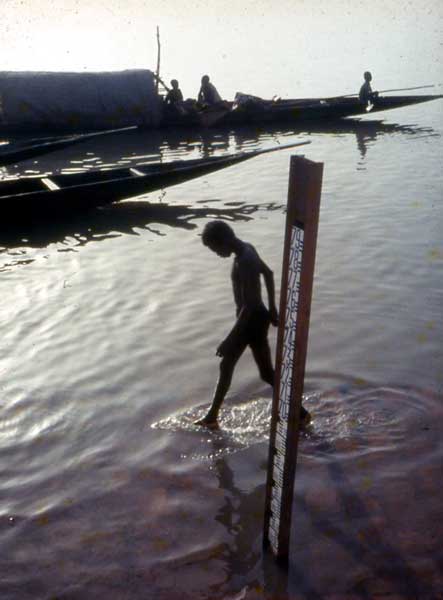
3.1. Continuously measure heights
For a long time, height measurements consisted of visual readings taken daily (or at a shorter frequency) on graduated scales (Figure 4). Over time, the process has become automated by the installation – in addition to these reference scales – of sensors to monitor height variations at a time step adapted to flow fluctuations (very reactive in the case of a small torrential basin; much smoother in a large plain river basin). Several generations of sensors now coexist on the networks: float, pneumatic, piezoresistive, ultra-submerged sound, differential conductivity measurement, etc….
3.2. Calibrate the calibration curve: the gauges
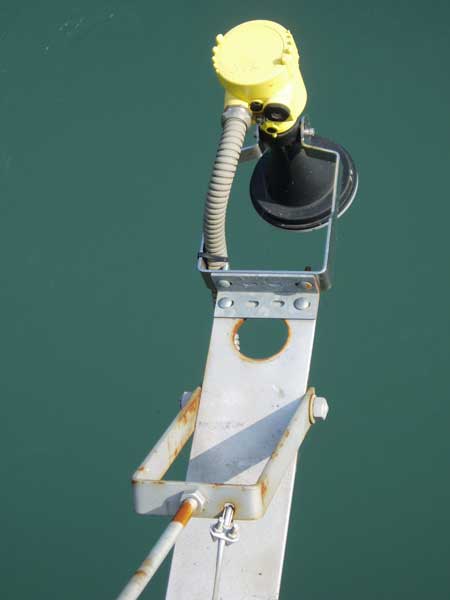
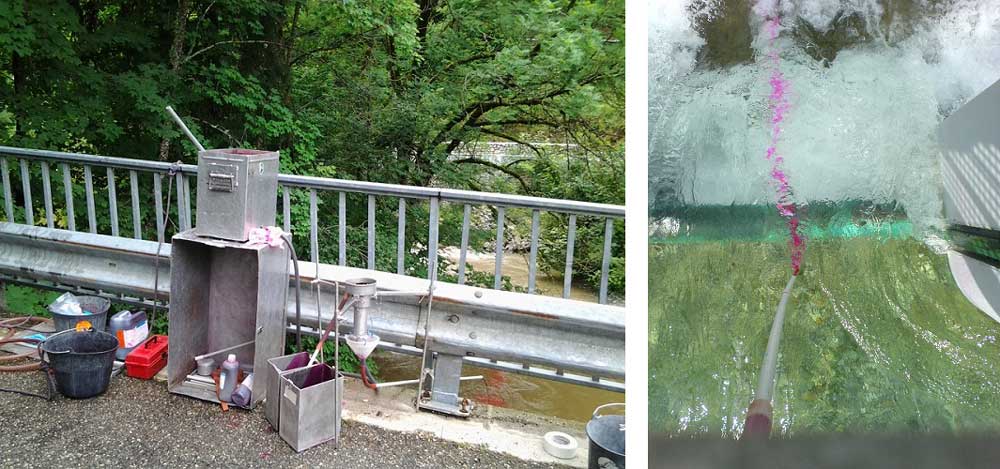
Periodic gauging is carried out on the entire range of flows that the river can reach (in drought, medium water, and floods), mainly by exploring the velocity field or diluting a tracer.
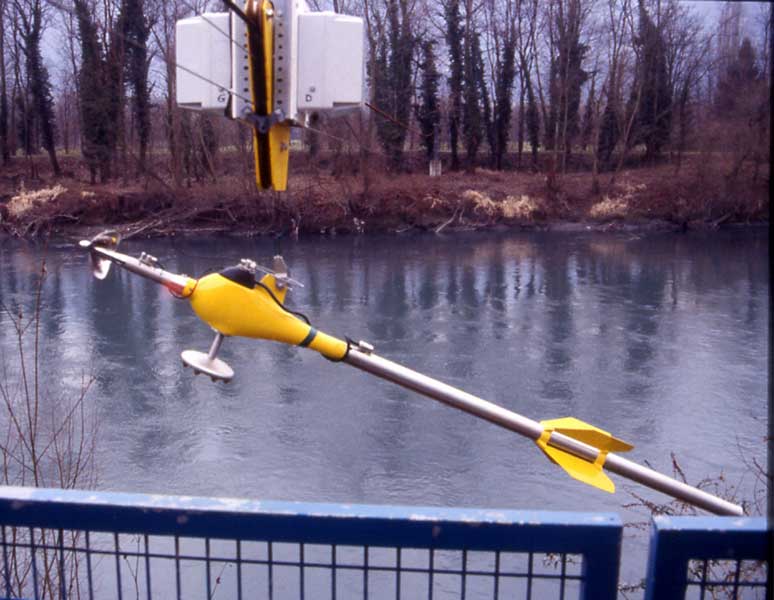
The gauging by exploring the velocity field (Figures 6 and 7) of the flow has long been limited to surface velocities (by means of “floats“, sticks weighted according to the current). More complete maps of the velocity field are now available using speed sensors: mechanical reels (Figure 6) – a propeller rotating in proportion to the local velocity of the current – electromagnetic – the displacement of water producing an induced voltage proportional to the local velocity of the current (Faraday Principle).
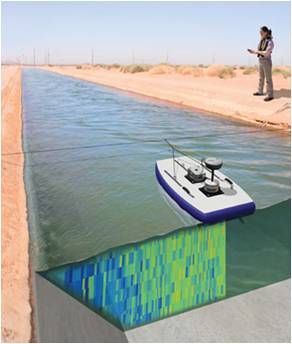
Since the early 1990s, ADCP profilers (Acoustic Doppler Current Profiler: a device from oceanography, based on the Doppler effect) have been a real technological leap forward in hydrometry (Figure 8). They significantly reduce on-site measurement time, especially on large rivers, and are now suitable for small rivers (but a minimum depth of 50 cm is required).
3.3. Linking height and flow: the calibration curve
The most delicate link is the setting curve, the relationship between height and flow (Figure 10). For a long time manually drawn, according to the operators’ expertise alone, the definition of this curve now calls for decision support tools, tools combining statistical approaches, taking into account metrological uncertainties on gauging, hydraulic models.

The state of the art has recently evolved with indwelling devices that allow continuous speed measurement, either on the surface (speed radar) or indwelling in the flow (transit time ultrasound or Doppler effect). The principles of hydrometry are not fundamentally changed: a calibration relationship of height, velocity(s), flow rate remains to be calibrated throughout the operation of the measurement site. These systems were already implemented when a unique relationship between height and flow was not verified (rivers regulated by navigation and/or subject to tide), but current technological developments make it less costly to distribute this type of installation.

New imaging technologies bring a promising innovation: video image processing to determine the field of surface velocities of a river (Figure 11). We use here the displacement of all solid bodies transported on the surface (twigs, bubbles, leaves…) as well as the turbulence of the flow. This technique is derived from the Particle Image Velocimetry (PIV) used in the laboratory, but for a study on large-scale river-type objects, hence its name Large-Scale PIV (LSPIV). This includes:
- recording time-stamped image sequences of the flow,
- a geometric correction of the images to avoid perspective distortions,
- a calculation of the displacement of the flow tracers using a statistical analysis in correlation with the patterns.
Knowing the geometry of the river section and assuming a vertical velocity distribution model, the total flow is estimated from the LSPIV velocity field.
This technique of the future opens the way to a densification of flood measures: the fleeting nature of the episodes, the difficulties of access (flooded roads), the security conditions (violent flows) not allowing the teams to intervene as much as necessary. However, it cannot yet be implemented in case of poor visibility (night, fog).
3.4. Check the consistency of the data
The conversion of heights into flow, the critique of the results, the archiving in the database are the last part of the hydrometry business.
Consistency tests are carried out on the recordings at the station (identification of shifts & sensor drifts, smoothing of the raw signal, filling in gaps over recording failure periods) and by more or less sophisticated hydrological models:
- in coherence with other upstream and downstream measurement sites,
- with reference to historical data already compiled at the measurement site, by comparing it with previous years, looking for explanations based on the measurement of rainfall, known influences (water withdrawals, etc.)
The whole process is iterative, and therefore can lead to questioning the current calibration curve and thus redefine its layout, or even the calibration strategy. Information obtained long after the occurrence of the hydrological event (hydraulic modelling, flood gauging,…) can lead to significant changes in the results published at a station. It is common to allow a period of eighteen months to two years for the consolidation of information.
The quantification of uncertainties in hydrometry has progressed considerably in recent years, but remains an area of investigation for the profession. It is considered that on the best stations (i.e. those where the calibration curve can be followed at a rate of less than 4 or 5 gauges per year), the current flows – encountered 80% of the time – are consolidated to within 5%.
4. What are the current challenges for hydrometry?
Let us keep in mind that hydrometry is a labour-intensive process, which requires travel in the field and is a real craftsman’s task combining metrology, hydraulics and hydrology. As a result, the annual operating cost of a station is often in the order of magnitude of the initial investment cost to create the measurement point. Hydrometry is therefore a long-term task, where budget cuts have a major impact on the quality of the data produced.
Hydrometry is also a complex process, as it affects the natural environment, with all its associated hazards, and where the maturation times of the data can potentially be long. Thus, between information given on the spot (or even used to make a decision) and consolidated data after criticism or discovery of new elements, significant differences may appear (twice as much for an extreme regime value, in flood or drought) several years after their occurrence.
Finally, hydrometry is a process in the making: the availability of new imaging (LSPIV) and communication technologies (telephony, internet) will increase the flow of collected data. Questions will quickly arise about the processing of this information, its criticism and homogenization, its conservation, and the skills that accompany this massification of information. All this is in response to a real social demand for a better knowledge of the environment, a reduction in vulnerability to hazards, in the current context of climate change and the preservation of biodiversity.
The Encyclopedia of the Environment by the Association des Encyclopédies de l'Environnement et de l'Énergie (www.a3e.fr), contractually linked to the University of Grenoble Alpes and Grenoble INP, and sponsored by the French Academy of Sciences.
To cite this article: LALLEMENT Christian (January 5, 2025), Hydrometry: measuring the flow rate of a river, why and how?, Encyclopedia of the Environment, Accessed July 24, 2026 [online ISSN 2555-0950] url : https://www.encyclopedie-environnement.org/en/water/hydrometry-measuring-flow-river-why-how-2/.
The articles in the Encyclopedia of the Environment are made available under the terms of the Creative Commons BY-NC-SA license, which authorizes reproduction subject to: citing the source, not making commercial use of them, sharing identical initial conditions, reproducing at each reuse or distribution the mention of this Creative Commons BY-NC-SA license.