Variation in space and time in sewage sludge composition
PDFTable 1. Variation in space in sewage sludge composition. Analyses of sludge from different sewage treatment plants. Figures expressed in mg/kg of dry matter. Red: particularly high values. Green: particularly low values.
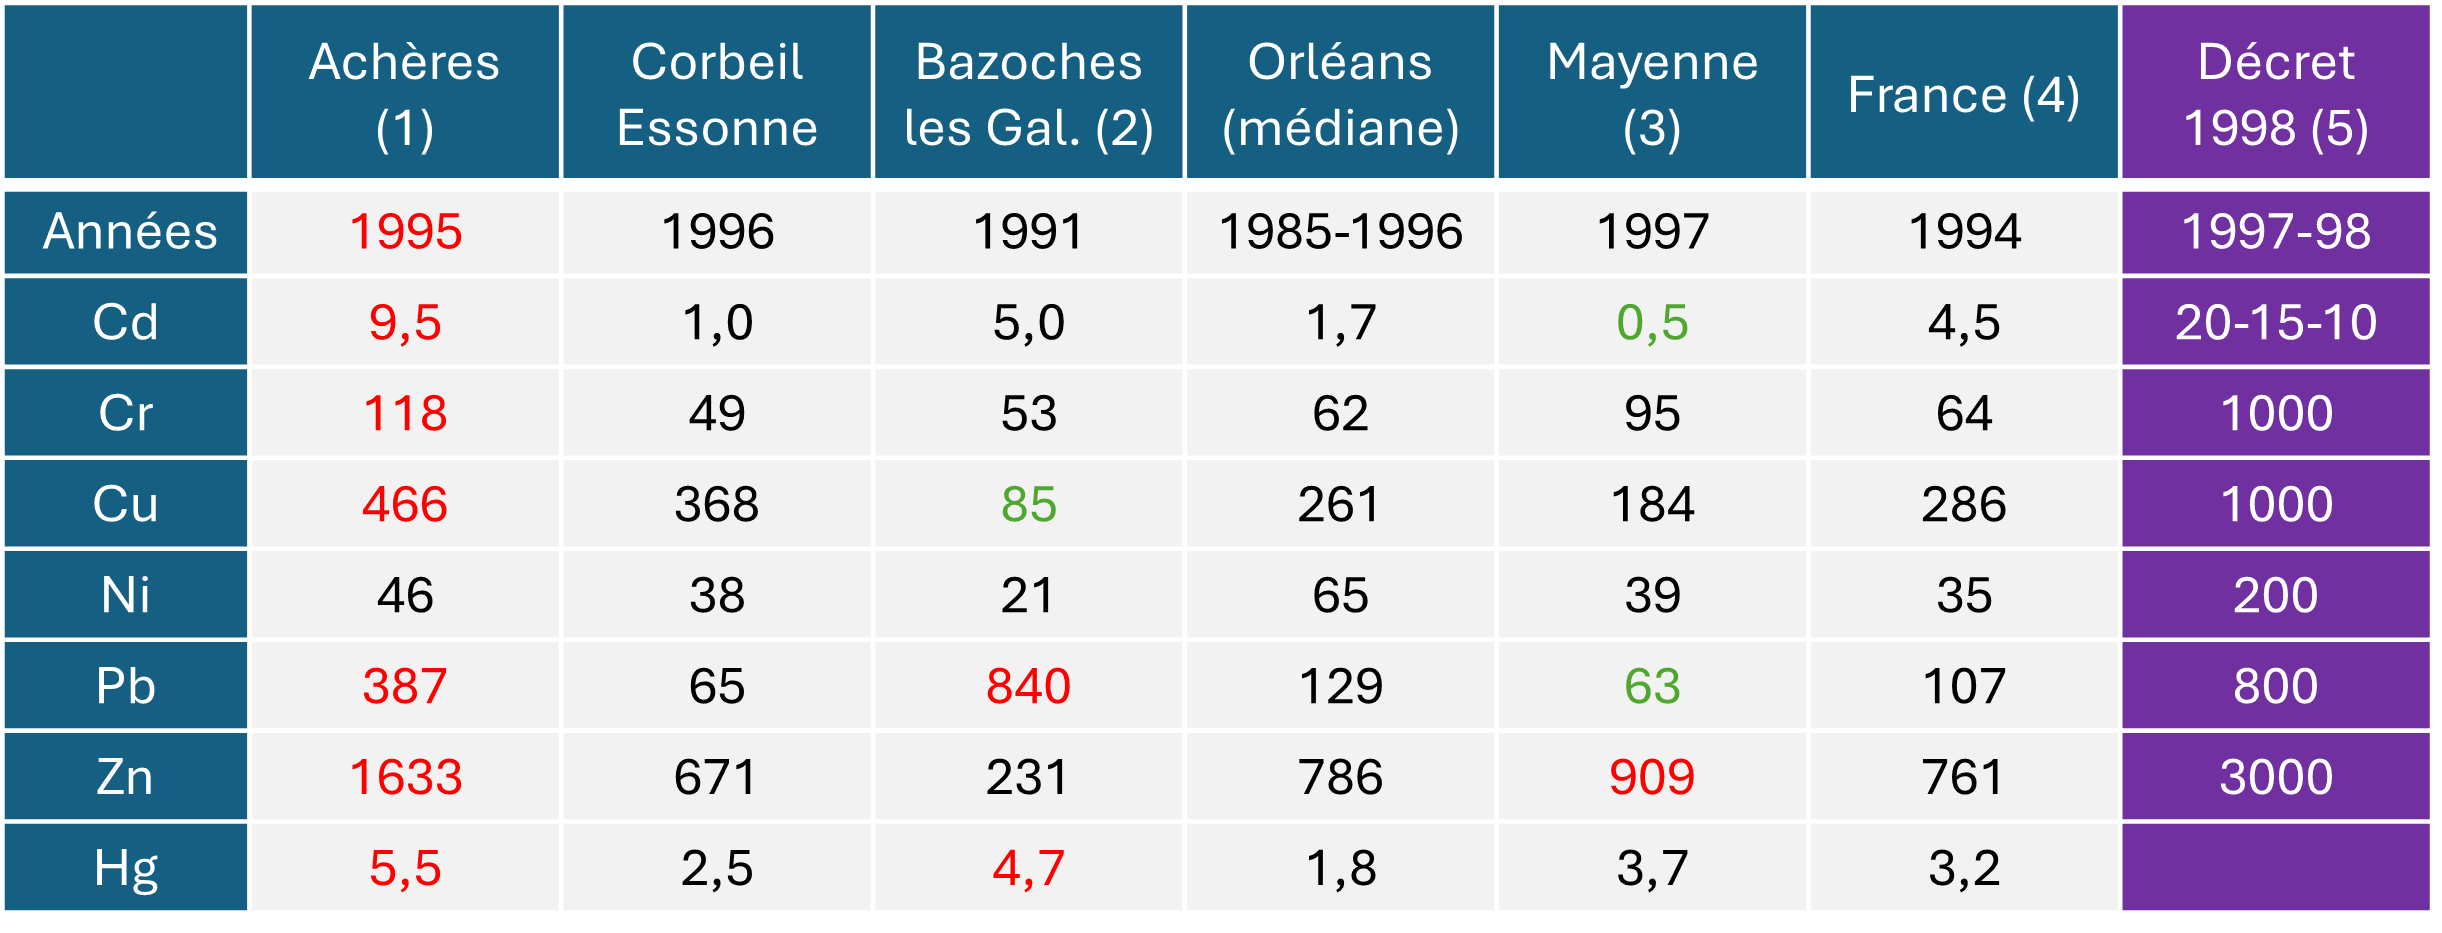
(1) Achères = Seine Aval plant, Paris metropolitan area. (2) Bazoches-les-Gallerandes is a small rural village in Beauce where there is a battery recycling plant. (3) City of Mayenne. (4) Median of 237 predominantly domestic plants in 1994 (source: ADEME). (5) The maximum authorised cadmium content of sludge was rapidly reduced from 20 to 10 mg/kg in just a few years. © Denis Baize
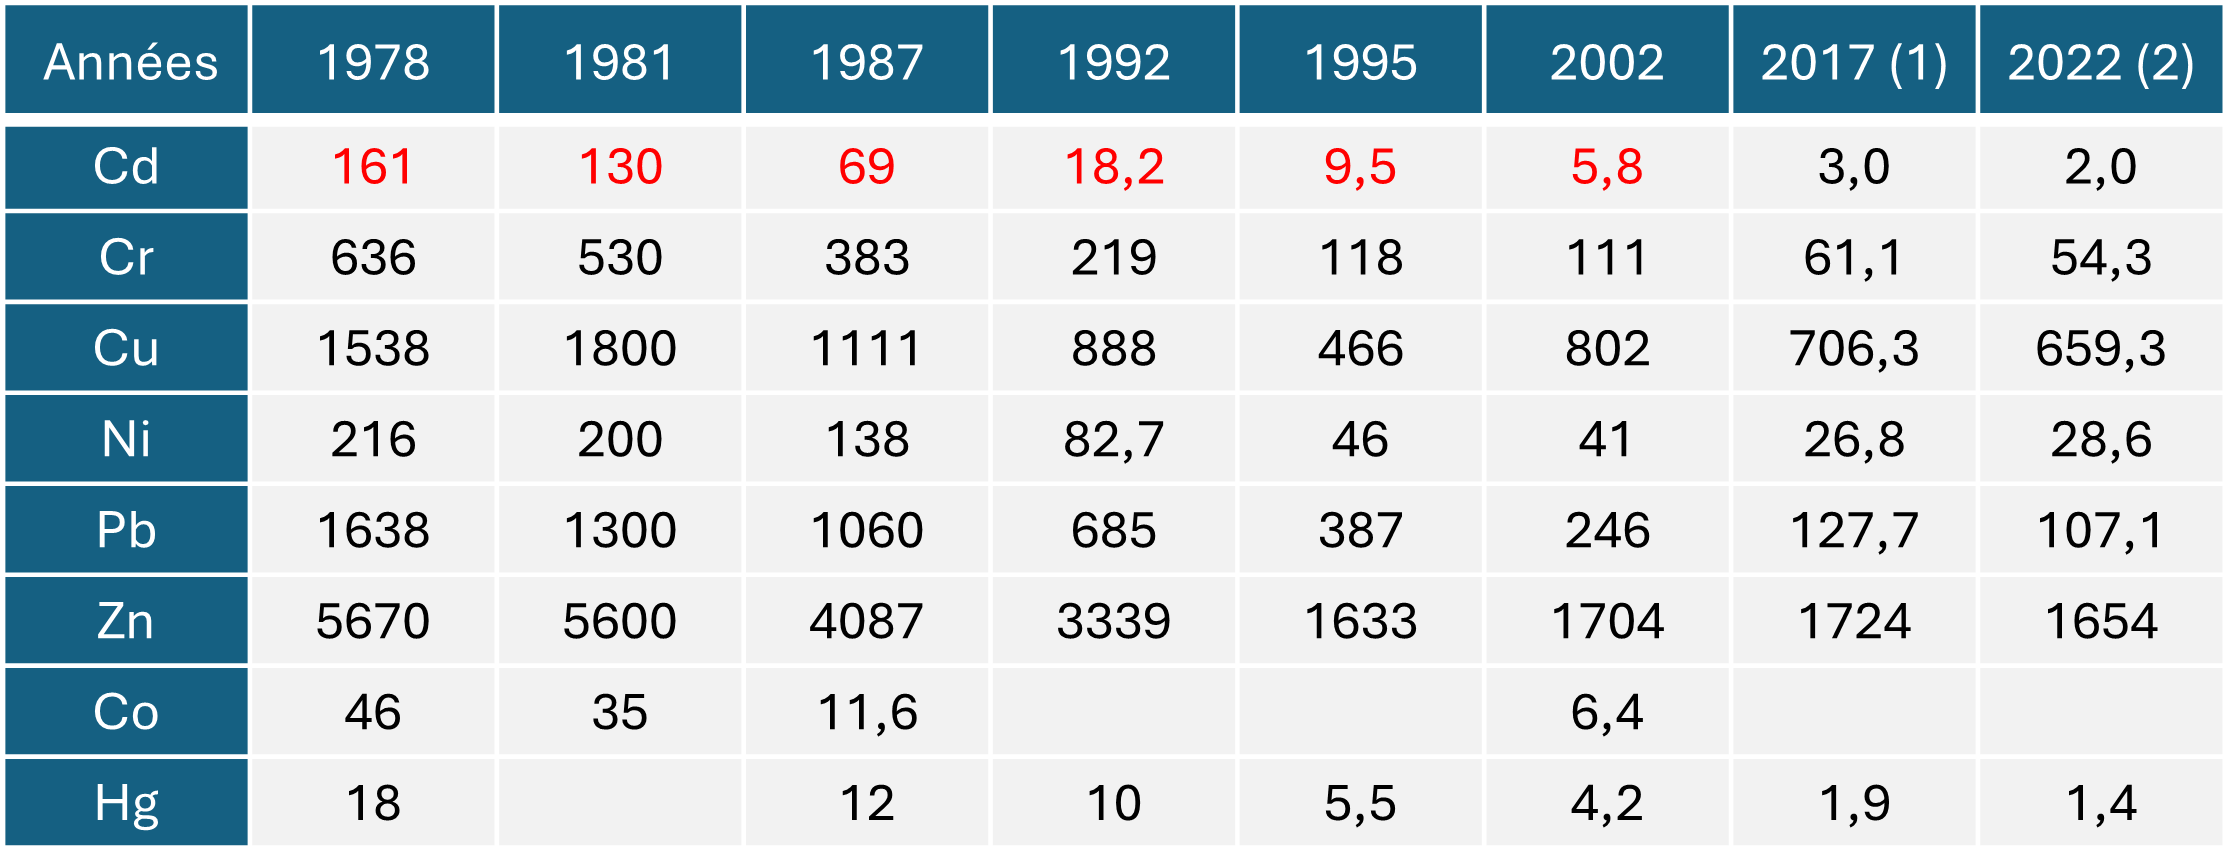
Table 2. Variability over time. Analyses of sludge from the Achères wastewater treatment plant (Seine Aval). Figures expressed in mg/kg of dry matter. (1) Weighted averages of 52 weekly analyses. (2) Content measured weighted by the dry matter tonnage of the corresponding batch. © Denis Baize