Mathematical models can help to better manage fishing
PDF
Fishing provides an important part of the food for people in some developing countries. This can lead to a worrying cascade of overfishing, collapsing catches and rising market prices, and the extinction of many species. How can we prevent this situation from becoming catastrophic and, on the contrary, stabilize it? Mathematical modelling, by coupling ecological and economic dynamics, provides a better understanding of the dynamics of fisheries systems. It is presented here in a basic way and illustrated by the particular case of thiof, an emblematic species threatened in Senegal.
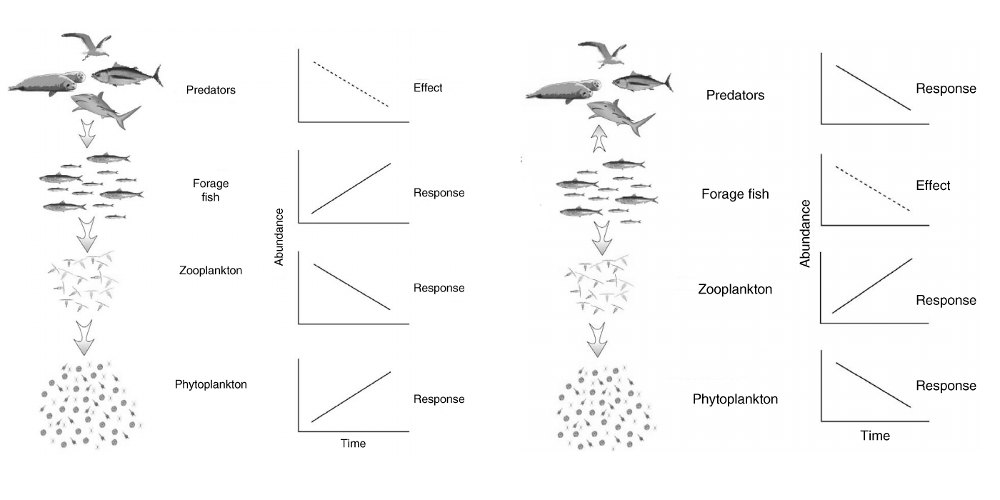
1. Trophic interactions within marine ecosystems


2. Basis of the fishing economy
In theory, the exploitation of a species can lead to its extinction if its price increases faster than the cost of its exploitation when the level of abundance decreases [5], or if its distribution area contracts as a result of exploitation, without a significant increase in cost [6]. In practice, while global extinctions of marine species are rare, their local extinction, or the disappearance of their ecological or economic role, is not [7]. To achieve the ecologically and economically sustainable exploitation of marine resources, the application of fisheries management measures using a multidisciplinary [8] and ecosystem [9] approach is the recommended approach. The spatialization of the marine environment and its uses, including fishing, is a major challenge. In particular, economic zoning, such as exclusive economic zones, and areas dedicated to conservation, such as marine protected areas, must be ecologically coherent.
3. A simple mathematical model of the evolution of the biomass of an exploited species
It is therefore important to understand the mechanisms that govern the dynamics of commercial fisheries. The management of marine resources must be based on decision-making tools that enable managers and decision-makers to take measures for the conservation and optimal exploitation of fisheries. Mathematical modelling makes it possible to develop such tools in order to predict the effects of coastal development and fisheries control measures.
Mathematical models in fisheries are based on assumptions about the production and extinction mechanisms of harvested species.
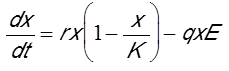
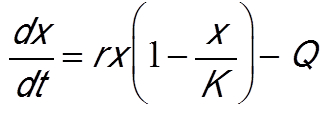
We will now present a classical model with only one variable x(t), the biomass of the exploited species, depending on the time variable t. The left member of the equation is the derivative of biomass as a function of time (dx/dt). It represents the rate of variation of biomass. The right-hand side of the equation has two terms, a biomass production term and an extinction term. The production term represents the growth of the biomass of the fish stock. The extinction term refers to capture by fishing. These two terms involve parameters (r, K, q, E) that are constants. For commercial fish species, it is usual to choose for the production term the logistic growth law that has been tested on many animal species. Parameter r represents the rate of growth of the fish population.
When biomass is very low, logistical growth is exponential. When biomass becomes more important, resulting from intra-specific competition for resources, growth is slowed to reach an equilibrium value K, called carrying capacity, for which production is cancelled, as shown in Figure 6A (curve with E=0).
The carrying capacity therefore represents the equilibrium biomass towards which the stock would tend in the absence of fishing. The second negative term of the second member of the equation below represents the catch by fishing with a catch rate q called “catchability”. It is common in fisheries to assume that the catch is proportional to the product of the biomass of the resource by the fishing effort E. This fishing effort represents the investment in fishing. It is proportional to the number of vessels in the fleet, or it is obtained by calculating the number of hours of fishing at sea. With these assumptions, the model is written:
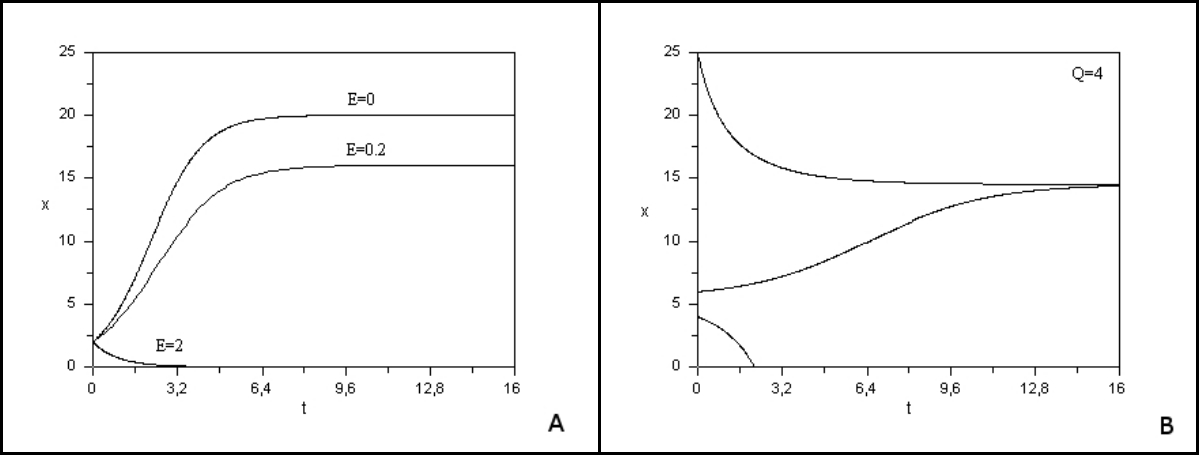
This very simple model, with fishing effort maintained at a constant level, predicts two cases [12]:
- if the fishing effort is too high (qE>r), the resource goes to extinction. In this case, the fishery has a higher harvest rate than the fish reproduction rate, which disappears (Figure 6A with E =2).
- if fishing pressure is moderate (qE<r), the resource will tend in the long term towards a positive biomass equilibrium below the limiting capacity K and which is generally stable (Figure 6A with E = 0.2).
In the event that the resource is maintained despite exploitation, it is also possible to choose a “good” fishing effort to optimize the catch at equilibrium. This optimum corresponds to the Maximum Sustainable Yield (MSY). In our case, the “MSY” is reached when the fishing pressure is chosen equal to half the growth rate of the species being harvested (qE = r/2). An abundant literature exists on this subject, particularly by using optimal control methods [13]. A species is said to be overexploited when fishing effort is maintained at a level above MSY. Biological overfishing occurs when the proportion of spawning fish becomes too low to ensure the renewal of the species and threatens its survival.
Another method of exploitation is to set a fishing quota per unit of time. The previous model, assuming a catch with constant quota represented by parameter Q, becomes [14]:
The study of this model shows that even a low quota can generate an “Allee” effect, i.e. below a threshold, the population quickly goes into extinction. Figure 6B [11] shows the evolution over time of the biomass of the resource under different initial conditions. With an initial condition chosen below a threshold, the population disappears. The great variability of environmental conditions in the marine environment from one year to the next can induce a passage below a threshold and irreparably lead the exploited species to extinction. In the 1970s, whaling was allowed freely, with the effect of causing a very significant drop in its numbers. These mathematical models have alerted decision-makers to the risks of fishing with a fixed quota.
4. Taking economic aspects into account: bio-economic models
It is also crucial to take into account economic aspects in fisheries management models, particularly investment and price variations. The model then includes three variables: the biomass of resource x, the fishing effort E and the price p of the resource on the market [15]. The first equation is the same as the first model presented. The second equation describes the variation in investment. Fishing effort increases if the fishery is profitable and vice versa. Thus, the second equation makes the difference between the net profit of the fishery, corresponding to the catch multiplied by the price, minus the operating costs of the fishery. The c costs per unit of fishing effort result from the purchase of fuel oil, fishermen’s salaries, minimum expected profit and various taxes. The third equation gives the variation in the price of the resource as a result of supply and demand. Supply is represented by instant capture and demand is represented by a monotonous function D(p) decreasing in price. In other words, if the price increases, demand decreases, and vice versa. Under these assumptions, the model is written:
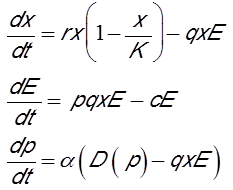
The first two equations correspond to Lotka-Volterra’s predator-prey model [11],[12] where the prey is the fish and the predator the fishing fleet. This classic model provides for two possible cases:
- the extinction of fishing effort when the operating costs of the fishery are high,
- otherwise a stable equilibrium of sustainable fisheries.
In order to obtain overfishing equilibria leading to the extinction of the fish stock, it is necessary to add the third equation with a variable price. The simplest case of demand function is that of a negative slope line whose study has been carried out and predicts the case of fisheries in a state of overexploitation with prices soaring while catches are falling [16].
The choice of a linear demand function is questionable because it implies the existence of a maximum price beyond which no demand exists. However, for some rare species, prices can increase until they reach considerable values. For example, some very rare tunas have been auctioned in Japan for more than $1 million, showing that, even at a very high price, there was residual demand. It is therefore wise to consider the more general case of a positive non-linear demand function for any price, even very high.
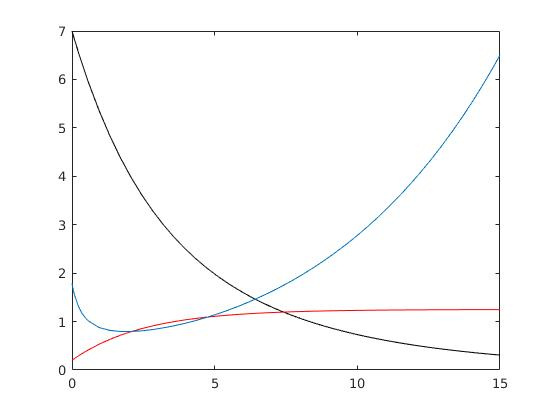
The study of this type of model predicts situations of overfishing with the extinction of the resource while continuing to fish to the last fish, with fishing effort remaining high and a price that is only increasing (Figure 7).
The available data are often partial and incomplete. These mathematical models make it possible above all to predict the qualitative evolution of the fishery, in particular major trends such as the collapse of the stock or its maintenance, the variation in fishing effort, or the soaring or stabilization of prices on the market.

Versions of the bio-economic fishing model with stronger non-linear terms, in particular with a catch term with a fishing saturation effect for a large fish biomass, lead to periodic solutions such as boundary cycles or more complex attractors [18].
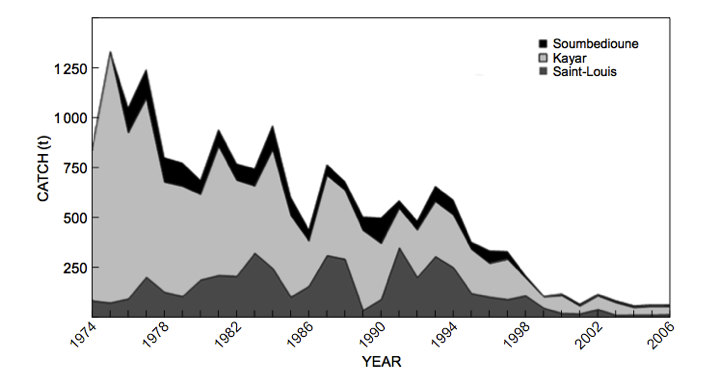
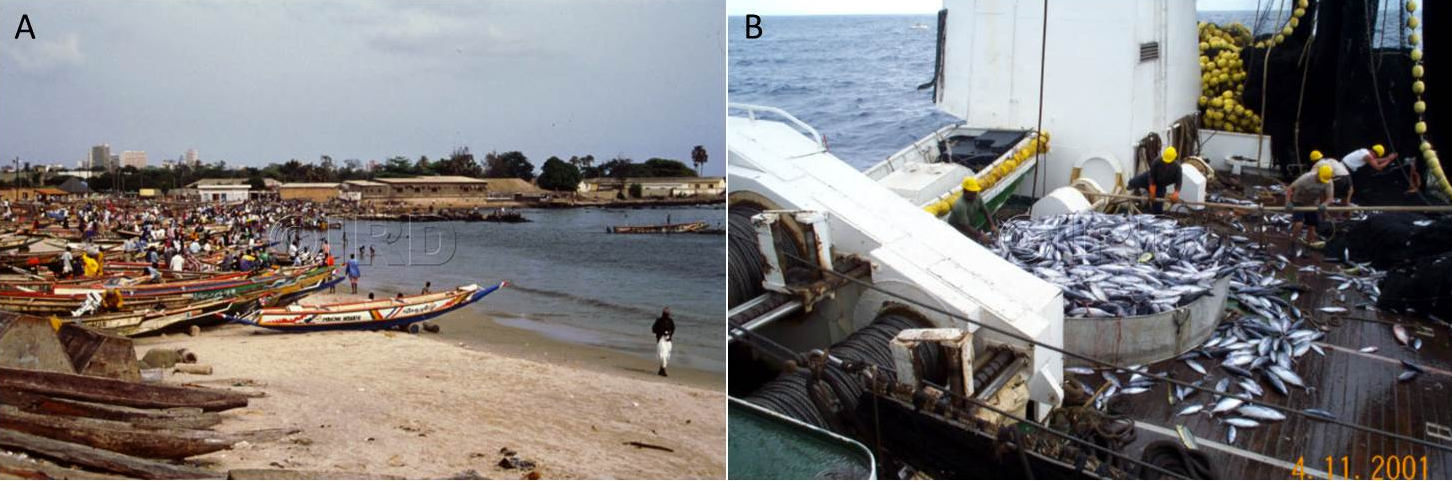
Most recent mathematical models take into account the spatialization of fisheries to allow the control of a multi-site fishery to be studied (Figure 10) [20]. Is it possible to leave an overfishing situation that would eventually lead to the extinction of the overexploited species? A recent study has shown that it is possible to move from a state of overfishing to a state of sustainable fishing without risk of extinction for the species exploited, by varying the number of fishing sites and the operating costs of the fishery [21]. The latter study could explain the change in trend observed for the thiof fishery in West Africa where landings began to increase again after a significant decline, and prices to decline after a period of strong growth. The shift from overfishing to sustainable fishing could therefore result from the decision of Senegalese fishermen to fish for thiof from increasingly distant fishing sites in Mauritania, Gambia, Guinea and Sierra Leone, with increasingly high operating costs.

5. Messages to remember
- Trophic interactions within marine ecosystems depend on the size of individuals.
- An exploitation targeting species according to their size will have cascading effects on all trophic levels of a marine ecosystem.
- Global extinctions of marine species are rare, but their local extinction, or the disappearance of their ecological or economic role, is frequent.
- A large proportion of commercial fish species are overexploited.
- The management of marine resources must be based on decision-making tools that enable managers and decision-makers to take measures for the conservation and optimal exploitation of fisheries.
- Mathematical modelling makes it possible to predict the effects of coastal development and fisheries control measures.
- A fixed quota fishery is more risky than an unconstrained fishery because it can lead to the extinction of the species.
- The coupling of ecological and economic dynamics predicts situations of overfishing causing the extinction of the resource with a high fishing effort remaining and a rising price.
References and notes
Cover image. Fish bank. [Source: Andrepiazza[CC BY-SA 3.0], via Wikimedia Commons]
[1] Cury, P., Miserey, Y., 2008. A sea without fish. Calmann-Lévy.
[2] Cury, P., Shannon, L., Shin, Y.J., 2003. The functioning of marine ecosystems: a fisheries perspective, in: Sinclair, M., Valdimarsson, G. (Eds.), Responsible Fisheries in the Marine Ecosystem. CAB International, Wallingford, UK, pp. 103-123.
[3] Pauly, D., Christensen, V., Dalsgaard, J., Froese, R., Torres, F., 1998. Fishing down marine food webs. Science 279: 860-863.
[4] Jackson, J.B.C., Kirby, M.X., Berger, W.H., Bjorndal, K.A., Botsford, L.W., Bourque, B.J., Bradbury, R.H., Cooke, R., Erlandson, J, Estes, J.A., Hughes, T.P., Kidwell, S., Lange, C.B., Lenihan, H.S., Pandolfi, J.M., Peterson, C.H., Steneck, R.S., Tegner, M.J., Warner, R.R., 2001. Historical overfishing and the recent collapse of coastal ecosystems. Science 293: 629-638.
[5] Courchamp, F., Angulo, E., Rivalan, P., Hall, R.J., Signoret, L., Bull, L., Meinard, Y., 2006. Rarity Value and Species Extinction: The Anthropogenic Allee Effect. PLoS Biol 4, e415.
[6] Burgess, M.G., Costello, C., Fredston-Hermann, A., Pinsky, M.L., Gaines, S.D., Tilman, D., Polasky, S., 2017. Range contraction enables harvesting to extinction. PNAS 20160757551.
[7] McCauley, D.J., Pinsky, M.L., Palumbi, S.R., Estes, J.A., Joyce, F.H., Warner, R.R., 2015. Marine defaunation: Animal loss in the global ocean. Science 347: 1255641.
[8] Degnbol, P., Gislason, H., Hanna, S., Jentoft, S., Raakjær Nielsen, J., Sverdrup-Jensen, S., Clyde Wilson, D., 2006. Painting the floor with a hammer: Technical fixes in fisheries management. Marine Policy 30: 534-543.
[9] Pikitch, E.K., Santora, C., Babcock, E.A., Bakun, A., Bonfil, R., Conover, D.O., Dayton, P., Doukakis, P., Fluharty, D., Heneman, B., Houde, E.D., Link, J., Livingston, P.A., Mangel, M., McAllister, M.K., Pope, J., Sainsbury, K.J., 2004. Ecosystem-based fishery management. Science 305: 346-347.
[10] Thiao, D., Chaboud, C., Samba, A., Laloé, F., Cury, P., 2012 Economic dimension of the collapse of the’false cod’ Epinephelus aeneus in a context of ineffective management of the small-scale fisheries in Senegal. Journal of Marine Science 34(3): 305-311.
[11] Auger, P., Lett, C., Poggiale, J.-C., 2015. Mathematical modelling in ecology, courses and exercises corrected. Dunod, Paris.
[12] Murray, J.D., 1989. Mathematical Biology, Springer-Verlag, Berlin Heidelberg.
[13] Clark, C, 1976. Mathematical bioeconomics: the optimal management of renewable resources, New York, Wiley-Interscience.
[14] Beddington, J.R., May, R.M., 1977. Harvesting natural populations in a randomly fluctuating environment. Science 197: 463-465.
[15] Ly, S., Auger, P., Balde, M., 2014. A bioeconomic model of a multi-site fishery with non linear demand function: Number of sites optimizing the total capture. Acta Biotheoretica 62 (3): 371-384.
[16] Auger, P., Mchich, R., Raïssi, N., Kooi B., 2010. Effects of market price on the dynamics of a spatial fishery model: Over-exploited fishery/traditional fishery. Ecological Complexity 7: 13-20.
[17] Holden, M.H., McDonald-Madden, E., 2017. High prices for rare species can drive large populations extinct: The anthropogenic Allee effect revisited. Journal of Theoretical Biology 429: 170-180.
[18] Bergé, P., Pomeau, Y., Vidal, C., 2004. Order in chaos, Hermann.
[19] Dagorn, L., Holland, K.N., and Itano, D.G. 2007. Behavior of yellowfin (Thunnus albacares) and bigeye (T. obesus) tuna in a network of fish aggregating devices (FADs). Tue. Biol. (Berl.), 151(2): 595-606.
[20] Auger, P., Lett, C., Moussaoui, A., Pioch, S., 2010. Optimal number of sites in artificial pelagic multisite fisheries. Canadian Journal of Fisheries and Aquatic Sciences 67(2): 296-303.
[21] Brochier, T., Bah, A., Thiao, D., Brehmer, P., Auger, P., Ly, S., Nguyen-Huu, T., 2018. Can overexploited fisheries recover by self-organization? Reallocation of fishing effort as an emergent governance. Marine Policy 95: 46-56.
The Encyclopedia of the Environment by the Association des Encyclopédies de l'Environnement et de l'Énergie (www.a3e.fr), contractually linked to the University of Grenoble Alpes and Grenoble INP, and sponsored by the French Academy of Sciences.
To cite this article: AUGER Pierre, LETT Christophe (January 5, 2025), Mathematical models can help to better manage fishing, Encyclopedia of the Environment, Accessed July 24, 2026 [online ISSN 2555-0950] url : https://www.encyclopedie-environnement.org/en/life/mathematical-models-can-help-manage-fishing-2/.
The articles in the Encyclopedia of the Environment are made available under the terms of the Creative Commons BY-NC-SA license, which authorizes reproduction subject to: citing the source, not making commercial use of them, sharing identical initial conditions, reproducing at each reuse or distribution the mention of this Creative Commons BY-NC-SA license.