Mathematical models can help to better manage fishing

PDF
poisson - poissons - banc poissons

Fishing provides an important part of the food for people in some developing countries. This can lead to a worrying cascade of overfishing, collapsing catches and rising market prices, and the extinction of many species. How can we prevent this situation from becoming catastrophic and, on the contrary, stabilize it? Mathematical modelling, by coupling ecological and economic dynamics, provides a better understanding of the dynamics of fisheries systems. It is presented here in a basic way and illustrated by the particular case of thiof, an emblematic species threatened in Senegal.

1. Trophic interactions within marine ecosystems

gravure les grands poissons mangent les petits bruegel l'ancien
Figure 1. Engraving “big fish eat small fish” inspired by Bruegel the Elder. [Source: From Harris Brisbane Dick Fund, 1917, Pieter van der Heyden (ca. 1525-1569). Metropolitan Museum of Arts, New York]
A particularly structuring element of marine ecosystems is that trophic interactions depend on the size of individuals [1]: large fish eat small fish (Figure 1). As a result, an operation targeting large species, or small species, will have different cascading effects on all trophic levels of a marine ecosystem. Broadly speaking, in the first case, the decrease in the abundance of large species, such as tunas, leads to an increase in the abundance of smaller species on which tunas feed, such as sardines. This increase itself leads to the decrease of species on which sardines feed, such as zooplankton, and finally to the increase of zooplankton prey, phytoplankton (Figure 2, left part) [2].

pêche
Figure 2. Schematic representation of the effect of a fishery targeting large (left) or small (right) species, cascading along trophic levels. [Source: Reproduced with permission from Cury et al. 2001, reference [2]]
In the second case where the fishery directly targets sardines, the decrease in their abundance results in both a decrease in tuna and an increase in zooplankton, resulting in a decrease in phytoplankton (Figure 2, right part). In this simplified vision, the strategy would be to exploit species of increasingly smaller size, and therefore trophic level, leading to the phenomenon of “fishing down the food web[3]. In reality, food webs are more complex, but there are many examples corroborating this pattern of exploitation of species high in the food chain that has led to the disruption of the structure and functioning of marine ecosystems (Figure 3) [4].

schema reseau trophique esturarien
Figure 3. Simplified representation of an estuarine food web before (left) and after (right) fishing exploitation. [Source: Reproduced with permission from Jackson et al., 2001, reference [4]]

2. Basis of the fishing economy

In theory, the exploitation of a species can lead to its extinction if its price increases faster than the cost of its exploitation when the level of abundance decreases [5], or if its distribution area contracts as a result of exploitation, without a significant increase in cost [6]. In practice, while global extinctions of marine species are rare, their local extinction, or the disappearance of their ecological or economic role, is not [7]. To achieve the ecologically and economically sustainable exploitation of marine resources, the application of fisheries management measures using a multidisciplinary [8] and ecosystem [9] approach is the recommended approach. The spatialization of the marine environment and its uses, including fishing, is a major challenge. In particular, economic zoning, such as exclusive economic zones, and areas dedicated to conservation, such as marine protected areas, must be ecologically coherent.

evolution captures thiof senegal
Figure 4. Evolution of “thiof” catches in Senegal at different landing ports. [Source: Reproduced with permission of Thiao et al. 2012, reference [10]]
A large part of commercial fish species are overexploited. The main species affected by overfishing are cod in Newfoundland, sardines in California, anchovies in Peru, herring in the North Sea and Epinephelus aeneus, better known as “thiof”, along the Atlantic coast of West Africa. This grouper is called thiof in Senegal, a word borrowed from Lebou and Wolof vocabulary. Thiof was traditionally used in the preparation of the Senegalese national dish, thiep bou dien, composed of fish, various vegetables and rice. Thiof catches only decreased in Senegal until 2006 (CRODT data [10], Figure 4).

peche plage soumbédioune senegal - peche seychelles - peche poissons
Figure 5. A, Artisanal fishing fleet, Soumbédioune beach, Senegal. B, Industrial fishing off Seychelles. [Source: Photos: left: © IRD – Joëlle Vincent; right: © IRD – Jean-Pierre Hallier]
Fishing is essential for the economies of many developing countries. Local commercial species are exploited by artisanal fishing fleets (Figure 5A). Intensive exploitation is also carried out by industrial fishing under fisheries agreements with developing country governments (Figure 5B). Fish are an important source of food for local populations. When catches collapse due to overfishing, market selling prices increase, making it increasingly difficult for the poorest populations to access the resource.

3. A simple mathematical model of the evolution of the biomass of an exploited species

It is therefore important to understand the mechanisms that govern the dynamics of commercial fisheries. The management of marine resources must be based on decision-making tools that enable managers and decision-makers to take measures for the conservation and optimal exploitation of fisheries. Mathematical modelling makes it possible to develop such tools in order to predict the effects of coastal development and fisheries control measures.

Mathematical models in fisheries are based on assumptions about the production and extinction mechanisms of harvested species.

We will now present a classical model with only one variable x(t), the biomass of the exploited species, depending on the time variable t. The left member of the equation is the derivative of biomass as a function of time (dx/dt). It represents the rate of variation of biomass. The right-hand side of the equation has two terms, a biomass production term and an extinction term. The production term represents the growth of the biomass of the fish stock. The extinction term refers to capture by fishing. These two terms involve parameters (r, K, q, E) that are constants. For commercial fish species, it is usual to choose for the production term the logistic growth law that has been tested on many animal species. Parameter r represents the rate of growth of the fish population.

When biomass is very low, logistical growth is exponential. When biomass becomes more important, resulting from intra-specific competition for resources, growth is slowed to reach an equilibrium value K, called carrying capacity, for which production is cancelled, as shown in Figure 6A (curve with E=0).

The carrying capacity therefore represents the equilibrium biomass towards which the stock would tend in the absence of fishing. The second negative term of the second member of the equation below represents the catch by fishing with a catch rate q called “catchability”. It is common in fisheries to assume that the catch is proportional to the product of the biomass of the resource by the fishing effort E. This fishing effort represents the investment in fishing. It is proportional to the number of vessels in the fleet, or it is obtained by calculating the number of hours of fishing at sea. With these assumptions, the model is written:

Figure 6. (A) Evolution over time of fish biomass with a constant fishing effort E, q = 1, r = 0.1 and K = 20. When fishing effort is too high, the resource goes to extinction. Otherwise, it is moving towards a sustainable fishing equilibrium. (B) Evolution over time of fish biomass with a constant fishing quota, Q = 4, r = 1, and K = 20. Fishing with a constant quota generates an “Allee” effect. Below a threshold (here x = 5), the resource goes to extinction in a sustainable finite time. [Source: Reproduced with permission from Auger et al., 2015, reference [11]]
Figure 6A [11] illustrates the results of the model by showing the evolution over time of the total fish biomass for different fishing efforts.

This very simple model, with fishing effort maintained at a constant level, predicts two cases [12]:

  • if the fishing effort is too high (qE>r), the resource goes to extinction. In this case, the fishery has a higher harvest rate than the fish reproduction rate, which disappears (Figure 6A with E =2).
  • if fishing pressure is moderate (qE<r), the resource will tend in the long term towards a positive biomass equilibrium below the limiting capacity K and which is generally stable (Figure 6A with E = 0.2).

In the event that the resource is maintained despite exploitation, it is also possible to choose a “good” fishing effort to optimize the catch at equilibrium. This optimum corresponds to the Maximum Sustainable Yield (MSY). In our case, the “MSY” is reached when the fishing pressure is chosen equal to half the growth rate of the species being harvested (qE = r/2). An abundant literature exists on this subject, particularly by using optimal control methods [13]. A species is said to be overexploited when fishing effort is maintained at a level above MSY. Biological overfishing occurs when the proportion of spawning fish becomes too low to ensure the renewal of the species and threatens its survival.

Another method of exploitation is to set a fishing quota per unit of time. The previous model, assuming a catch with constant quota represented by parameter Q, becomes [14]:

The study of this model shows that even a low quota can generate an “Allee” effect, i.e. below a threshold, the population quickly goes into extinction. Figure 6B [11] shows the evolution over time of the biomass of the resource under different initial conditions. With an initial condition chosen below a threshold, the population disappears. The great variability of environmental conditions in the marine environment from one year to the next can induce a passage below a threshold and irreparably lead the exploited species to extinction. In the 1970s, whaling was allowed freely, with the effect of causing a very significant drop in its numbers. These mathematical models have alerted decision-makers to the risks of fishing with a fixed quota.

4. Taking economic aspects into account: bio-economic models

It is also crucial to take into account economic aspects in fisheries management models, particularly investment and price variations. The model then includes three variables: the biomass of resource x, the fishing effort E and the price p of the resource on the market [15]. The first equation is the same as the first model presented. The second equation describes the variation in investment. Fishing effort increases if the fishery is profitable and vice versa. Thus, the second equation makes the difference between the net profit of the fishery, corresponding to the catch multiplied by the price, minus the operating costs of the fishery. The c costs per unit of fishing effort result from the purchase of fuel oil, fishermen’s salaries, minimum expected profit and various taxes. The third equation gives the variation in the price of the resource as a result of supply and demand. Supply is represented by instant capture and demand is represented by a monotonous function D(p) decreasing in price. In other words, if the price increases, demand decreases, and vice versa. Under these assumptions, the model is written:

The first two equations correspond to Lotka-Volterra’s predator-prey model [11],[12] where the prey is the fish and the predator the fishing fleet. This classic model provides for two possible cases:

  • the extinction of fishing effort when the operating costs of the fishery are high,
  • otherwise a stable equilibrium of sustainable fisheries.

In order to obtain overfishing equilibria leading to the extinction of the fish stock, it is necessary to add the third equation with a variable price. The simplest case of demand function is that of a negative slope line whose study has been carried out and predicts the case of fisheries in a state of overexploitation with prices soaring while catches are falling [16].

The choice of a linear demand function is questionable because it implies the existence of a maximum price beyond which no demand exists. However, for some rare species, prices can increase until they reach considerable values. For example, some very rare tunas have been auctioned in Japan for more than $1 million, showing that, even at a very high price, there was residual demand. It is therefore wise to consider the more general case of a positive non-linear demand function for any price, even very high.

Figure 7. Changes over time in fish biomass (black), fishing effort (red) and price (blue). The resource is going to extinction with fishing remaining at a high level and with a price that only increases with the scarcity of the resource.

The study of this type of model predicts situations of overfishing with the extinction of the resource while continuing to fish to the last fish, with fishing effort remaining high and a price that is only increasing (Figure 7).

The available data are often partial and incomplete. These mathematical models make it possible above all to predict the qualitative evolution of the fishery, in particular major trends such as the collapse of the stock or its maintenance, the variation in fishing effort, or the soaring or stabilization of prices on the market.

evolution prix thiof senegal
Figure 8. Evolution over time of the price of “thiof” (false cod) in Senegal. [Source: Reproduced with permission from Thiao et al (2012), reference [10]]
Figure 8 shows the variation in the price of thiof on the market in Senegal with a significant increase in the price from the 1980s until 2006 in a period when catches collapsed. The previous model is therefore able to “explain” the data for the thiof fishery by predicting the extinction of the species resulting from overfishing with a price that only increases. Other authors had mentioned the possibility of causing the extinction of species that are becoming rare and whose market prices are increasing significantly [17].

Versions of the bio-economic fishing model with stronger non-linear terms, in particular with a catch term with a fishing saturation effect for a large fish biomass, lead to periodic solutions such as boundary cycles or more complex attractors [18].

poissons DCP
Figure 9. Fish concentrated under a Fish Aggregating Device (FAD). [Source: Photo © IRD – Marc Taquet]
In reality, fisheries are active on several fishing sites that are regularly visited by boats. One fishing technique consists in placing floating objects at sea, which exert a significant attraction power for certain pelagic species [19]. These objects are called fFish Aggregating Devices (FADs, Figure 9). Fishermen come to visit them regularly to catch the fish that aggregate there.

Most recent mathematical models take into account the spatialization of fisheries to allow the control of a multi-site fishery to be studied (Figure 10) [20]. Is it possible to leave an overfishing situation that would eventually lead to the extinction of the overexploited species? A recent study has shown that it is possible to move from a state of overfishing to a state of sustainable fishing without risk of extinction for the species exploited, by varying the number of fishing sites and the operating costs of the fishery [21]. The latter study could explain the change in trend observed for the thiof fishery in West Africa where landings began to increase again after a significant decline, and prices to decline after a period of strong growth. The shift from overfishing to sustainable fishing could therefore result from the decision of Senegalese fishermen to fish for thiof from increasingly distant fishing sites in Mauritania, Gambia, Guinea and Sierra Leone, with increasingly high operating costs.

Figure 10. Diagram of a multi-site fishing model. The sites are Fish aggregating Devices (FADs). [Source: Modified from Auger et al (2010), reference [20]]
Many other aspects can be taken into account in bio-economic fisheries models, including the structure of fish in the stage (egg, larva, juvenile, adult) or interactions with other species in the ecosystem. However, the existence of an overfishing equilibrium leading to the extinction of the commercial species and the cessation of fishing is a result that remains robust for a wide range of mathematical and computer models.

5. Messages to remember

  • Trophic interactions within marine ecosystems depend on the size of individuals.
  • An exploitation targeting species according to their size will have cascading effects on all trophic levels of a marine ecosystem.
  • Global extinctions of marine species are rare, but their local extinction, or the disappearance of their ecological or economic role, is frequent.
  • A large proportion of commercial fish species are overexploited.
  • The management of marine resources must be based on decision-making tools that enable managers and decision-makers to take measures for the conservation and optimal exploitation of fisheries.
  • Mathematical modelling makes it possible to predict the effects of coastal development and fisheries control measures.
  • A fixed quota fishery is more risky than an unconstrained fishery because it can lead to the extinction of the species.
  • The coupling of ecological and economic dynamics predicts situations of overfishing causing the extinction of the resource with a high fishing effort remaining and a rising price.


References and notes

Cover image. Fish bank. [Source: Andrepiazza[CC BY-SA 3.0], via Wikimedia Commons]

[1] Cury, P., Miserey, Y., 2008. A sea without fish. Calmann-Lévy.

[2] Cury, P., Shannon, L., Shin, Y.J., 2003. The functioning of marine ecosystems: a fisheries perspective, in: Sinclair, M., Valdimarsson, G. (Eds.), Responsible Fisheries in the Marine Ecosystem. CAB International, Wallingford, UK, pp. 103-123.

[3] Pauly, D., Christensen, V., Dalsgaard, J., Froese, R., Torres, F., 1998. Fishing down marine food webs. Science 279: 860-863.

[4] Jackson, J.B.C., Kirby, M.X., Berger, W.H., Bjorndal, K.A., Botsford, L.W., Bourque, B.J., Bradbury, R.H., Cooke, R., Erlandson, J, Estes, J.A., Hughes, T.P., Kidwell, S., Lange, C.B., Lenihan, H.S., Pandolfi, J.M., Peterson, C.H., Steneck, R.S., Tegner, M.J., Warner, R.R., 2001. Historical overfishing and the recent collapse of coastal ecosystems. Science 293: 629-638.

[5] Courchamp, F., Angulo, E., Rivalan, P., Hall, R.J., Signoret, L., Bull, L., Meinard, Y., 2006. Rarity Value and Species Extinction: The Anthropogenic Allee Effect. PLoS Biol 4, e415.

[6] Burgess, M.G., Costello, C., Fredston-Hermann, A., Pinsky, M.L., Gaines, S.D., Tilman, D., Polasky, S., 2017. Range contraction enables harvesting to extinction. PNAS 20160757551.

[7] McCauley, D.J., Pinsky, M.L., Palumbi, S.R., Estes, J.A., Joyce, F.H., Warner, R.R., 2015. Marine defaunation: Animal loss in the global ocean. Science 347: 1255641.

[8] Degnbol, P., Gislason, H., Hanna, S., Jentoft, S., Raakjær Nielsen, J., Sverdrup-Jensen, S., Clyde Wilson, D., 2006. Painting the floor with a hammer: Technical fixes in fisheries management. Marine Policy 30: 534-543.

[9] Pikitch, E.K., Santora, C., Babcock, E.A., Bakun, A., Bonfil, R., Conover, D.O., Dayton, P., Doukakis, P., Fluharty, D., Heneman, B., Houde, E.D., Link, J., Livingston, P.A., Mangel, M., McAllister, M.K., Pope, J., Sainsbury, K.J., 2004. Ecosystem-based fishery management. Science 305: 346-347.

[10] Thiao, D., Chaboud, C., Samba, A., Laloé, F., Cury, P., 2012 Economic dimension of the collapse of the’false cod’ Epinephelus aeneus in a context of ineffective management of the small-scale fisheries in Senegal. Journal of Marine Science 34(3): 305-311.

[11] Auger, P., Lett, C., Poggiale, J.-C., 2015. Mathematical modelling in ecology, courses and exercises corrected. Dunod, Paris.

[12] Murray, J.D., 1989. Mathematical Biology, Springer-Verlag, Berlin Heidelberg.

[13] Clark, C, 1976. Mathematical bioeconomics: the optimal management of renewable resources, New York, Wiley-Interscience.

[14] Beddington, J.R., May, R.M., 1977. Harvesting natural populations in a randomly fluctuating environment. Science 197: 463-465.

[15] Ly, S., Auger, P., Balde, M., 2014. A bioeconomic model of a multi-site fishery with non linear demand function: Number of sites optimizing the total capture. Acta Biotheoretica 62 (3): 371-384.

[16] Auger, P., Mchich, R., Raïssi, N., Kooi B., 2010. Effects of market price on the dynamics of a spatial fishery model: Over-exploited fishery/traditional fishery. Ecological Complexity 7: 13-20.

[17] Holden, M.H., McDonald-Madden, E., 2017. High prices for rare species can drive large populations extinct: The anthropogenic Allee effect revisited. Journal of Theoretical Biology 429: 170-180.

[18] Bergé, P., Pomeau, Y., Vidal, C., 2004. Order in chaos, Hermann.

[19] Dagorn, L., Holland, K.N., and Itano, D.G. 2007. Behavior of yellowfin (Thunnus albacares) and bigeye (T. obesus) tuna in a network of fish aggregating devices (FADs). Tue. Biol. (Berl.), 151(2): 595-606.

[20] Auger, P., Lett, C., Moussaoui, A., Pioch, S., 2010. Optimal number of sites in artificial pelagic multisite fisheries. Canadian Journal of Fisheries and Aquatic Sciences 67(2): 296-303.

[21] Brochier, T., Bah, A., Thiao, D., Brehmer, P., Auger, P., Ly, S., Nguyen-Huu, T., 2018. Can overexploited fisheries recover by self-organization? Reallocation of fishing effort as an emergent governance. Marine Policy 95: 46-56.


The Encyclopedia of the Environment by the Association des Encyclopédies de l'Environnement et de l'Énergie (www.a3e.fr), contractually linked to the University of Grenoble Alpes and Grenoble INP, and sponsored by the French Academy of Sciences.

To cite this article: AUGER Pierre, LETT Christophe (March 19, 2019), Mathematical models can help to better manage fishing, Encyclopedia of the Environment, Accessed July 27, 2024 [online ISSN 2555-0950] url : https://www.encyclopedie-environnement.org/en/life/mathematical-models-can-help-manage-fishing/.

The articles in the Encyclopedia of the Environment are made available under the terms of the Creative Commons BY-NC-SA license, which authorizes reproduction subject to: citing the source, not making commercial use of them, sharing identical initial conditions, reproducing at each reuse or distribution the mention of this Creative Commons BY-NC-SA license.

数学模型能提升捕鱼管理效率

PDF
poisson - poissons - banc poissons

  在一些发展中国家,渔业是人们重要的食物来源。这可能导致一连串令人担忧的问题:过度捕捞、渔获量下降和、市场价格上涨,以及许多物种灭绝。我们如何防止这种情况演变成灾难性的问题,并使之稳定下来呢?耦合生态和经济动态的数学建模可以更好理解捕鱼行业的动态。本文以塞内加尔(Senegal)濒临灭绝的标志性鱼种青铜石斑鱼(Thiof,一种味道鲜美的鱼)为例,对这类数学模型进行基本介绍和说明。

1. 海洋生态系统内的营养相互作用

环境百科全书-运用数学模型可以更有效地管理捕鱼-图画“大鱼吃小鱼”
图1.图画“大鱼吃小鱼”的灵感来自于老勃鲁盖尔(Elder Bruegel)。[来源:哈里斯布里斯班迪克基金,1917年,彼得·范德海登(Pieter van der Heyden)(约1525-1569年)。大都会艺术博物馆(MMA),纽约]
环境百科全书-运用数学模型可以更有效地管理捕鱼-以大或小物种为目标的渔业效应示意图
图2.以大(左)或小(右)物种为目标的渔业效应示意图,沿营养级级联。[来源:经居里(Cury)等人许可转载,参考[2]]

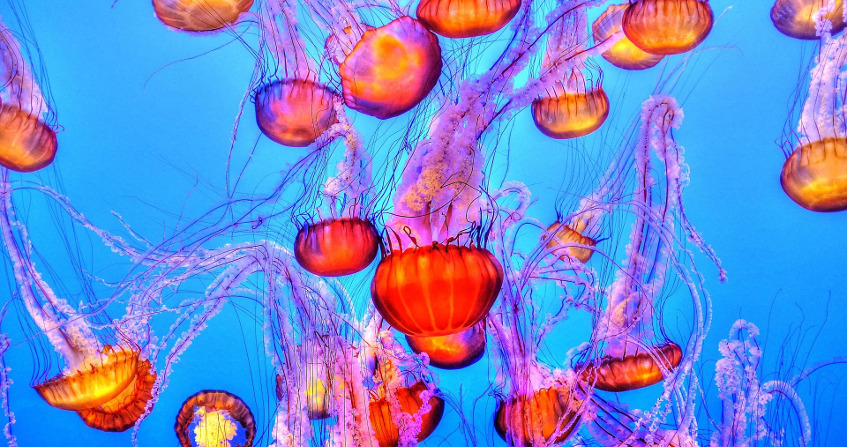
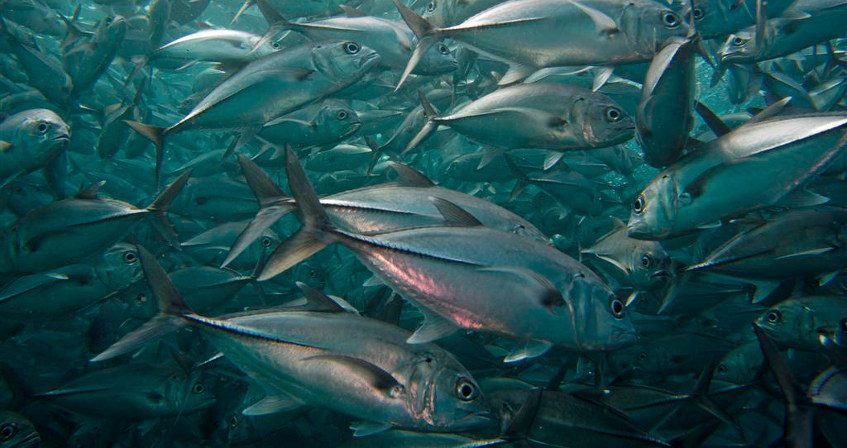
  海洋生态系统的一个特别结构要素是营养相互作用取决于个体大小[1]:大鱼吃小鱼(图1)。因此,针对大型物种或小型物种的行动将对海洋生态系统的所有营养级产生不同的级联效应。广义层面而言,第一种情况下,大型鱼类(如金枪鱼)丰度减少会导致小型鱼类(如沙丁鱼)丰度增加,这些小型鱼类是金枪鱼的食物。小型鱼类增加会导致浮游动物(沙丁鱼的食物)丰度减少,最后导致浮游植物(浮游动物的食物)丰度增加[2](图2,左半部分)。

  第二种情况下,渔业直接以沙丁鱼为目标,沙丁鱼丰度减少导致金枪鱼丰度减少、浮游动物丰度增加,从而导致浮游植物丰度减少(图2,右半部分)。在这种简化视角下,捕捞策略是利用体型越来越小的物种,从而营养级越来越低,造成“捕捞降低食物网”[3]现象。实际上,食物网较此更为复杂,但有许多例子证实了这种模式,即利用食物链中的高级物种,导致海洋生态系统的结构和功能遭到破坏(图3)[4]

环境百科全书-运用数学模型可以更有效地管理捕鱼-河口食物网在捕捞
图3.河口食物网在捕捞前(左)和捕捞后(右)的简化图。[来源:经杰克逊(Jackson)等人许可转载,2001年,参考[4]]
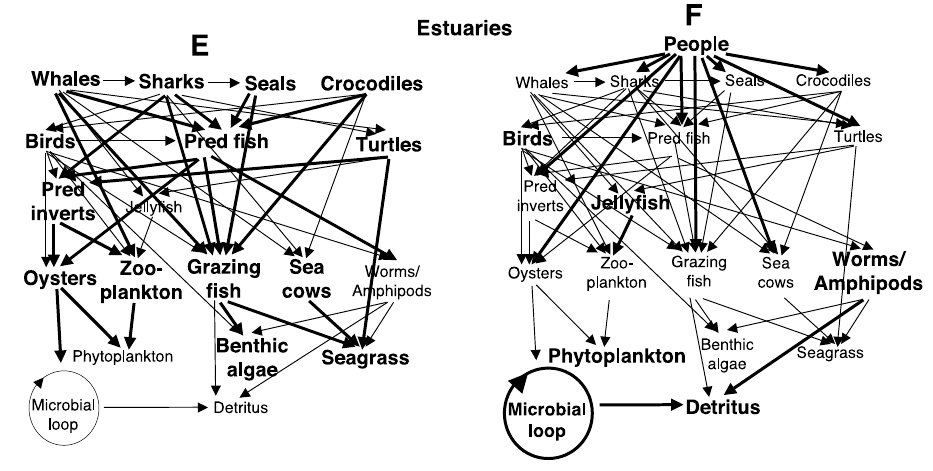
People,人类;Estuaries,河口;Whales,鲸;Sharks,鲨;Seals,海豹;Crocodiles,鳄鱼;Birds,鸟;Pred fish,肉食性鱼类;Turtles,海龟;Pred inverts,捕食者无脊椎动物;Jellyfish,水母;Oysters, 牡蛎;Zooplankton, 浮游动物;Grazing fish,植食性鱼类;Sea cows,海牛;Worms/Amphipods, 蠕虫/端足类;Phytoplankton, 浮游植物;Benthic algae, 底栖藻类;Seagrass, 海草;Microbial loop,微生物环路;Detritus, 碎屑。

2. 渔业经济的基础

  从理论上讲,某一物种丰度降低时,若其价格增速超过开发成本[5],或其分布区因开发而缩小,开发成本却没有显著增加[6],那么对该物种的开发可能致其灭绝。在实践中,虽然海洋物种在全球范围内灭绝很罕见,但其局部灭绝或生态、经济作用的消失却十分普遍[7]。为实现海洋资源生态和经济的可持续开发,建议采用多学科[8]和生态系统[9]方法实施渔业管理。海洋环境及其利用(包括渔业)的空间化是一项重大挑战。特别是,专属经济区等经济区划和海洋保护区等养护区必须在生态上保持一致。

环境百科全书-运用数学模型可以更有效地管理捕鱼-塞内加尔不同港口“青铜石斑鱼”捕获量的演变
图4.塞内加尔不同港口“青铜石斑鱼”捕获量的演变。[来源:经提奥(Thiao)等人许可转载,2012年,参考[10]]

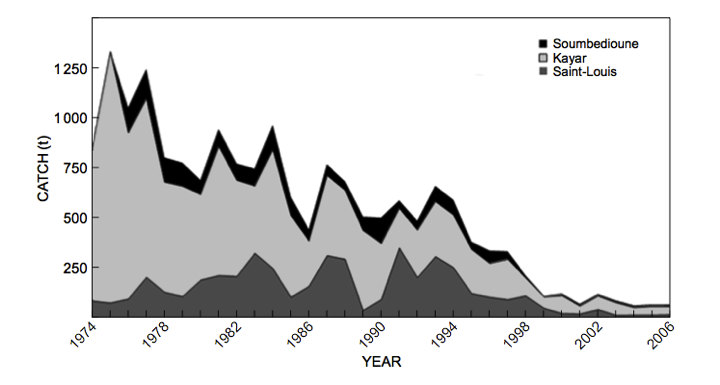
  大部分商业鱼类都遭受过度捕捞。受过度捕捞影响的主要物种有纽芬兰的鳕鱼(cod)、加利福尼亚的沙丁鱼(sardines)、秘鲁的凤尾鱼(anchovies)、北海的鲱鱼(herring)以及沿西非大西洋海岸的青铜石斑鱼(Epinephelus aeneus)(也就是广为人知的“thiof”)。这种石斑鱼在塞内加尔被称为“thiof”,这个词来源于勒布语(Lebou)和沃洛夫语(Wolof)词汇。青铜石斑鱼一般用于制作塞内加尔国菜(thiep bou dien),由鱼、各种蔬菜和米饭组成。直到2006年,塞内加尔的青铜石斑鱼捕获量才有所下降(CRODT数据[10],图4)。
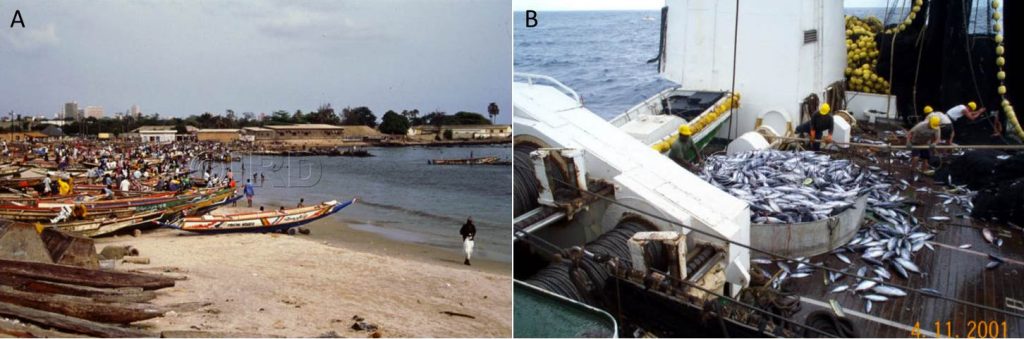
环境百科全书-运用数学模型可以更有效地管理捕鱼-手工渔船
图5.A.手工渔船,苏姆贝迪翁海滩(Soumbédioune beach),塞内加尔。B,机器渔船,塞舌尔。[来源:照片:左:©IRD -乔尔·文森特(Joëlle Vincent);右:©IRD – 让-皮埃尔·哈利尔(Jean-Pierre Hallier)]

  渔业对许多发展中国家的经济至关重要。当地经济物种手工捕鱼船队捕捞(图5A)。根据与发展中国家政府签订的渔业协议,工业捕捞也进行集约开采(图5B)。鱼类是当地居民重要的食物来源。当过度捕捞导致捕获量减少时,市场销售价格就会上涨,使最贫困人口更难获得食物资源。

3. 被开发物种生物量演化的简单数学模型

  因此,了解商业捕鱼的动态机制十分重要。海洋资源管理必须以决策工具为基础,使管理者和决策者能够采取措施保护和优化渔业开发。数学模型有助于开发此类工具,以便预测沿海开发和渔业管制措施的影响

  渔业数学模型的假设基于被捕获物种的产量和灭绝机制。

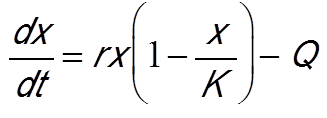
  现在我们将介绍一个经典模型,该模型只有一个变量x(t),即被捕捞物种的生物量,其取决于时间变量t。方程左边是生物量随时间变化的导数(dx/dt)。它代表生物量的变化率。方程右边有两个项,一个是生物量增加项,一个是生物量灭绝项。生物量增加项表示鱼类现存量的增长。灭绝项指捕捞量。这两项涉及的参数(r, K, q, E)都是常数。对于经济鱼类而言,生物量增加项通常选用逻辑斯蒂生长规律,该定律已由许多动物物种验证。参数r表示鱼类种群的生长速率。

  种群生物量很低时,逻辑斯蒂生长呈指数增长。当生物量增加时,由于种内资源竞争,增长速度减慢,达到平衡值K,即环境容量,此时种群生物量不再增加,如图6A (E=0的曲线)所示。

  因此,环境容量代表在没有捕捞的情况下鱼类现存量所趋向的平衡生物量。下式中q*E表示捕获量,捕获率q称为“可捕性”。在渔业中,通常假设捕获量与资源生物量和捕捞努力量E的乘积成正比。捕捞努力量代表捕捞投资。它与船队的船只数量成正比,或者通过计算海上捕鱼的小时数得到。根据这些假设,模型如下:

环境百科全书-运用数学模型可以更有效地管理捕鱼-不同捕捞努力量下总鱼类生物量随时间的演变
图6.(A)在恒定的捕捞努力量E下,鱼类生物量随时间的演化,q=1,r=0.1,K=20。当捕捞努力量过大时,物种就会灭绝。否则,它将朝着可持续的渔业平衡发展。(B)在捕捞配额不变的情况下,鱼类生物量随时间的演化,Q=4,r=1,K=20。以恒定配额捕鱼会产生“Allee”效应。低于阈值(这里x=5),资源将在可持续的有限时间内灭绝。[来源:经Auger等人许可转载,2015,参考[11]]

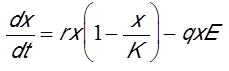
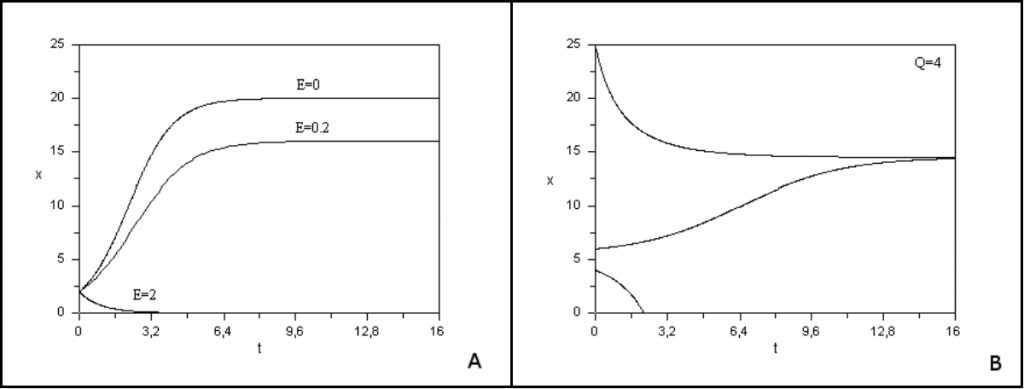
  图6A[11]显示了模型结果,展示了不同捕捞努力量下总鱼类生物量随时间的演变。

  在捕捞努力量保持不变的情况下,这一简单模型预测了两种情况[12]:

  • 如果捕捞力度过大(q*E>r),物种就会灭绝。在这种情况下,渔场收获率高于鱼的繁殖率,鱼类会消失(图6A,E=2)。
  • 如果捕捞压力适中(q*E<r),长期来看,资源趋向于低于环境容纳量K的正生物量平衡,并基本稳定(图6A,E=0.2)

  如果资源在开发时得以维持,可以选择“良好”捕捞努力量来优化捕获量使之达到平衡。这一最适产量对应最大可持续产量(MSY)。在我们的例子中,选择的捕捞压力等于被捕获物种生长速率的一半(q*E=r/2)时,就会达到“最大可持续产量”。已有大量文献说明这一问题,特别是采用最优控制法的文献[13]。捕捞努力量始终大于最高可持续产量时,即为物种过度开发。当产卵鱼的比例过低以致无法确保物种更新,并威胁到物种生存时,就会出现生物过度捕捞。

  另一种捕捞方法是设定单位时间内的捕捞配额。基于之前的模型,假设捕获量为常数配额,由参数Q表示,则模型演变为[14]:

  对该模型的研究表明,即使配额很低也会产生“阿利(Allee)”效应,即低于最小可存活种群数量时,种群很快就会灭绝。图6B显示了不同初始条件下物种生物量随时间的演化[11]。当初始条件低于临界值时,种群就消失了。海洋环境条件每年的巨大变化可能导致初始条件低于阀值,进而促使被开发物种灭绝。20世纪70年代,可以自由捕捞鲸鱼,结果导致鲸鱼数量大幅下降。这些数学模型提醒决策者注意固定配额捕鱼的风险。

4. 考虑经济效益:生物-经济模型

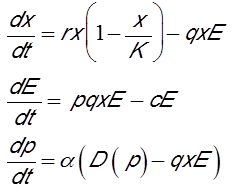
  渔业管理模式中经济效益的考量也很重要,特别是投资和价格变化。模型包含三个变量:资源生物量x,捕捞努力量E和资源市场价格p[15]。第一个方程与第一个模型相同。第二个方程描述了投资变化。如果渔业有利可图,捕捞努力量就会增加,反之亦然。因此,第二个方程是渔业的净利润(对应渔获量乘以价格)减去渔业经营成本的差值。单位捕捞努力量的成本(c)来自购买燃油、渔民工资、最低期望利润和各种赋税。第三个方程给出了供求关系导致的资源价格变化。供给用瞬时捕获表示,需求用价格递减的单调函数D(p) 表示。换句话说,如果价格上涨,需求就会减少,反之亦然。根据上述假设,模型如下:

  前两个方程对应洛特克-沃尔泰勒(Lotka-Volterra)的捕食者-猎物模型[11],[12],其中猎物是鱼,捕食者是捕鱼船队。这个经典模型提供了两种可能情况:

  • 渔业经营成本很高时,捕捞努力量就会消失;
  • 否则就会出现可持续渔业的稳定平衡。

  为得到导致鱼类种群灭绝的过度捕捞公式,有必要加上具有可变价格的第三个方程。最简单的需求函数是负斜率线,已对其进行研究,并预测了渔业处于过度开发状态、价格飙升而渔获量下降的情况[16]

  选择线性需求函数是有问题的,它意味着存在一个最高价格,超过这个价格需求就消失了。然而,对于一些稀有物种,价格会持续上涨,直至达到相当可观的价格。例如,一些非常罕见的金枪鱼在日本的拍卖价格超过了100万美元,这表明,即使价格非常高,仍有剩余需求。因此,明智的做法是考虑更普适的情况,对所有价格(即使是非常高的价格)都设立正向非线性需求函数。

环境百科全书-运用数学模型可以更有效地管理捕鱼-鱼类生物量、捕捞努力量和价格随时间的变化
图7.鱼类生物量(黑色)、捕捞努力量(红色)和价格(蓝色)随时间的变化。随着捕捞量保持在高水平,价格只会随着资源的稀缺性而上升,资源将灭绝。

环境百科全书-运用数学模型可以更有效地管理捕鱼-塞内加尔“青铜石斑鱼”
图8.塞内加尔“青铜石斑鱼”(假鳕鱼,false cod)价格随时间的演变。[来源:经提奥(Thiao)等人许可转载,2012年,参考[10]]
环境百科全书-运用数学模型可以更有效地管理捕鱼-在集鱼装置(FAD)下聚集的鱼
图9.在集鱼装置(FAD)下聚集的鱼。[来源:照片©IRD – 马克·塔奎特(Marc Taquet)]
环境百科全书-运用数学模型可以更有效地管理捕鱼-多站点捕捞模型图
图10.多站点捕捞模型图。这些站点是集鱼装置(FADs)。[来源:修改自奥格(Auger)等人(2010),参考[20]]

  这类模型的相关研究预测了过度捕捞情况,即资源灭绝的同时继续捕捞直至最后一条鱼,捕捞成本不断增高,价格只会增加(图7)。

  现有数据往往不完整。这些数学模型首先可以预测渔业的定性演变,特别是主要变化趋势,例如鱼类种群的崩溃或维持,捕捞努力量的变化或市场价格的飙升或稳定。

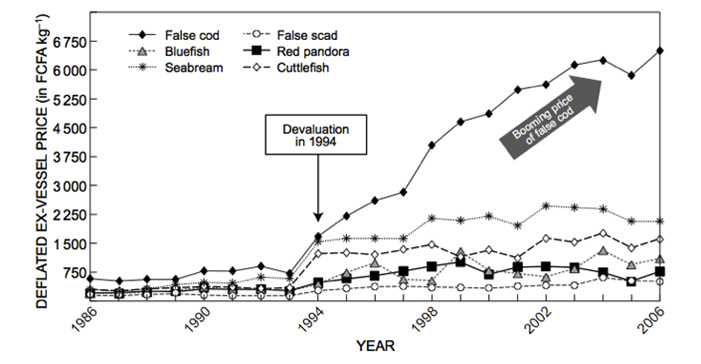
  图8显示了从20世纪80年代到2006年期间,捕获量大幅下降的情况下,塞内加尔市场上青铜石斑鱼的价格变化情况。因此,前一个模型能够预测伴随价格不断增长的过度捕捞导致的物种灭绝,从而“解释”渔业数据。其他作者也提到了导致稀有物种灭绝的可能性,这些物种的市场价格正显著上升[17]

  非线性项更强的生物-经济捕捞模型,特别是具有捕捞饱和效应的大型鱼类生物量的捕捞项,会形成周期变化,如在阈值边界内循环或更复杂的变化[18]

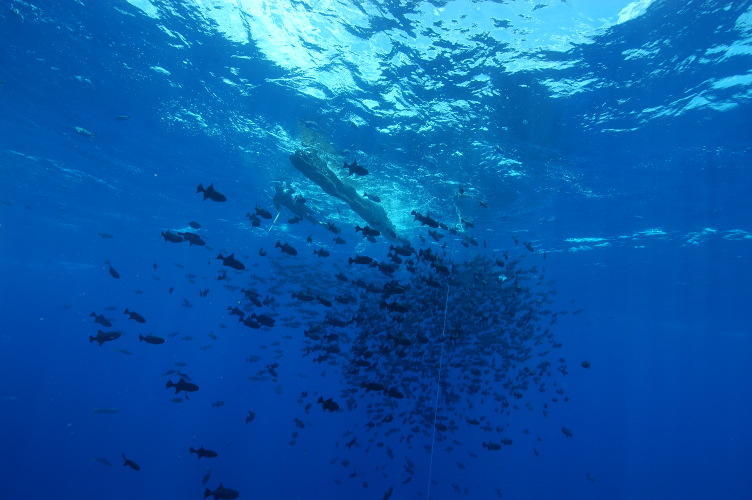
  事实上,渔船经常光顾的一些渔场都有非常先进的捕鱼技术。一种捕鱼技术是在海上放置漂浮物,这对某些远洋物种吸引力显著[19]。这些对象被称为集鱼装置 (FADs,图9)。渔民定期前往这些设备,捕获聚集在此的鱼。

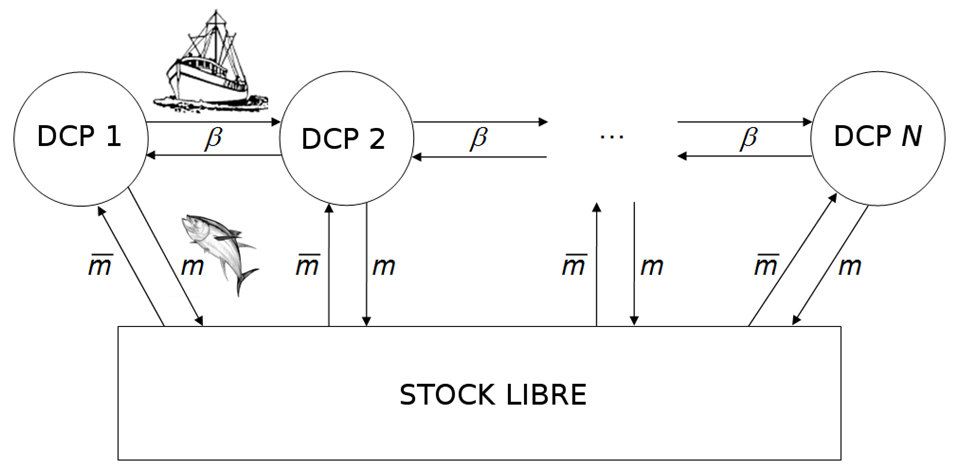
  近年来,大多数学模型都考虑了渔业的空间化,以便研究多地点渔业的控制问题(图10)[20]。多地点捕鱼是否有可能造成过度捕捞,最终导致过度开发、物种灭绝?最近的一项研究表明,改变捕捞地数量和渔业[21]运营成本,开发物种又可能从过度捕捞状态转变为可持续捕捞状态,而不会濒临灭绝[21]。后一项研究可以解释西非渔业趋势的变化,当地捕鱼量在大幅下降后再次增加,价格在一段时期的强劲增长后开始下降。因此,青铜石斑鱼从过度捕捞转向可持续捕捞可能是因为塞内加尔渔民决定在毛里塔尼亚、冈比亚、几内亚和塞拉利昂等遥远的渔场捕鱼,随之而来的是经营成本日益增加。

  生物-经济渔业模型还可以考虑其他许多方面,如不同发育阶段(卵、幼虫、幼鱼、成鱼)鱼类的结构或与生态系统中其他物种的相互作用。然而,过度捕捞平衡的存在会导致经济物种灭绝和捕捞停止,这一结果对各种数学和计算机模型来说仍然可靠。

5. 要点

  • 海洋生态系统内不同营养级间的相互作用取决于个体大小。
  • 根据目标物种大小对其进行开发,将对海洋生态系统各营养级产生级联效应。
  • 海洋物种在全球范围内灭绝的情况极为罕见,但其局部灭绝,或其生态、经济作用的消失非常常见。
  • 很大一部分经济鱼类遭受过度捕捞。
  • 海洋资源管理必须以决策工具为基础,管理人员和决策者能够采取措施养护和优化开发渔业资源。
  • 数学模型可以预测沿海发展和渔业管制措施的影响。
  • 固定配额渔业比不受限渔业的风险更大,因其可能导致物种灭绝。
  • 生态和经济动态的耦合可预测过度捕捞导致的资源灭绝:捕捞努力量持续高走,价格不断上涨。

参考资料及说明

封面照片:鱼类库。[来源:安德雷皮亚扎(Andrepiazza) [CC BY-SA 3.0],通过维基百科]

[1] Cury, P., Miserey, Y., 2008. A sea without fish. Calmann-Lévy.

[2] Cury, P., Shannon, L., Shin, Y.J., 2003. The functioning of marine ecosystems: a fisheries perspective, in: Sinclair, M., Valdimarsson, G. (Eds.), Responsible Fisheries in the Marine Ecosystem. CAB International, Wallingford, UK, pp. 103-123.

[3] Pauly, D., Christensen, V., Dalsgaard, J., Froese, R., Torres, F., 1998. Fishing down marine food webs. Science 279: 860-863.Encyclopédie de l’environnement9/10Généré le 04/10/2021

[4] Jackson, J.B.C., Kirby, M.X., Berger, W.H., Bjorndal, K.A., Botsford, L.W., Bourque, B.J., Bradbury, R.H., Cooke, R.,Erlandson, J, Estes, J.A., Hughes, T.P., Kidwell, S., Lange, C.B., Lenihan, H.S., Pandolfi, J.M., Peterson, C.H., Steneck, R.S.,Tegner, M.J., Warner, R.R., 2001. Historical overfishing and the recent collapse of coastal ecosystems. Science 293: 629-638.

[5] Courchamp, F., Angulo, E., Rivalan, P., Hall, R.J., Signoret, L., Bull, L., Meinard, Y., 2006. Rarity Value and Species Extinction: The Anthropogenic Allee Effect. PLoS Biol 4, e415.

[6] Burgess, M.G., Costello, C., Fredston-Hermann, A., Pinsky, M.L., Gaines, S.D., Tilman, D., Polasky, S., 2017. Range contraction enables harvesting to extinction. PNAS 20160757551.

[7] McCauley, D.J., Pinsky, M.L., Palumbi, S.R., Estes, J.A., Joyce, F.H., Warner, R.R., 2015. Marine defaunation: Animal loss in the global ocean. Science 347: 1255641.

[8] Degnbol, P., Gislason, H., Hanna, S., Jentoft, S., Raakjær Nielsen, J., Sverdrup-Jensen, S., Clyde Wilson, D., 2006. Painting the floor with a hammer: Technical fixes in fisheries management. Marine Policy 30: 534-543.

[9] Pikitch, E.K., Santora, C., Babcock, E.A., Bakun, A., Bonfil, R., Conover, D.O., Dayton, P., Doukakis, P., Fluharty, D.,Heneman, B., Houde, E.D., Link, J., Livingston, P.A., Mangel, M., McAllister, M.K., Pope, J., Sainsbury, K.J., 2004.Ecosystem-based fishery management. Science 305: 346-347.

[10] Thiao, D., Chaboud, C., Samba, A., Laloé, F., Cury, P., 2012 Economic dimension of the collapse of the’false cod’ Epinephelus aeneus in a context of ineffective management of the small-scale fisheries in Senegal. Journal of Marine Science 34(3): 305-311.

[11] Auger, P., Lett, C., Poggiale, J.-C., 2015. Mathematical modelling in ecology, courses and exercises corrected. Dunod, Paris.

[12] Murray, J.D., 1989. Mathematical Biology, Springer-Verlag, Berlin Heidelberg.

[13] Clark, C, 1976. Mathematical bioeconomics: the optimal management of renewable resources, New York, Wiley-Interscience.

[14] Beddington, J.R., May, R.M., 1977. Harvesting natural populations in a randomly fluctuating environment. Science 197:463-465.

[15] Ly, S., Auger, P., Balde, M., 2014. A bioeconomic model of a multi-site fishery with non linear demand function: Number of sites optimizing the total capture. Acta Biotheoretica 62 (3): 371-384.

[16] Auger, P., Mchich, R., Raïssi, N., Kooi B., 2010. Effects of market price on the dynamics of a spatial fishery model:Over-exploited fishery/traditional fishery. Ecological Complexity 7: 13-20.

[17] Holden, M.H., McDonald-Madden, E., 2017. High prices for rare species can drive large populations extinct: The anthropogenic Allee effect revisited. Journal of Theoretical Biology 429: 170-180.

[18] Bergé, P., Pomeau, Y., Vidal, C., 2004. Order in chaos, Hermann.

[19] Dagorn, L., Holland, K.N., and Itano, D.G. 2007. Behavior of yellowfin (Thunnus albacares) and bigeye (T. obesus) tuna in a network of fish aggregating devices (FADs). Tue. Biol. (Berl.), 151(2): 595-606.

[20] Auger, P., Lett, C., Moussaoui, A., Pioch, S., 2010. Optimal number of sites in artificial pelagic multisite fisheries. Canadian Journal of Fisheries and Aquatic Sciences 67(2): 296-303.

[21] Brochier, T., Bah, A., Thiao, D., Brehmer, P., Auger, P., Ly, S., Nguyen-Huu, T., 2018. Can overexploited fisheries recover by self-organization? Reallocation of fishing effort as an emergent governance. Marine Policy 95: 46-56


The Encyclopedia of the Environment by the Association des Encyclopédies de l'Environnement et de l'Énergie (www.a3e.fr), contractually linked to the University of Grenoble Alpes and Grenoble INP, and sponsored by the French Academy of Sciences.

To cite this article: AUGER Pierre, LETT Christophe (February 23, 2024), 数学模型能提升捕鱼管理效率, Encyclopedia of the Environment, Accessed July 27, 2024 [online ISSN 2555-0950] url : https://www.encyclopedie-environnement.org/zh/vivant-zh/mathematical-models-can-help-manage-fishing/.

The articles in the Encyclopedia of the Environment are made available under the terms of the Creative Commons BY-NC-SA license, which authorizes reproduction subject to: citing the source, not making commercial use of them, sharing identical initial conditions, reproducing at each reuse or distribution the mention of this Creative Commons BY-NC-SA license.