Error calculation
PDF
Urbanization effects are partly corrected in the reconstructions using different methods such as deleting observations most affected by urbanization or correcting urban station data with data from neighbouring rural stations [1]. After these corrections, the residual errors must be taken into account in the uncertainties on the reconstructed temperatures. They have, however, only a limited impact on the trend of the annual mean temperature for all continents since the warming over the whole 20th century according to the British reconstruction is, for example, less than 0.06°C, i.e. a much smaller order of magnitude than the trend itself [2].
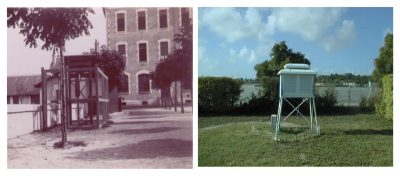
The Figure illustrates the breaks in the homogeneity of the series with photographs from the La Rochelle weather station used in 1910 and the 1998 station equipped with a shelter meeting internationally defined standards. The data series used in the reconstructions must first be analysed to detect these breaks in homogeneity, for example by comparing pairs of geographically neighbouring observation series. These breaks must then be corrected, again using the proximity of stations whose observations are spatially correlated. But, however precise these corrections may be, residual errors, such as the non-detection of certain breaks of at most a few tenths of a degree, contribute to increasing the uncertainties on temperature reconstructions and must therefore be taken into account in their evaluation.
Marine data are also subject to bias corrections in particular due to :
- the recent increase in the number of observations per buoy combined with a decrease in the number of observations per vessel leading to a decrease in the estimated temperature trend.
- the use of temperature measurements by taking water from a more or less thermally insulated bucket, compared to the more modern method of measuring the temperature at the inlet of water intakes used to cool boat engines.
The coexistence of these different measurement methods during certain periods, such as during or just after the Second World War, sometimes makes it difficult to assess the necessary corrections [3]. The effect of these biases on trends is highly dependent on the period of analysis and the inclusion of uncorrected effects in uncertainty estimates remains a necessity.
The total uncertainty in the annual mean global temperature is calculated by combining all the uncertainties mentioned so far, both for the ocean and the continent. Increasingly complete and accurate models for calculating uncertainties are therefore being developed [4]. These models are subject to constant improvement, such as the recent inclusion of measurement error correlations from the same boats or buoys. A recent development also consists in building large sets of temperature reconstructions (100 or even 1000 members) by varying the parameters used to calculate the averages and to correct errors in the observed data (urbanization, homogenization, bias in marine data,…).
The results of the total error calculations by the different error models are as follows:
- for the British reconstruction, the total error decreases from about 0.22°C in the 1850s through 0.15°C in the 1880s to 0.10°C in the 2000s;
- for the NOAA reconstruction, it decreases from about 0.15°C in the 1880s to about 0.05°C in the 2000s;
- for NASA’s |7], it decreases from about 0.14°C in the 1880s to 0.08°C in the 2000s;
- for the three reconstructions, the total uncertainties increase by 1 to 2 tenths of a degree during the periods of the two world conflicts.
Notes and References
Cover sticker. [Source: Météo-France]
[1] Wickham, C, Rohde, R., Muller, R. A., Wurtele, J., Curry, J., Groom, D., Jacobsen, R., Perlmutter, S., Rosenfeld, A., Mosher, S. (2014) Influence of urban heating on the global temperature land average using rural sites identified from MODIS classifications. Geoinformatics & Geostatistics: An Overview, 1:2, 2-6.
[2] Jones, P. D., New, M., Parker, D. E., Martin, S., Rigor, I.G. (1999) Surface temperature and its changes over the past 150 years. Review of Geophysics, 32, (2), 173-199.
[3] Kennedy, J. J., Rayner, N. A., Smith, R. O., Parker, D. E., Saunby, M. (2011) Reassessing biases and other uncertainties in sea surface temperature observations measured in situ since 1850: 2. Biases and homogenization. Journal of Geophysical Research, 116, D14104. DOI: 10.1029/2010JD015220.
[4] Brohan, P., Kennedy, J. J., Harris, I., Tett, S. F. B., Jones, P. D. (2006) Uncertainty estimates in regional and global observed temperature changes: A new data set from 1850. Journal of Geophysical Research, 111, D12106. DOI: 10.1029/2005JD006548.


