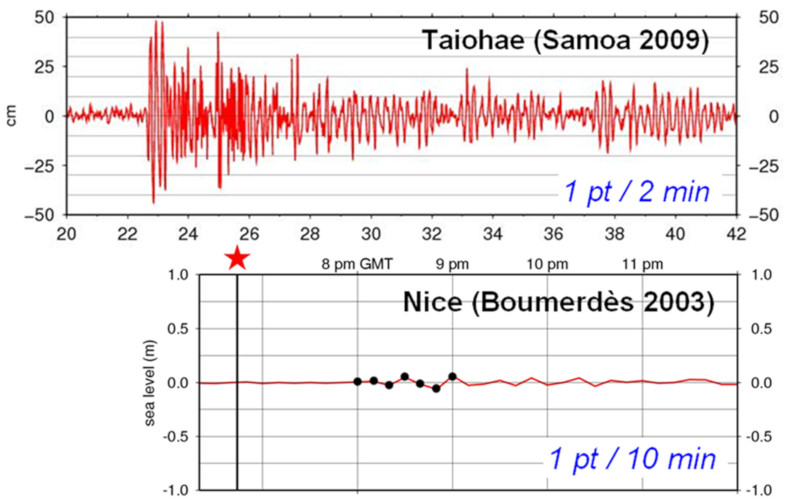
Historically recorded on rolls of paper, the devices moved to digital recordings at the end of the 20th century. Time sampling to record tides with periods of about 12 hours was, however, often insufficient to record tsunami waves of small period. In the Pacific, the devices installed before 2004 for tsunami measurements were already capable of correctly reproducing the tsunami waveform (see figure below).
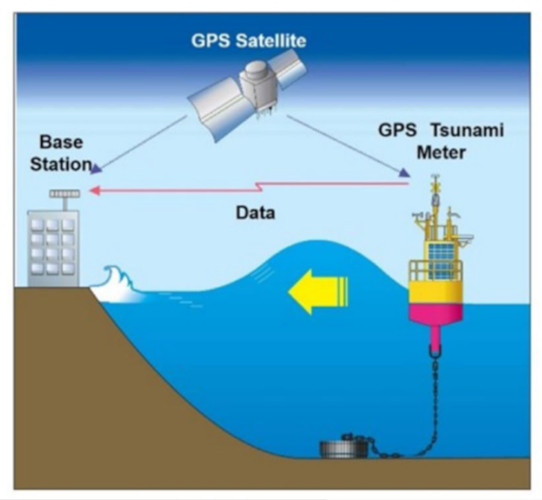
Figure 2. Schematic diagram of sea level measurement using GPS buoys [Source: https://www.hitachizosen.co.jp/english/products/products029.html]GPS sensors deployed on buoys near the coasts also allow the measurement of tsunami heights at the time of its amplification. Japan has equipped its coasts since the 1990s. These buoys (see below), whose data have been analysed in real time since the end of the 2000s, made it possible to increase the warning level in 2011.
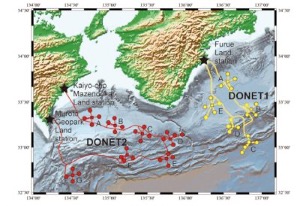
Pressure sensors deployed on the ocean floor were invented by the Americans in the 1980s (DART buoys, Deep ocean Assessment and Reporting of Tsunamis) could rapidly measuring a tsunami wavepropagation, with centimetric resolution, and sending the data via satellite via a buoy. Such sensors are also deployed on multi-instrument submarine cables, for example off the coast of Japan (below).
Figure 3. Deployment of multi-instrument submarine cables off Japan. These data are now analysed in real time. [Source: https://www.jamstec.go.jp/donet/e/donet/donet2.html]Finally, satellite data can be used to hazard map areas (optical, radar) and, rarely, give an indication of the water height at sea (altimetry). The analysis of the variation of the total electronic content of the ionosphere (by GNSS sensors or satellites) can also show the coupled tsunami propagation in the upper layers of the atmosphere, as for earthquakes.