



Species, individuals and biomass
PDFWhich organisms dominate the planet? The answer depends on the quantity considered. Animals account for most described species – around 1.5 million of the approximately 1.5 to 2 million eukaryotic species recorded. Some microorganisms and small animals number more than 1020 individuals (one hundred quintillion), while prokaryotic cells are thought to number around 1030 (1 followed by 30 zeros). Plants, meanwhile, contain about 80% of the 550 gigatonnes of carbon in global biomass. Species richness, abundance and biomass therefore describe different but complementary dimensions of life.
1. Species, individuals and biomass: what do we measure?
Three quantities are commonly used to compare the major groups of living organisms:
- Species richness is the number of species, either described or estimated, depending on the study.
- Abundance is the number of individuals, where these can be clearly distinguished.
- Biomass is the quantity of living matter present at a given time.
The fresh mass of organisms depends heavily on their water content. On a global scale, biomass is therefore expressed as the mass of carbon contained in organisms, in gigatonnes of carbon (Gt C). One Gt C is one billion tonnes of carbon, equivalent to approximately two billion tonnes of dry matter [1].
Individual mass varies by more than twenty orders of magnitude among organisms, from about 10-13 g for a bacterium to several tens of tonnes for a large tree [2]. A group may contain a great many species, or countless tiny individuals, while accounting for little biomass, and vice versa.
Biomass is a stock measured at a given time and should not be confused with biological production, which is a flow. Phytoplankton biomass may turn over within a few days, whereas carbon in wood may remain stored for decades or centuries.
Species richness is one of the most widely used indicators of biodiversity, but biodiversity also encompasses genetic and ecosystem diversity. Abundance and biomass complement this description of life, but neither is in itself a measure of biodiversity (see What is biodiversity?).
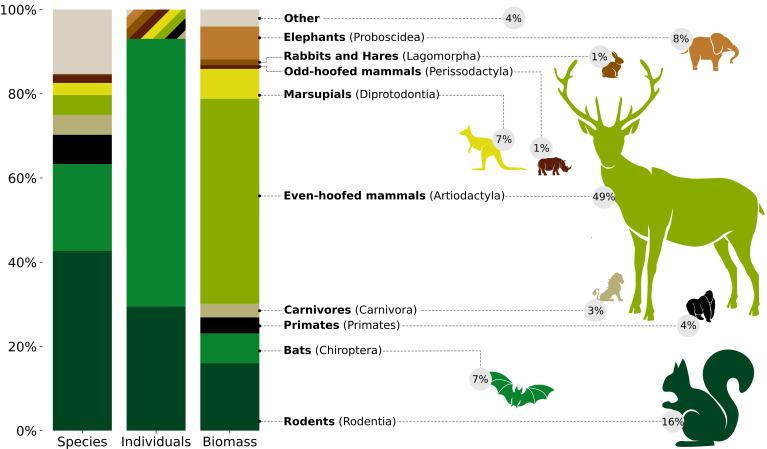
The distinction between species richness, abundance and biomass can be seen even within a single group. Among wild terrestrial mammals, the relative contribution of each order changes markedly according to the indicator used (Figure 1) [3]. Rodents and bats account for a large proportion of species and individuals, whereas artiodactyls – deer, antelopes and wild boar – alone represent nearly half the biomass. Elephants contribute about 8% of this biomass despite their small number of species and individuals [3].
2. Plants dominate biomass, animals dominate described diversity
Plants account for about 80% of global biomass, or 450 Gt C out of a total of 550 Gt C [2]. This predominance is due almost entirely to terrestrial vascular plants – and, among them, to trees. Although algae and bryophytes comprise tens of thousands of species, they make only a marginal contribution. Yet with about 374,000 described and accepted plant species, including nearly 308,000 vascular plants [4], this is not the most diverse group.
Animals are much more diverse: nearly 1.5 million species have been described, dominated by arthropods (insects, arachnids, crustaceans and myriapods). Insects account for more than half of all described animal species, and their total number of species is estimated at around 5.5 million [5]. At about 2 Gt C, animal biomass remains far below plant biomass [2].
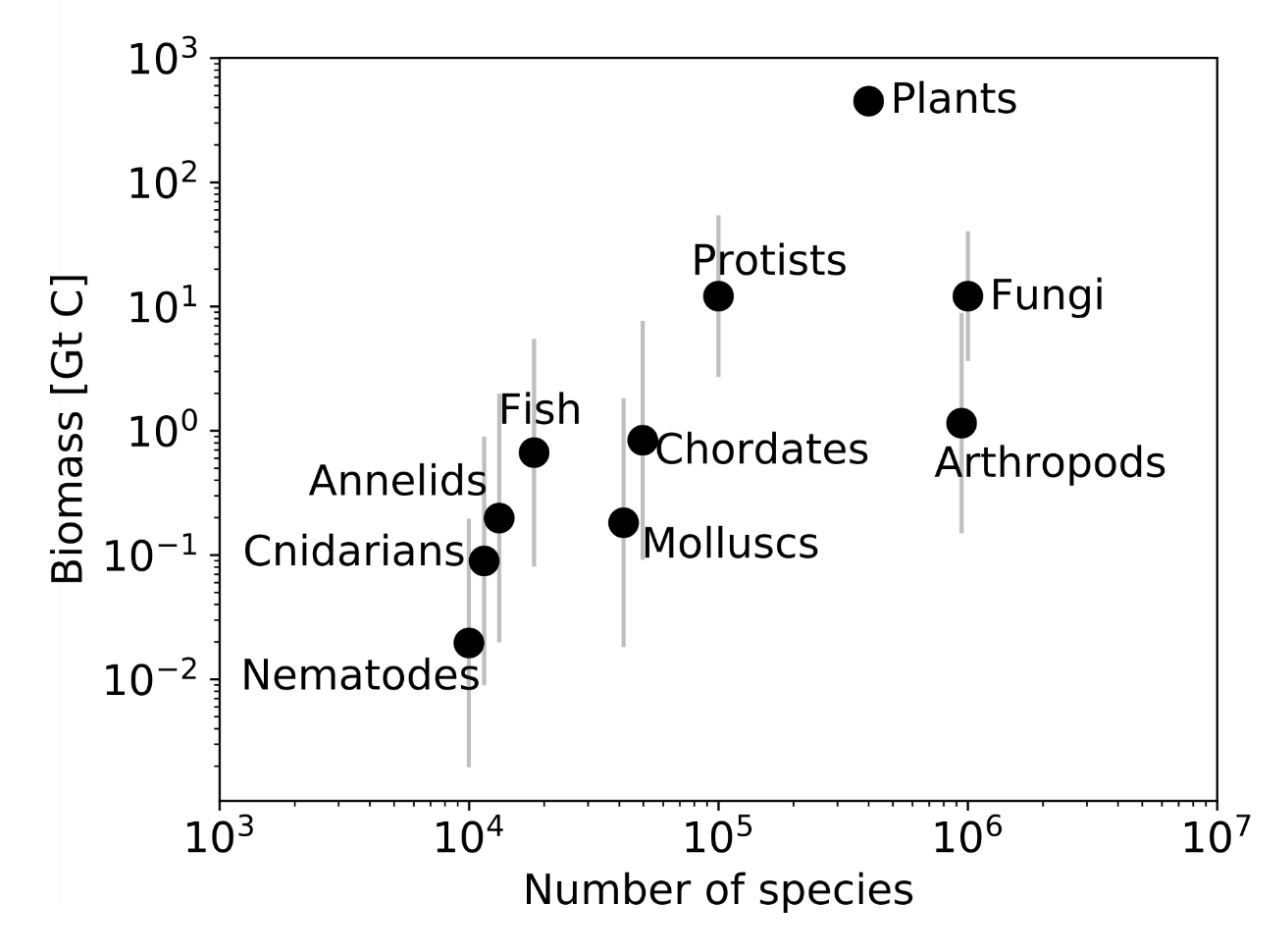
These comparisons should be interpreted as orders of magnitude. The estimates by Bar-On and colleagues are uncertain by a factor of two for several groups, and by as much as a factor of fifteen for terrestrial arthropods [2],[5]. They show that species richness does not predict biomass: with comparable numbers of species, plants and arthropods differ by more than two orders of magnitude (Figure 2) [2].
3. Nematodes and ants: extremely numerous but light
The number of individuals gives another picture of the place organisms occupy in the biosphere. Abundance and individual mass generally vary in opposite directions: the smallest organisms are the most numerous, without necessarily accounting for a large biomass.
3.1. Hundreds of billions of billions of nematodes in the soil
Nematodes are unsegmented worms, often less than one millimetre long. They live in soils, sediments, fresh water and oceans, as well as in many organisms. Some are free-living; others are parasites of plants or animals.
A global synthesis estimates that about 4.4 ± 0.6 × 10²⁰ nematodes live in the top 15 centimetres of soil. They are more abundant in subarctic regions (38% of the total) than in the tropics (21%) [6]. At the time of the study, this represented nearly 57 billion nematodes per person. As deeper layers and aquatic environments were not included, the overall total is even higher.
Their small size nevertheless limits their contribution to biomass: about 0.3 Gt fresh mass, or 0.02 to 0.03 Gt C [2],[6], compared with 2 Gt C for all animals. They nevertheless play a major role in soil food webs, consuming bacteria, fungi, roots or small animals and accelerating nitrogen mineralisation.
3.2. Nearly 20 million billion ants
Ants also illustrate the absence of a direct relationship between abundance and biomass. A synthesis published in 2022, compiling 489 field studies, estimates that about 20 quadrillion ants live on Earth, or nearly 2.5 million ants per person [7].
This estimate is deliberately conservative: data remain sparse for some regions – northern Asia and central Africa – and for arboreal and subterranean ants. It represents a marked downward revision of earlier estimates of 70 to 100 Mt C, which gave rise to the widespread idea that ant biomass was comparable to human biomass [5]. The five- to eightfold difference from earlier estimates illustrates how strongly these quantities depend on the extrapolation methods used.
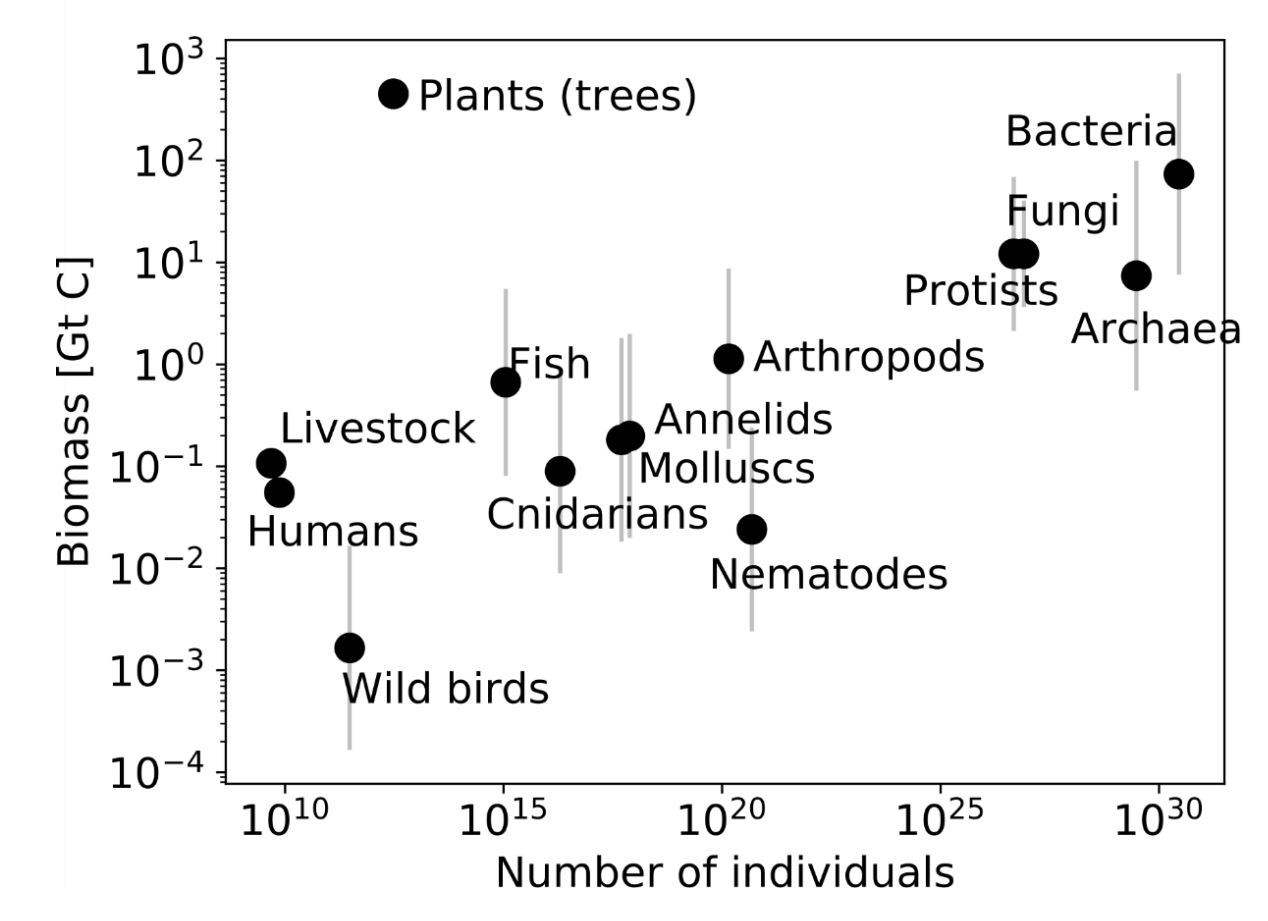
Comparison of several groups therefore confirms that high abundance does not necessarily imply high biomass (Figure 3) [2].
4. Krill: one species with a considerable biomass
Antarctic krill (Euphausia superba) illustrate a different situation (Figure 4). These 4-6 cm crustaceans live in the Southern Ocean, where they form vast swarms. They feed mainly on phytoplankton and are an essential food source for many fish, seabirds, seals and whales.
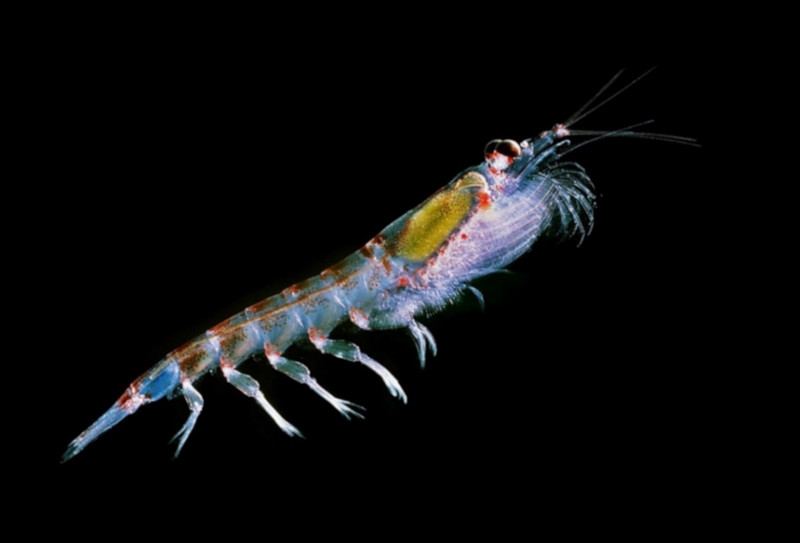
This comparison concerns the total biomass of the two species. It does not, of course, mean that individual masses are comparable: they differ by a factor of about 10⁵. It shows that a species made up of very small organisms can, when extremely abundant, account for a considerable global biomass.
These values nevertheless remain uncertain. Krill biomass varies among areas and seasons and depends on the coefficients used to convert an acoustic signal into individual density. Nor does it indicate population trends or vulnerability to the retreat of sea ice.
5. Can microorganisms be counted in the same way?
Comparison becomes more difficult for bacteria and archaea. In these prokaryotes, species are delimited using conventional criteria, such as a threshold of about 95% genome identity. Genes can also be exchanged between different lineages. The concept of species therefore cannot be applied to them as simply as it can to animals or plants.
Cell count is often a more workable indicator than number of individuals: the biosphere is thought to contain around 1030 cells. Researchers also use genetic sequence diversity, functional groups or total biomass, which describe different properties of microbial communities.
Bacteria may account for about 70 Gt C and archaea for 7 Gt C, making prokaryotes the second-largest component of global biomass after plants [2]. Most occur in soils, marine sediments and the deep subsurface.
This estimate is nevertheless much more uncertain than that of plant biomass. It depends on the volume of the environments considered, the extrapolated cell density and the average amount of carbon in each cell; revisions to estimates for the deep subsurface have changed it by a factor of two. Cell abundance therefore cannot be compared directly with the number of individual animals or plants.
6. A special case: the footprint of human societies
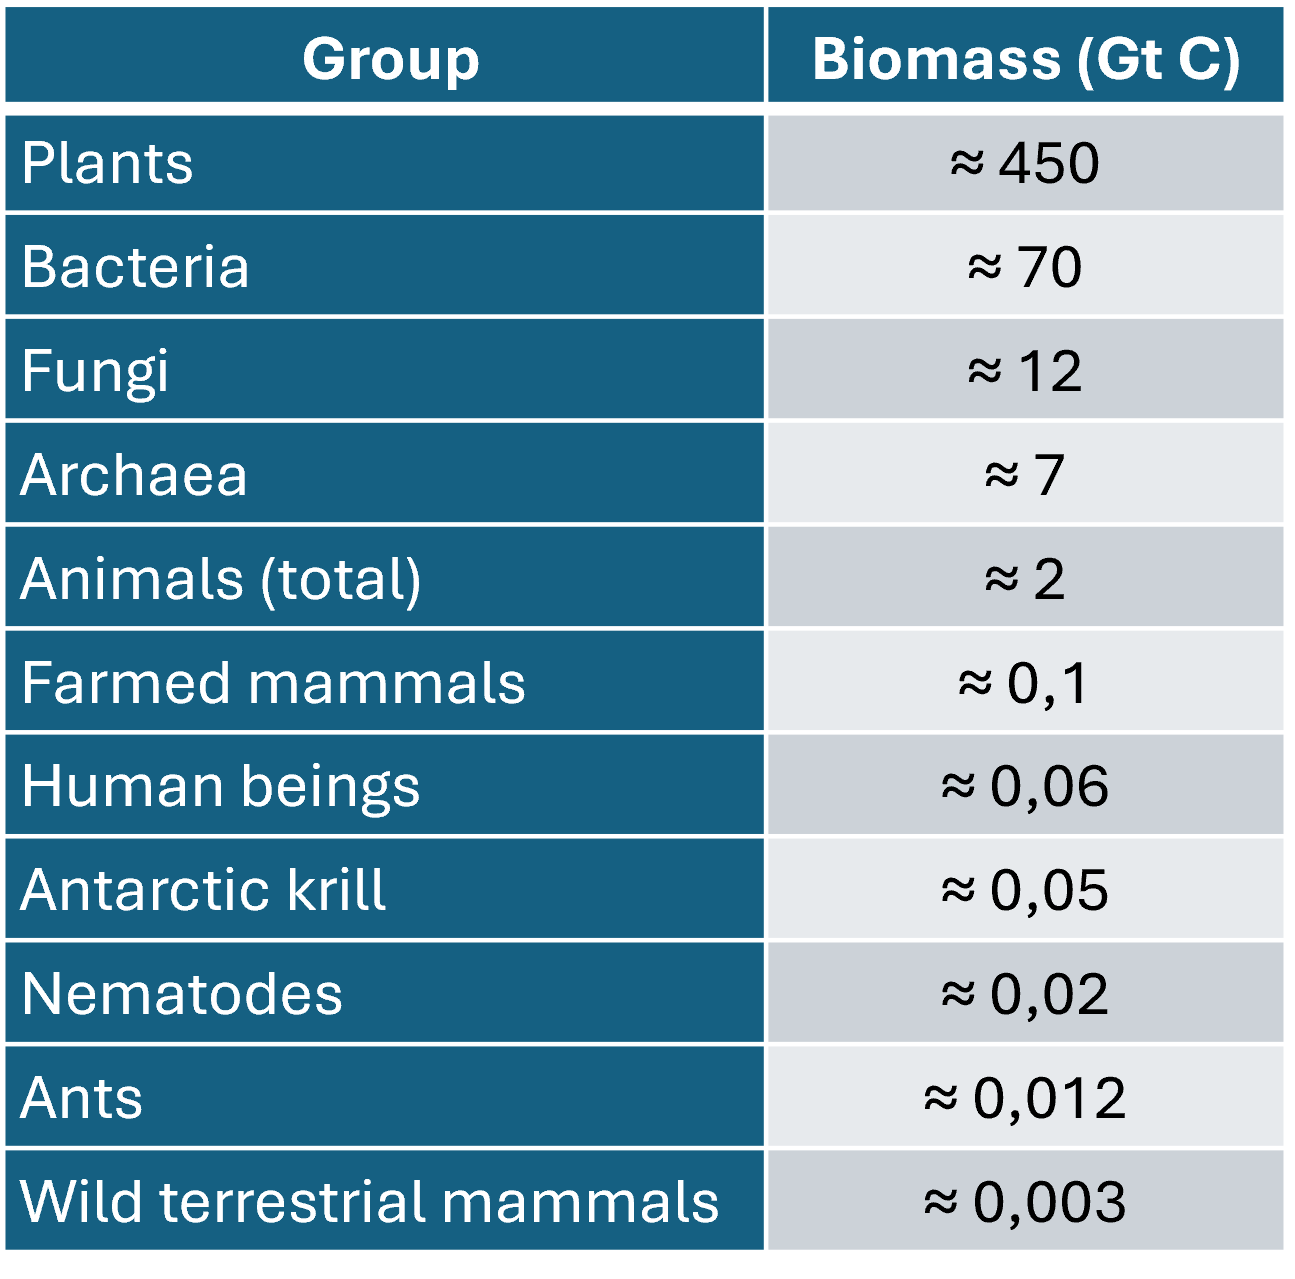 These three factors also shed light on the scale of the transformation of living organisms brought about by human activities. Farmed mammals – cattle, pigs and sheep – account for about 0.1 Gt C, more than thirty times the biomass of all wild terrestrial mammals, estimated at about 22 Mt fresh mass, or around 0.003 Gt C [2],[3]. The biomass of farmed birds, dominated by poultry, likewise greatly exceeds that of wild birds [2]. This comparison (Table 1) illustrates a recent reversal on the geological timescale: terrestrial animal biomass now consists overwhelmingly of domesticated species and humans themselves.
Table 1. Orders of magnitude for the biomass of the major groups in the biosphere (in GtC). Uncertainty reaches a factor of two for several groups. [Sources: based on references [2], [3] and [5].]
7. Three complementary dimensions of life
These comparisons show that no single indicator can establish which organisms “dominate” life. Plants dominate in biomass, animals in the number of described species, while prokaryotes and small animals reach vast abundances: the ranking changes with the quantity considered.
These rankings do not directly indicate the ecological importance of organisms. A low-biomass group can control considerable flows because its metabolism per unit mass is high. This is true of many microorganisms and small animals involved in pollination, decomposition or the recycling of matter. Conversely, a large biomass may be concentrated in a few dominant species.
Species richness, abundance and biomass are therefore complementary dimensions that can vary independently: a community may lose individuals and biomass without losing species – or vice versa.
8. Key messages
- Species richness, abundance and biomass describe different dimensions of life, measured by different methods and affected by different uncertainties.
- Plants dominate global biomass, accounting for about 80% of the 550 Gt C, most of it in the structural tissues of terrestrial vascular plants; animals account for most described species.
- A very large number of individuals does not imply a high biomass: 4.4 × 10²⁰ soil nematodes represent only about 0.02 Gt C.
- A single highly abundant species, such as Antarctic krill, can have a biomass of the same order as that of humanity.
- Terrestrial animal biomass is now dominated by farmed animals and humans, far ahead of wildlife.
- Biomass is a stock: these quantities measure neither flows of matter nor the ecological importance of organisms.
- For bacteria and archaea, the concepts of species and individual are difficult to apply; cell numbers, of the order of 1030, are used instead.
Notes and references
Thumbnail. Diagram produced using a generative AI tool.
[1] This calculation uses the usual approximation that carbon accounts for about half of dry mass. This conversion factor is indicative only: it is close to 45-50% for plant tissues, but differs substantially for organisms rich in lipids, chitin or mineralised structures.
[2] Bar-On Y.M., Phillips R. & Milo R. (2018). The biomass distribution on Earth. Proceedings of the National Academy of Sciences 115: 6506–6511. https://doi.org/10.1073/pnas.1711842115
[3] Greenspoon L. et al. (2023). The global biomass of wild mammals. Proceedings of the National Academy of Sciences 120: e2204892120. https://doi.org/10.1073/pnas.2204892120
[4] Christenhusz M.J.M. & Byng J.W. (2016). The number of known plants species in the world and its annual increase. Phytotaxa 261: 201–217. https://www.biotaxa.org/Phytotaxa/article/view/phytotaxa.261.3.1
[5] Stork N.E. (2018). How many species of insects and other terrestrial arthropods are there on Earth? Annual Review of Entomology 63: 31–45. https://doi.org/10.1146/annurev-ento-020117-043348
[6] van den Hoogen J. et al. (2019). Soil nematode abundance and functional group composition at a global scale. Nature 572: 194–198. https://doi.org/10.1038/s41586-019-1418-6
[7] Schultheiss P. et al. (2022). The abundance, biomass, and distribution of ants on Earth. Proceedings of the National Academy of Sciences 119: e2201550119. https://doi.org/10.1073/pnas.2201550119
[8] Atkinson A., Siegel V., Pakhomov E.A., Jessopp M.J. & Loeb V. (2009). A re-appraisal of the total biomass and annual production of Antarctic krill. Deep-Sea Research Part I 56: 727–740. https://doi.org/10.1016/j.dsr.2008.12.007
[9] Smith K.L. et al. (2025). Antarctic krill vertical migrations modulate seasonal carbon export. Science. https://doi.org/10.1126/science.adq5564