




Phytoplankton: a small stock, immense production
PDF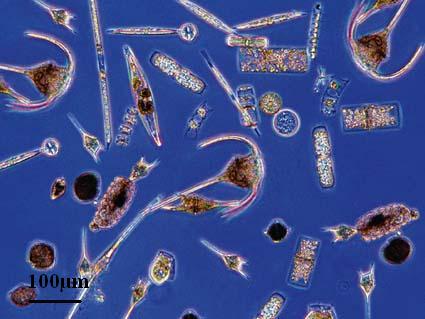
1. Biomass and production: two different quantities
Biomass is a stock of living matter measured at a given point in time, in this case as carbon mass. Biological production is the biomass newly formed over a given period: it is a flux. The ratio between net primary production P and average biomass B (P/B) indicates the theoretical number of stock renewals per unit of time; its inverse (B/P) gives an average renewal time. The renewal time τ = B/P links these two quantities: B = P × τ. For a given rate of production, the faster the renewal, the smaller the stock.
Thus, a forest retains a considerable stock of timber for decades or centuries, whilst a grassland can produce a great deal in a single year without accumulating a comparable amount of biomass. This distinction is essential for understanding the ocean (see Distribution of biomass on the planet).
2. Continents and oceans: very different stocks
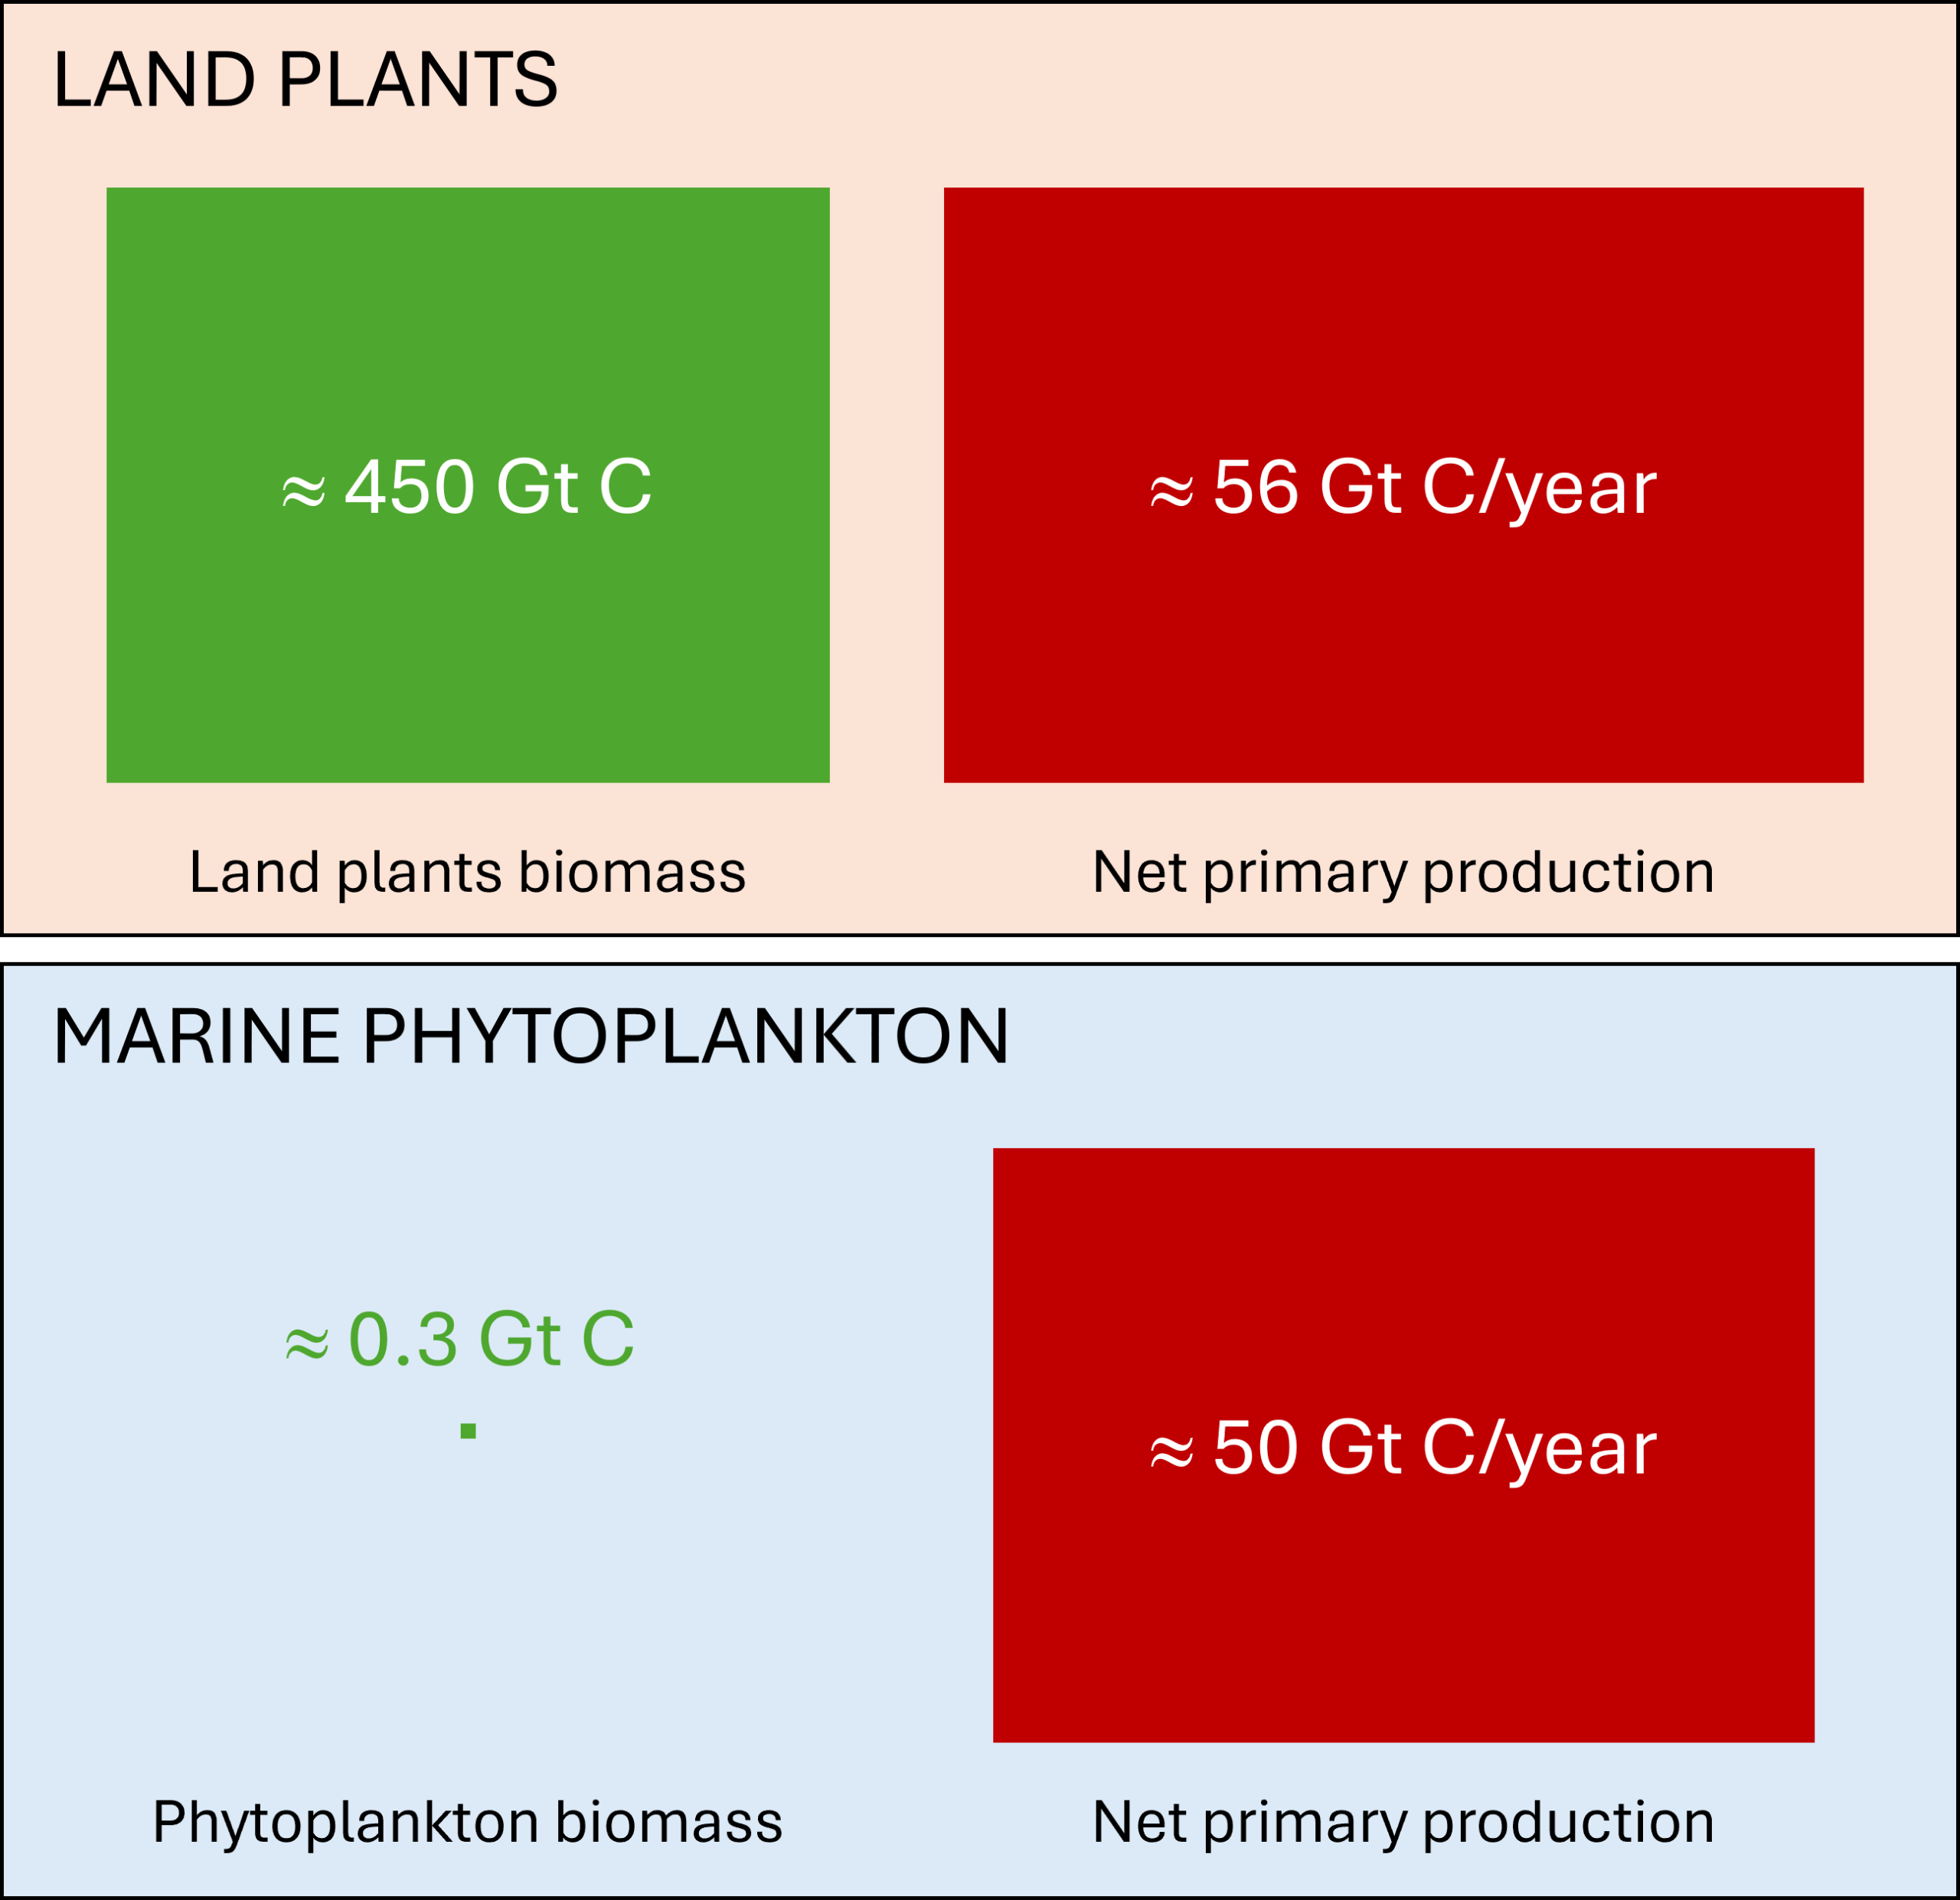
In the ocean, the total living biomass is of the order of 6 Gt C [1],[2]. In the compilation by Bar-On and Milo, marine producers as a whole — phytoplankton, macroalgae and seagrass beds — account for approximately 1 Gt C, compared with nearly 5 Gt C for heterotrophs — bacteria, archaea, protists, fungi and animals [2]. These aggregated values cannot be directly compared with more recent estimates of open-ocean phytoplankton alone, which are based on different methods.
Rapid turnover mainly concerns unicellular planktonic producers. Multicellular benthic producers, notably macroalgae and seagrass beds, retain their tissues for longer [2].
3. Phytoplankton: a small but highly productive stock
Phytoplankton comprises cyanobacteria and photosynthetic protists — diatoms, dinoflagellates and coccolithophores — which live mainly in the photic zone. It constitutes only a part of the plankton, which also includes heterotrophs, mixotrophs, viruses and animal larvae (See The Tara Oceans expedition explores the diversity of plankton and Ocean viruses).
The biomass of open-ocean phytoplankton remains uncertain. A recent estimate based on nearly 100,000 open-ocean profiles puts it at around 0.3 Gt C, a figure that remains of the same order of magnitude when extrapolated to coastal regions [4]. Bar-On and Milo had previously arrived at a figure of around 0.6 Gt C by combining two independent methods, albeit with considerable uncertainty [2]. The recent estimate of 0.3 Gt C, based directly on depth profiles, is used here for comparisons and calculations. Despite this low instantaneous stock, phytoplankton accounts for the majority of the approximately 50 Gt C of annual net marine primary production [3]. With a biomass of around 0.3 Gt C, its P/B ratio ranges between 100 and 200 per year, representing an average turnover time of two to four days. That of terrestrial vegetation is close to 0.12 per year, or approximately eight years: phytoplankton turnover is therefore around a thousand times faster.
This speed stems from the very nature of phytoplankton. Its tiny cells do not need to build supporting tissues, as they are carried by the water, and they can divide approximately once a day under favourable conditions. All the matter produced is therefore rapidly available to consumers, whereas the wood of a tree sequesters carbon for decades.
Table 1. Orders of magnitude of producer turnover. The P/B ratio relates an annual flux to an average global stock; it does not measure the lifespan of individual organisms. [Sources: terrestrial plant biomass according to Bar-On et al. [2]; phytoplankton biomass according to Stoer and Fennel [4]; net primary production according to Field et al. [3].]

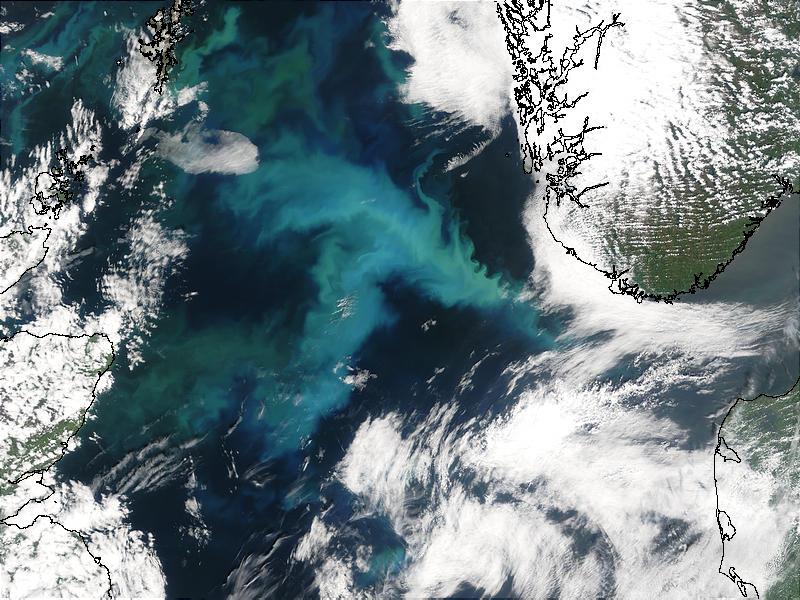
During a bloom (Figure 3), growth temporarily exceeds losses and biomass increases. These dynamics depend on light, nutrients, temperature, mixing and biological interactions [6].
4. A biomass pyramid that is sometimes inverted
A biomass pyramid represents the living matter present at each trophic level. On land, it is usually ‘upright’: biomass decreases from producers to herbivores, and then to predators. In some marine systems, the biomass of consumers exceeds that of the producers present at the same time: the pyramid appears inverted [7],[8].
This inversion ceases to be paradoxical as soon as we distinguish between stock and flux. At equilibrium, B = P × τ: biomass depends on both production and the renewal time. Phytoplankton produces a great deal, but its cells are grazed upon, infected by viruses or degraded within a few days; its stock therefore remains low. Large consumers renew themselves much more slowly, over a period ranging from several months to several years: lower production is sufficient to sustain a larger stock. Indeed, it is these same losses (grazing, viral lysis, degradation) that limit the phytoplankton stock and feed the rest of the food web (Figure 4).
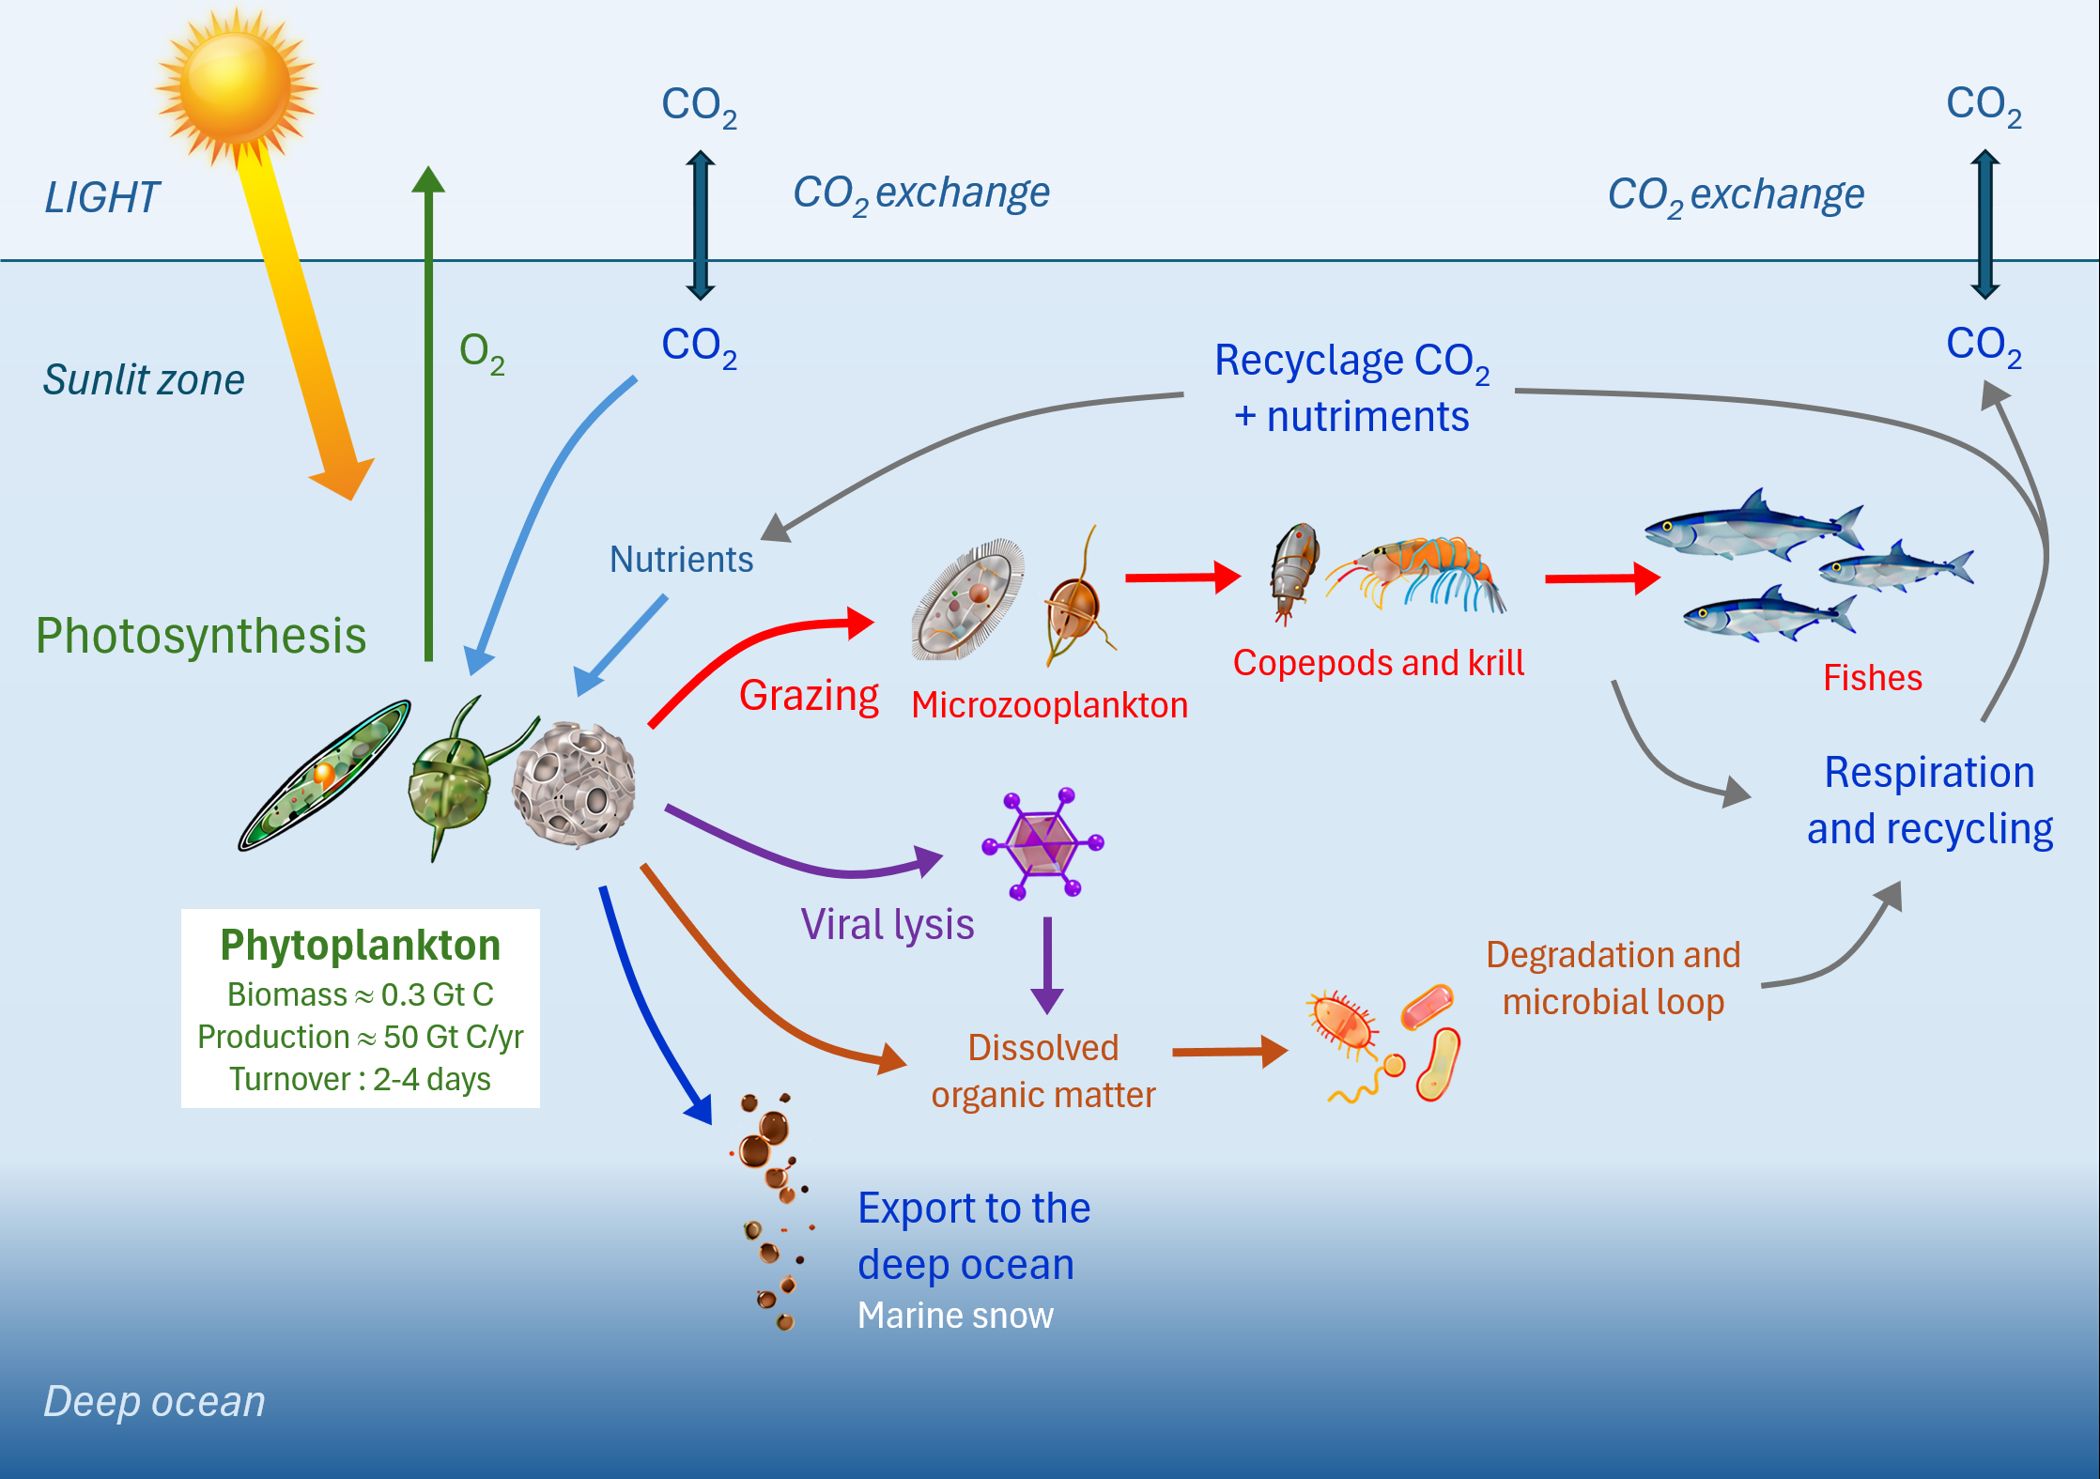
The inversion of biomasses is neither universal nor permanent. It depends on the scale under consideration, the season, the size of the organisms and the structure of the food web [7],[8]. A bloom can temporarily increase phytoplankton biomass. In seagrass beds and macroalgal forests, the durable tissues of producers generally maintain an upright pyramid. Conversely, some undisturbed reefs exhibit high biomass of large predators, owing to their mobility, available refuges and inputs from other areas.
Finally, the overall ratio of approximately 1 to 5 Gt C between producers and heterotrophs should not be over-interpreted. A large proportion of heterotrophs (deep-water bacteria and archaea, sedimentary organisms) live outside the photic zone and depend on exported or dissolved organic matter. This ratio aggregates stocks located in different places and at different trophic levels: it is an overall snapshot, not a biomass pyramid in the strict sense. It therefore does not describe all marine ecosystems.
5. The central role of microorganisms
Marine ‘consumers’ are not limited to zooplankton and fish: single-celled organisms account for around two-thirds of marine biomass [2]. Marine heterotrophic biomass is divided between animals (around 2 Gt C, mainly crustaceans and fish) and microorganisms (around 3 Gt C: protists, bacteria, archaea and fungi), with the latter constituting the majority. The turnover rate is much slower for certain large animals than for microorganisms.
Dissolved organic carbon feeds bacteria and archaea, which are in turn consumed by protists and then by zooplankton: this is the microbial loop [9]. Viruses also redirect the contents of lysed cells into the dissolved pool, or ‘viral shunt’ [10] (Figure 4). Finally, many protists are mixotrophic and combine photosynthesis with the ingestion of prey [11].
6. Key points
- Biomass is a snapshot of stock; production is a flux measured over a period of time.
- According to a recent estimate, approximately 0.3 Gt C of phytoplankton (stock) supports nearly 50 Gt C of annual marine primary production (flux): this stock is therefore renewed within a few days, throughout the year.
- This very rapid renewal mainly concerns phytoplankton, not all marine producers.
- Marine heterotrophic biomass is largely microbial and extends into the deep ocean.
- Grazing, the microbial loop and export maintain a low phytoplankton stock whilst transferring its production.
- A biomass pyramid can be inverted; on a global scale, however, the production and energy pyramids cannot.
Notes and references
Thumbnail. Photograph of Chaetoceros decipiens (Cleve, 1873), a micro-phytoplankton belonging to the class Bacillariophyceae. This chain of five living cells was collected from the Arcachon Basin on 5 March 2001. The diameter of a single cell is 30 µm. [Source: Nadine Neaud-Masson, PHYTOBS (2025). PHYTOBS dataset – French National Service of Observation for Phytoplankton in coastal waters. SEANOE. https://doi.org/10.17882/85178; Creative Commons CC-BY licence]
[1] Bar-On Y.M., Phillips R. & Milo R. (2018). The biomass distribution on Earth. Proceedings of the National Academy of Sciences 115: 6506–6511. https://doi.org/10.1073/pnas.1711842115
[2] Bar-On Y.M. & Milo R. (2019). The biomass composition of the oceans: A blueprint of our blue planet. Cell 179: 1451–1454. https://doi.org/10.1016/j.cell.2019.11.018
[3] Field C.B., Behrenfeld M.J., Randerson J.T. & Falkowski P. (1998). Primary production of the biosphere: Integrating terrestrial and oceanic components. Science 281: 237–240. https://doi.org/10.1126/science.281.5374.237
[4] Stoer A.C. & Fennel K. (2024). Carbon-centric dynamics of Earth’s marine phytoplankton. Proceedings of the National Academy of Sciences 121: e2405354121. https://doi.org/10.1073/pnas.2405354121
[5] Calbet A. & Landry M.R. (2004). Phytoplankton growth, microzooplankton grazing, and carbon cycling in marine systems. Limnology and Oceanography 49: 51–57. https://doi.org/10.4319/lo.2004.49.1.0051
[6] Behrenfeld M.J. & Boss E.S. (2018). Student’s tutorial on bloom hypotheses in the context of phytoplankton annual cycles. Global Change Biology 24: 55–77. https://doi.org/10.1111/gcb.13858
[7] Trebilco R., Baum J.K., Salomon A.K. & Dulvy N.K. (2013). Ecosystem ecology: size-based constraints on the pyramids of life. Trends in Ecology & Evolution 28: 423–431. https://doi.org/10.1016/j.tree.2013.03.008
[8] McCauley D.J. et al. (2018). On the prevalence and dynamics of inverted trophic pyramids and otherwise top-heavy communities. Ecology Letters 21: 439–454. https://doi.org/10.1111/ele.12900
[9] Azam F., Fenchel T., Field J.G., Gray J.S., Meyer-Reil L.A. & Thingstad F. (1983). The ecological role of water-column microbes in the sea. Marine Ecology Progress Series 10: 257–263. https://doi.org/10.3354/meps010257
[10] Suttle C.A. (2007). Marine viruses — major players in the global ecosystem. Nature Reviews Microbiology 5: 801–812. https://doi.org/10.1038/nrmicro1750
[11] Stoecker D.K. et al. (2017). Mixotrophy in the marine plankton. Annual Review of Marine Science 9: 311–335. https://doi.org/10.1146/annurev-marine-010816-060617