Nowcasting
PDF
Weather radars and satellites have long provided the main input data for nowcasting. Extrapolation methods based on recent movements of clouds and precipitating areas provided a very short-term forecast. Now, high-resolution numerical prediction is mature enough to be part of the immediate prediction tools and allows to push back several limits: maximum maturity, available parameters. And recently, data fusion methods have led to a new breakthrough by enriching outputs and reducing discontinuities when several methods are used.
1. The recent history of Nowcasting
Nowcasting covers all weather forecasts up to a few hours, a limit that varies according to definitions. It is a structured activity available over large territories, the origin of which will be placed without trying to be too precise in the 1960s with the rise of radar observation systems and geostationary satellites. Indeed, these observation systems offer a high frequency of measurement, making it possible to understand the evolution of the phenomena monitored over a wide geographical coverage.
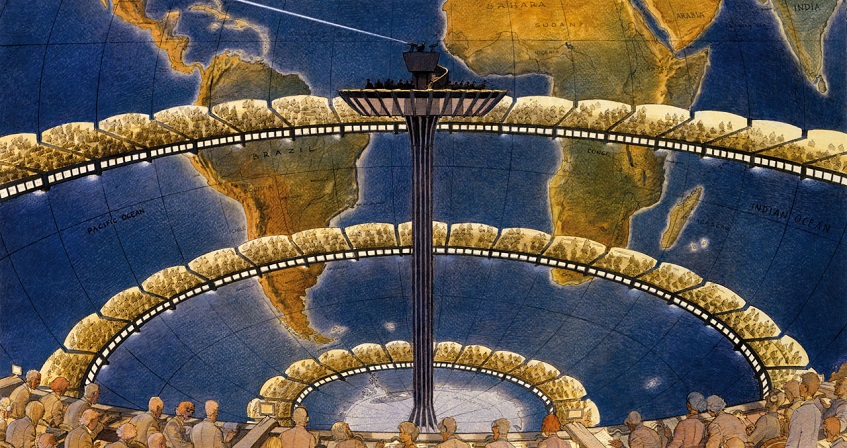
Over the years, many factors have improved immediate forecasting, such as the sharing of work or initiatives (e.g. COST 78 – European Cooperation in Science and Technology, 1983-1988) and the arrival of new meteorological satellites such as MSG (Meteosat Second Generation). The World Meteorological Organization (WMO) has promoted programmes to demonstrate immediate forecasting, particularly in conjunction with the Beijing (2008) and Vancouver (2010) Olympic Games. The cover image of this article illustrates the contribution of immediate forecasting in a sports audience.
For a long time, immediate forecasting focused on dangerous phenomena, cyclones, storms, heavy rainfall and floods. In addition to this “security of goods and people” component, there is now an economic optimization component. Aeronautics also works largely in “nowcast” mode (in particular to announce very short-term changes in weather conditions at an airport).
2. The contribution of satellite data
In immediate anticipation, geostationary satellites have several advantages: a wide geographical coverage from the tropics to the mid-latitudes of each hemisphere, a high measurement rate (e.g. fast scanning every 5 minutes of MSG), and a horizontal resolution allowing access to the mesoscale (infrared resolution of 4-5 km from MSG over Europe and 1 km in high resolution visible). MSG has added satellites to the range of nowcasting tools at Météo-France, within an international collaborative framework led by the meteorological satellite agency EUMETSAT: SAFNWC (Satellite Application Facility for Nowcasting). Low-orbit satellites offer a better geographical resolution than geostationary satellites, as well as a wider range of instruments. On the other hand, for a given area, they only capture a few sequences per day. Their immediate use is more likely to be at high latitudes where geostationary satellite coverage is limited. Every 2 or 3 years, SAFNWC delivers a new version of software that allows user services to offer nowcasting products in their field of interest. Météo-France is responsible, within the framework of SAFNWC, for developing codes for cloud and convection products from geostationary satellites.
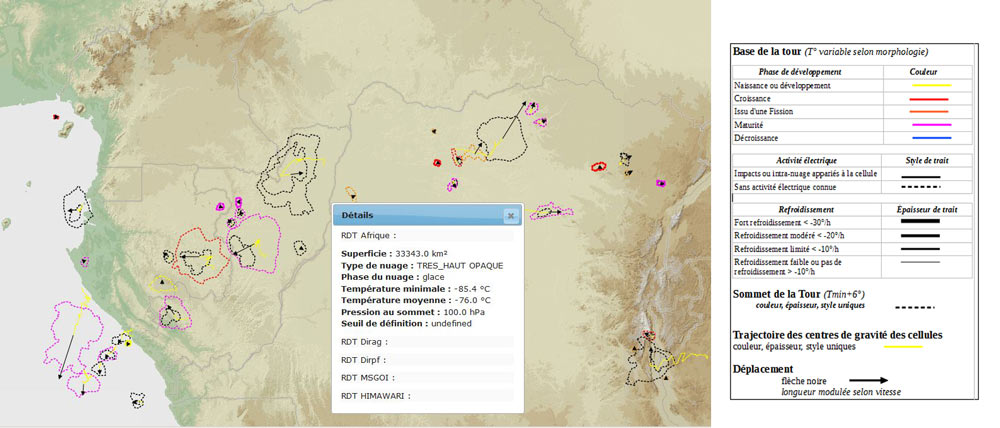
Let us take as an example the RDT product [1], [2] (Rapidly Developing Thunderstorm), from SAFNWC. RDT detects, tracks, characterizes and predicts the movement of convective cells. The RDT is based on the brightness temperature values of different channels or channel differences, as well as their trend between two images. The user has the possibility to use other data sources: other SAFNWC products (cloud and wind products), model data, data from ground lightning networks such as the Meteorological Network. Finally, the RDT gives the contours of the observed and predicted convective zones, as well as the attributes that characterize the convective cells and in particular their severity: cooling rate, electrical activity, presence or not of overshooting tops, vertical extension of the cloud, etc.
Forecasters use RDT to complement or replace radar data in poorly covered (mountains) or uncovered (oceans) areas . It has also been tested in the HAIC (High Altitude Ice Crystals) project to study ice crystals at high altitudes [3] to assess its potential as a tool for reporting areas of high crystal concentration [4]. During the HAIC project, the RDT reached level 5 of the TRL (Technology Readiness Level) scale, which measures the level of maturity of a technology.
The production of RDT by Météo-France now makes it possible to satisfy users with global needs, in particular aviation. Figure 1 illustrates the RDT coverage that continuously uses several satellites with varying spatial and temporal resolutions. Depending on the frequencies and availability of the various satellites, short-term analyses or forecasts (“planned for now” data) are used in the assembly to synchronize the information.
3. The contribution of radar data
Compared to satellite measurement, weather radars provide more usable information. The maximum reflectivities on an air column are used to determine the intensity of convection. The amount of precipitation that reaches the ground can be deduced from this. Meteorological services also use other types of radar measurements: the Doppler effect, which provides access to the radial wind component and then identifies strong shear forces, polarimetric measurements [5], which characterize hydrometeorological types, etc.
Zone methods allow to track large sets of precipitating cells while “object” methods allow to track individual cells. Knowledge of past movements makes it possible to extrapolate the information provided by the radar to a characteristic one-hour deadline.
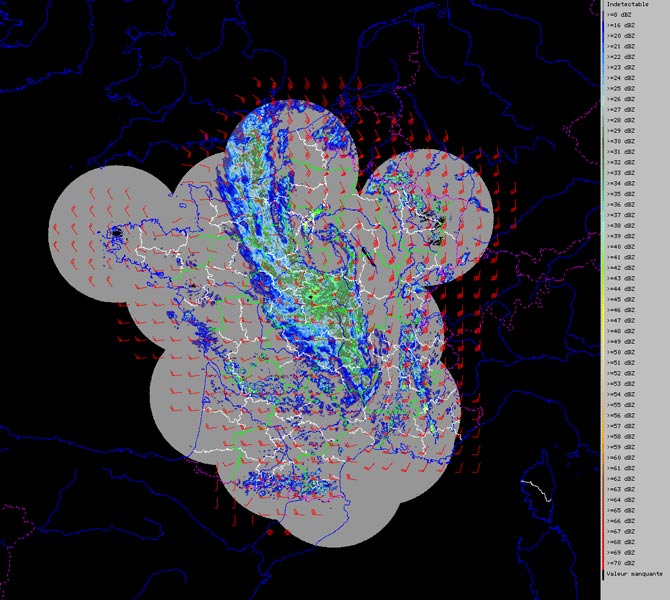
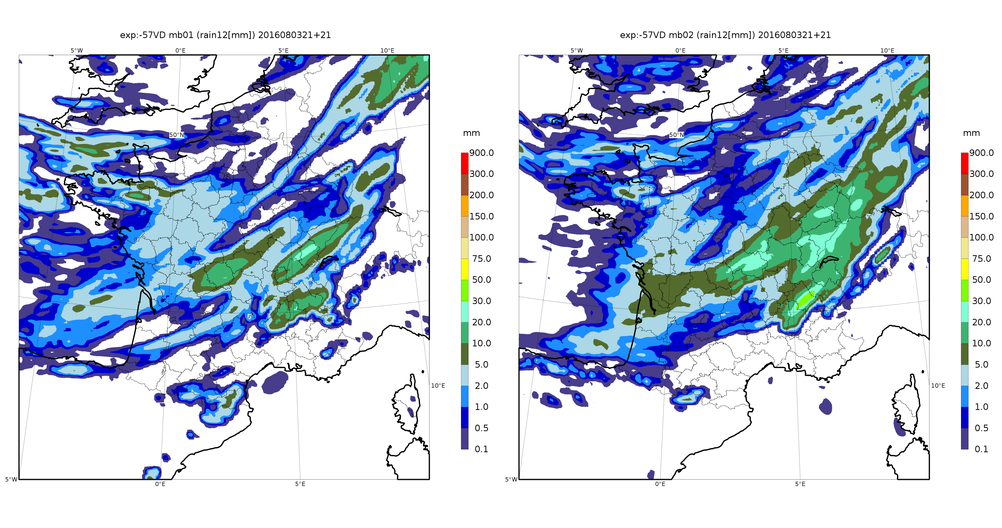
The 2PIR method (Immediate Precipitation Forecasting by Radar Imaging) was initiated in the 1990s and then rapidly used for immediate forecasting needs, such as precipitation forecasting at weather-sensitive sporting events. Its use has since diversified and is now Météo-France’s main automatic tool for forecasting rainfall in the coming hour, both in mainland France and overseas territories. Based on the radar reflectivity mosaics, this method first analyses the displacement of radar echoes between the observed image at the time and the one preceding it by 10 minutes, by cross-correlation, resulting in the development of a displacement velocity field defined on a regular grid. This field is then applied to the last observed mosaic to derive mosaics extrapolated up to 1 hour after the last observed mosaic, for reflectivity images as well as for 5-minute QPE (Quantitative Precipitations Estimate) images. Operating by successive advections, it makes it possible to prolong the observed movements of precipitation by reproducing both rotational movements and convergences or divergences (see Figure 2). The main limitations of the 2PIR method, in addition to those resulting from the radar data that feeds it, are linked to the hypothesis of a constant intensity advection and the failure to take into account the orographic effects.
For aeronautics, the ASPOC3D service (Application of signalling and storm forecasting for air traffic control) is based on:
- The Météorage lightning network
- Reflectivity measurements of the radar network coupled with satellite observations to identify the convection and altitude of cloud tops throughout France, with a resolution of 1 km and a refresh time of 5 minutes.
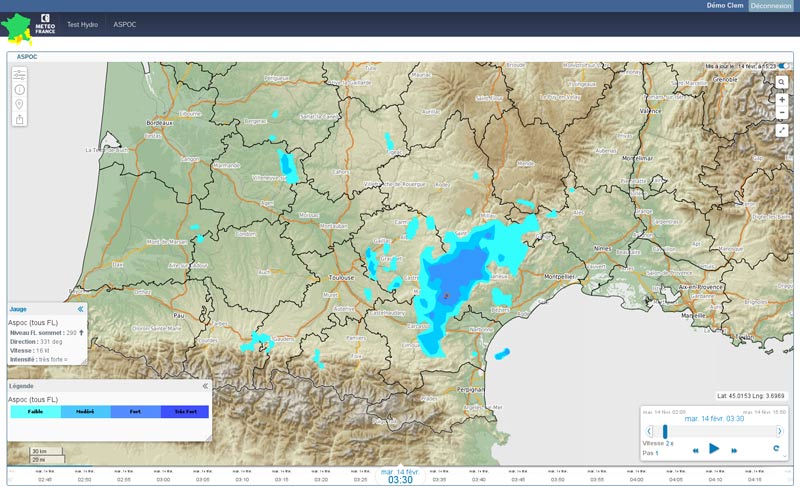
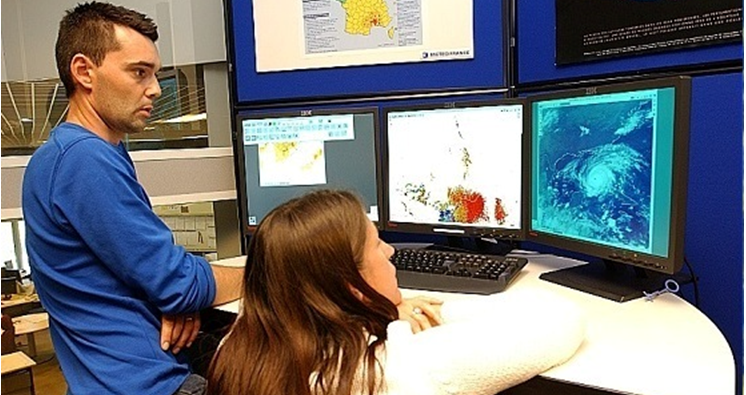
Convective cells are defined by the spatial contour of four levels of reflectivity. This almost three-dimensional information is then translated into objects that represent the clouds significant for aviation: identification of convective clouds, characterization of their contour, altitude of their top, maximum reflectivity values reached at the heart of the cloud, the presence of lightning that attests that the cloud has reached the storm stage. Each object can then be transmitted to the user to be integrated into his console or impact model. Figure 3 shows these “convection” objects.
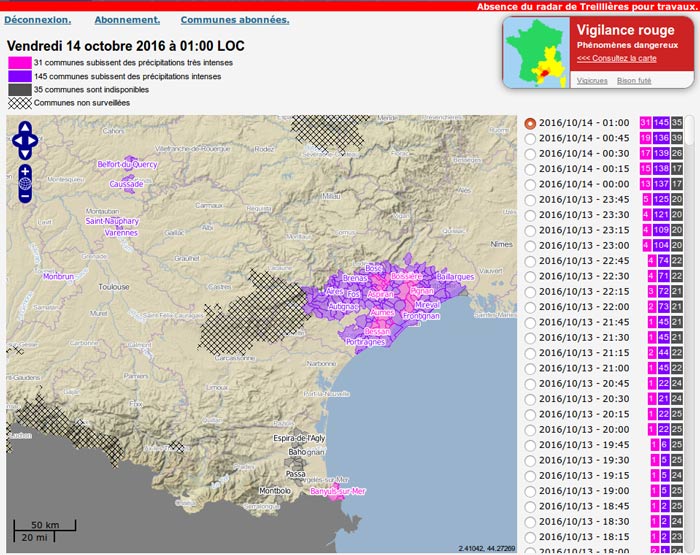
After the severe floods in south-eastern France on 15 June 2010, it seemed necessary to provide an alert service in case of exceptional localized rainfall. The objective is to provide, in a fully automatic way, a decision support service for mayors to activate flood management procedures. The APIC service (Intense Rainfall Warning at the municipal level) calculates the cumulative rainfall at different depths from the water slide images of the French radar network. For each area of interest and for a depth ranging from 1 hour to 24 hours, return period statistics are used to assess whether the observed precipitation is exceptional, distinguishing two levels of severity. When exceptional precipitation is newly diagnosed, or in the event of increased precipitation thereafter, a warning is sent to subscribers. A website (see Figure 4) provides an overview of the situation through a map that shows at any time current warnings, temporary unavailability and areas where the service is not open. In order to determine whether or not the service can be provided for a given municipality, Météo-France uses an estimate of the average quality of precipitation detected by radar over the previous two years. The APIC service was opened in December 2011 and now covers more than 92% of the municipalities.
4. Contribution of numerical weather prediction to immediate forecasting
Current immediate forecasting tools mainly use extrapolation of observed data. Advances in numerical modelling and the increase in computing power now make it possible to consider the use of numerical prediction for the very first forecasting deadlines, in order to overcome the limitations of methods based on the extrapolation of observations (structures cannot be created ex-nihilo, nor evolve in intensity, the impact of the relief in terms of displacement or evolution in intensity is not taken into account).
In parallel, fine-scale numerical models are now able to simulate scale phenomena that are of interest for nowcasting with great realism and to assimilate increasingly frequent observations. They make it possible to increasingly meet the needs of immediate forecasting: to have data on the first updated forecast deadlines with the latest observations. This information must also be available within a time frame that allows it to be used in real time. The challenge for numerical prediction models dedicated to nowcasting deadlines is to provide updated information in a short time frame. This constraint imposes a compromise between the number of updates, the refreshing of observed data and the necessary calculation time. If the simulated physical processes remain identical to those of fine mesh models, the numerical models dedicated to nowcasting must therefore be configured to meet these various challenges.
Météo France has a AROME-FR fine mesh model (read : Introduction to weather forecasting) whose implementation has been adapted to create a numerical model dedicated to immediate forecasting: AROME-PI, in place since March 2016.
AROME-PI includes all the characteristics of AROME-FR: same domain, same version of physical and dynamic code, same 3D-var data assimilation method, same resolution (1.3 km), same coupling model (ARPEGE). However, some settings are adapted to meet the needs of immediate forecasting. For example, AROME-PI outputs are available at a time interval of 15 minutes compared to 1 hour for AROME-FR. The aim is to facilitate the use of the model in immediate forecasting as well as the fusion of data with other highly paced forecasts.
The volume and frequency of information delivered by this model are important. Systems are in place to synthesize the available information and draw attention to dangerous phenomena that facilitate exploitation by Météo France forecasters.
5. A new step forward: data fusion
Data fusion methods [6] are expected to become widespread in immediate forecasting (combined approach between satellite, radar and mesoscale numerical prediction).
Let us take again the example of SAFNWC. The following data are used in addition to satellite data: lightning networks, data from weather numerical models.
The MPE product (Multisensor Precipitation Estimate) of Eumetsat is another example. In a given area, covered by a Meteosat7 or MSG satellite, data from American DMSP (Defense Meteorological Satellite Program) satellites equipped with the SSMIS (Special Sensor Microwave Imager/Sounder) instrument are used. Their measurements make it possible to implement statistical learning to estimate precipitation rates from geostationary satellite data. The statistical diagram is then used and regularly calibrated at each pass of the scrolling satellite.
Additional information can enrich the description of the diagnostics or immediate prediction from the radar data, here are two examples:
- The SAFNWC cloud top product developed by the Lannion Space Weather Centre is widely used, particularly for aviation. It provides information on the vertical extension of convective clouds, the 2D contours being determined from the mosaic of French hydrometeorological radars.
- Relative helicity [7] is a diagnosis from numerical prediction and is a good precursor of tornadic potential of convective cells. It is calculated for each cell observed by radar in the Météo-France production.
The extrapolation of observations brings us very close to the situation observed in the first few months. AROME-PI helps to compensate for known defects in the extrapolation of observations (limits in areas of relief, absence of cell creation or disappearance, etc.). The challenge is to take advantage of the advantages of each method to have more relevant and uninterrupted information on the 0h-3h forecast deadlines. The merger developed in Météo-France since June 2016 is based on a method combining two forecasts (called “experts”), radar extrapolation and AROME-PI, in order to obtain a combination close to or better than the best of the two experts. The resulting product is a weighted sum of the numerical forecast fields and extrapolations. The weights assigned to each expert are adjusted in real time, according to the past behaviour of each expert in comparison to the ground truth.
6. The near future
Nowcasting is gradually emancipating itself from the exclusive use of the major observation systems that have led to its emergence: radars and satellites. Progress in numerical prediction makes it possible to have forecasts that can be used at shorter deadlines and with a description of phenomena closer to the latest available observations. This observation leads us to build fusion methods between traditional extrapolation approaches and numerical prediction.
Nowcasting will benefit in the future from advances in the large observing systems it uses. The MTG (Meteosat Third Generation) satellite, which will provide a better spectral, horizontal and temporal resolution with the FCI (Flexible Combined Imager) radiometer. With the LI (Lightning Imager) flash detector embedded in MTG we will have new information which, for convection products in particular, will be used in the adjustment, real-time processing and verification phases. Concerning radar, progress is expected in new parameters that exploit all vertical radar measurement, dual polarization, and other improvements.
References and notes
Cover image. Roland Garros in the rain (2010)
[1] Mahfouf, J.-F., Moisselin, J.-M., Autonès, F., Vidot, J., 2017, Apport de l’observation satellitaire pour la prévision du temps, La Météorologie, to be published
[2] Autonès, F., Moisselin, J.-M., 2016, Algorithm Theoretical Basis Document for Convection Products, NWC/CDOP2/GEO/MFT/MFT/SCI/ATBD/Convection, see http://www.nwcsaf.org/indexScientificDocumentation.html
[3] Brenguier, J.-L., Bouttier, F., Moisselin, J.-M., 2015, Les nouveaux services météorologiques pour l’aviation, La Météorologie – n° 91 – novembre 2015 pp47-53
[4] Gounou, A., Moisselin, J.-M., Autonès, F., Brenguier, J.-L., Levaillant, D., Defer, E., Turner, S., Parol, F., Dezitter, F., Grandin, A., 2015, The RDT nowcasting tool for detecting convective areas associated with high ice water content during HAIC/HIWC field campaign. Paper for the 2015 SAE conference on Icing
[5] Radar polarimetry consists in emitting successively horizontally and vertically polarized waves. The comparison of the two feedback echoes makes it possible to determine the degree of sphericity of the target, and therefore the type of hydrometeor.
[6] Data fusion must be distinguished from data assimilation, described in the article Assimilation of Meteorological Data. In assimilation, care must be taken to preserve certain balances between the variables in order to allow a balanced initialization of a forecast model. In fusion, we do not have this constraint, and we can therefore define a state closer to the observations.
[7] In fluid mechanics, helicity (scalar product of the velocity vector by the vortex vector) is often considered as a measure of the entrainment effect that a local rotation will give on a fluid particle.
The Encyclopedia of the Environment by the Association des Encyclopédies de l'Environnement et de l'Énergie (www.a3e.fr), contractually linked to the University of Grenoble Alpes and Grenoble INP, and sponsored by the French Academy of Sciences.
To cite this article: MOISSELIN Jean-Marc (March 7, 2024), Nowcasting, Encyclopedia of the Environment, Accessed July 31, 2026 [online ISSN 2555-0950] url : https://www.encyclopedie-environnement.org/en/air-en/immediate-forecasting/.
The articles in the Encyclopedia of the Environment are made available under the terms of the Creative Commons BY-NC-SA license, which authorizes reproduction subject to: citing the source, not making commercial use of them, sharing identical initial conditions, reproducing at each reuse or distribution the mention of this Creative Commons BY-NC-SA license.