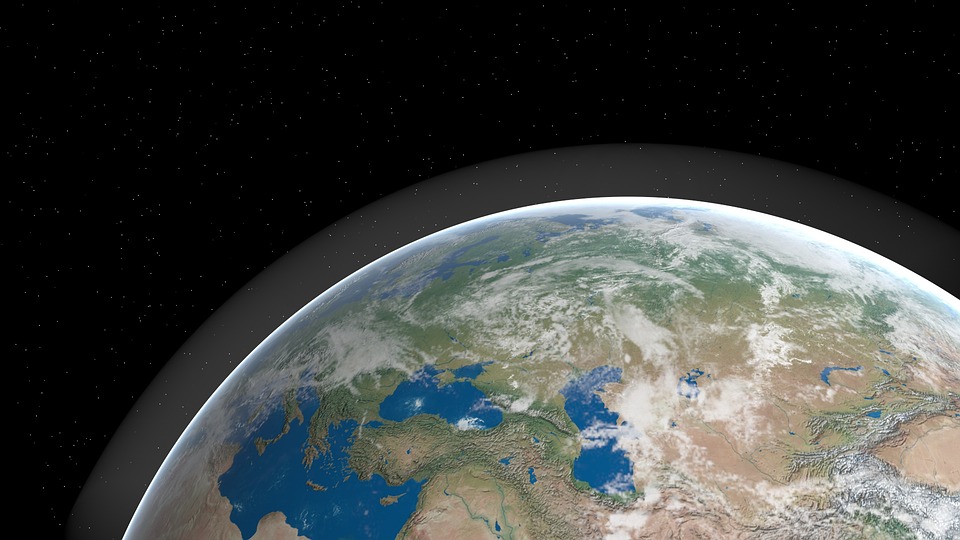
Introduction to weather forecasting
PDF
What time will we have next weekend? What are the risks of storms, thunderstorms and heat waves in the coming days? Meteorological services are now able to answer these questions in a useful way. But what mechanism is behind these forecasts? This article presents an overview of the functioning of Numerical Weather Forecasting centres that exist in various countries around the world, and introduces the essential concepts developed in the other articles of this sub-section.
1. Introduction
Each country in the world has a National Meteorological Service (NMS), whose mission is to make regular observations of the atmosphere and to issue forecasts for government, industry and the public. But only the most advanced countries have Numerical Weather Prediction (NWP) centres, whose products are also distributed to other countries, in exchange for their observations, within the framework of the World Meteorological Organization [1].
Among the main NWP centres outside Europe are those in the United States, Canada, Japan, Korea, China, Russia, Australia, India, Morocco, South Africa and Brazil. In Europe, only France, the United Kingdom and Germany make numerical forecasts for the entire globe, while the other countries have NWP centres covering only regional areas. The European countries have also come together in a “super-centre” [2], which is responsible for providing them with medium-range numerical forecasts.
2. The different functions of NWP centres

- Surface level measurements made by Meteorological Services worldwide, either at land stations or on offshore buoys;
- Altitude measurements made by ascending balloons (radiosondes) or meteorological radars [3];
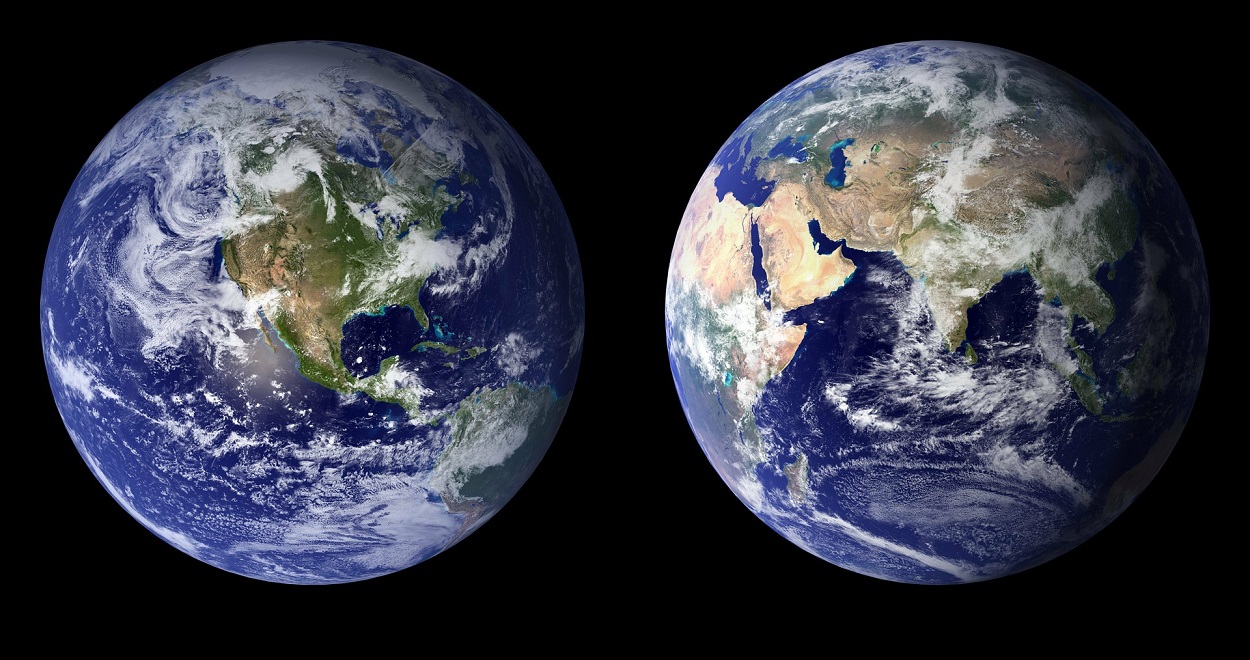
- Measurements made by meteorological satellites or, more generally, Earth observation satellites (there are currently more than fifteen such satellites);
- Measurements taken on board commercial aircraft or vessels.
The composite observing system thus constituted represents the bulk of the cost of meteorology, and this cost is shared by all countries in the world. The fact that different countries freely exchange observations (even sometimes in times of war) is one of the most remarkable achievements of meteorology.
The volume of these data is considerable (tens of millions of observations every day, spread over the entire globe) and every effort is made to ensure that they reach the NWP centres as quickly as possible, usually less than three hours after the measurement is made. These centres must have powerful telecommunication and information processing systems to receive, process and archive observations as they become available.
The second function is the critical examination of observations to detect possible false (if a measurement system is faulty), redundant, or biased observations. This is usually done by comparing neighbouring observations, or by comparing each observation with a recent forecast of the same parameter (if the observation is very different from the forecast, it will tend to be considered suspicious unless it is confirmed by neighbouring and independent observations). Any anomalies found on certain observations are reported to the originating services, which can then take corrective action.
The third function consists in producing, from the varied and heterogeneous set of recent observations, a “state” of the atmosphere in the form of mathematical fields that can be used to start the forecast model. This task of producing the initial state of the forecast is called Data Assimilation (see Meteorological Data Assimilation). The natural aim is to produce the initial state as close as possible to reality at a given time, but this is very difficult because the observations are all affected by small uncertainties, are not synchronous and do not cover all points on the globe. It is therefore necessary to interpolate spatially and temporally and to search for the “most probable” initial state taking into account all the available information.
The fourth function is the forecast itself, which is carried out by a numerical model of the atmosphere (see Weather forecasting models). The model solves the equations of fluid dynamics and calculates the successive states to project itself in time at 24h, 48h, etc… The main NWP centres actually use several forecast model configurations: a global version for a general forecast with a lead-time of several days, then one or more “regional” versions covering areas of particular interest, such as their national territory or overseas regions, for a forecast with a shorter lead-time and on a more detailed computing grid. In Météo-France, the global configuration is called ARPEGE (Pailleux et al. 2015), and the regional configuration is called AROME (Bouttier, 2007).
There is a growing trend to replace the deterministic forecast (a single forecast made from the best possible initial state) with the probabilistic forecast (several simultaneous forecasts made from slightly different initial states to account for residual uncertainties in the initial state). This is called the Ensemble Forecast (see The Ensemble Forecasting). From these different forecasts, we can calculate the probability that certain feared or expected events will occur.
Finally, atmospheric parameter forecasts are used to force “impact models” that more accurately calculate sea state, river flows, snowpack conditions and avalanche risks, air quality, road conditions, etc..
Other forecasting systems are also used to better cover very short or very long deadlines: Immediate forecasting systems extrapolate observations up to a few hours, with very frequent refreshing and are more efficient than NWP models for these short deadlines. Once per month, seasonal forecasting systems calculate the probable climatic anomalies in the next 3 to 6 months, with results of highly variable quality depending on geographical areas and seasons (see The seasonal forecast). Seasonal prediction models are very similar in design to the climate models used for IPCC reports [4].
The raw results of all forecasting systems are stored in databases as they are produced, and these databases are constantly queried by algorithms that feed the various applications where users find the finalized information they want (e.g. websites or mobile applications). For the most sensitive applications, particularly those related to the security of people and property, the databases are supervised by an expert forecaster. The latter examines the consistency of forecasts from several models, the most recent observations, and may decide to trigger weather warnings. In France, this applies in particular to the Vigilance Map procedure (see The role of the forecaster).
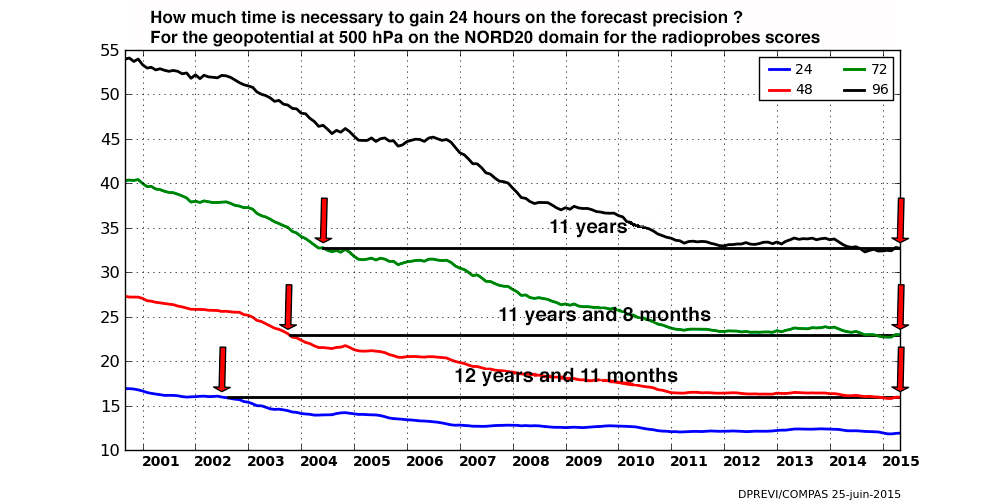
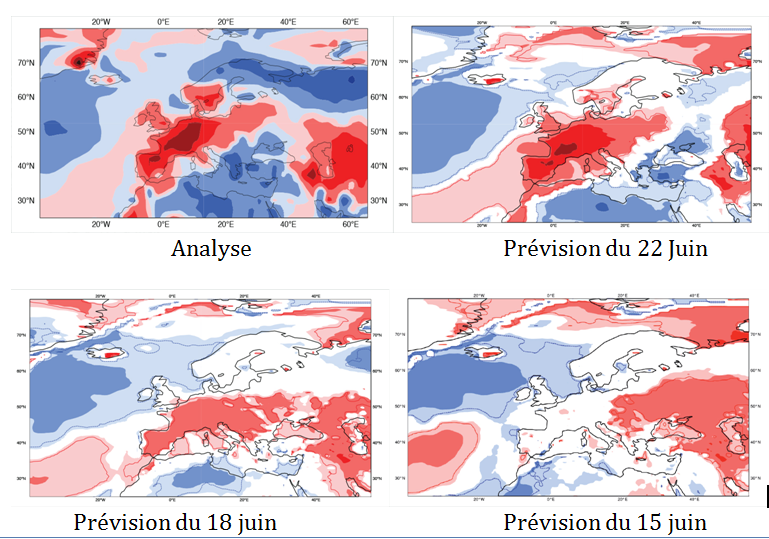
The last important function of a NWP centre is the a posteriori verification of forecasts. This is done by comparing forecasts with the most reliable observations, accumulating results over time long enough to create scores. NWP centres calculate a very large number of scores on a daily basis and exchange this information with each other. This makes it possible to know the average quality of forecasts, to verify that a new version of a forecasting system represents an improvement over the previous version, or to compare the performance of two NWP centres. It also makes it possible to verify that developments in observing systems improve the quality of the forecast (e. g. when an end-of-life satellite is replaced by a more recent generation satellite). Figure 1 is an example of such forecast scores.
As the quality of forecasts has now reached a high level, it is necessary to test any changes in forecasting systems over long periods of time (several months) to ensure that the forecasts are never degraded. In addition, the natural variability of atmospheric predictability, which is independent of the quality of forecasting systems, must also be taken into account. It is well established that some parameters are easier to predict in summer than in winter, or vice versa, but it is also clear that the atmosphere can behave very differently, and more or less predictably, over several successive winters (or summers). This slow variability is one of the most exciting aspects of atmospheric dynamics, which is still very poorly understood.
3. The quality of the forecasts
The quality of the numerical weather forecasts varies according to the parameter considered and the lead-time (see table). At short notice the temperature is generally predicted with an error not exceeding a few degrees, and the wind with an error not exceeding a few metres per second, except in stormy areas. For rainfall, especially thunderstorms, this level of quality is not reached, as small errors on previous quantities result in larger errors on rainfall.
Precisely predicting the precise location of a storm and the amount of rainfall associated with it or the risk of hail remains extremely difficult, even a few hours in advance. The same is true for the amount of snow in winter, especially when the temperature is close to 0°C on the ground, and a small temperature error can lead to an error in the nature of precipitation (rain or snow). This is also the case for fog, which remains very difficult to predict, even a few hours in advance, because its formation depends on the humidity, which is very variable. For tornadoes, only a risk of occurrence should be indicated.

The quality of the forecasts with monthly to seasonal lead-times is still very modest. In tropical regions, some phenomena such as El Niño [5] are predictable several months in advance. On the other hand, in Europe, it is still impossible to predict the temperature more than a few weeks in advance.
4. The computing power
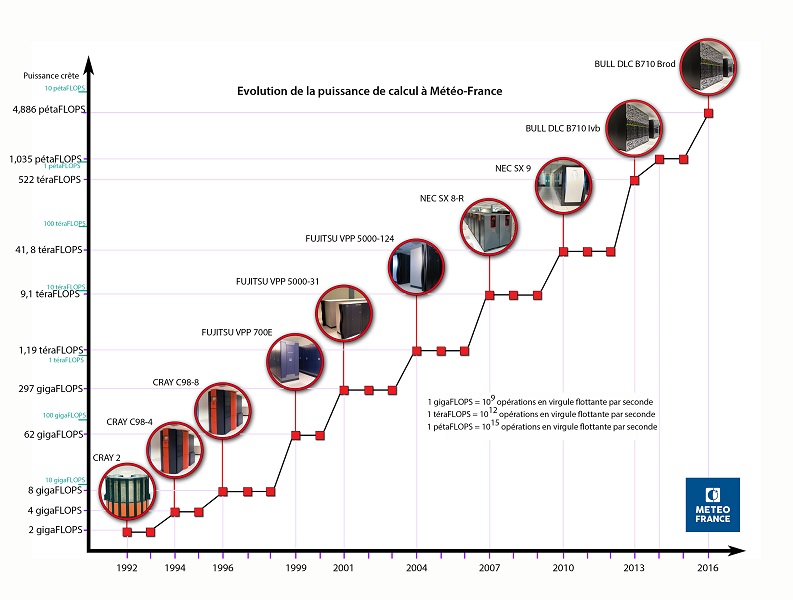
The degrees of freedom are numerous: the number of observations actually used, the complexity of the observation validation/assimilation algorithms, the resolution of the prediction models (i.e. the fineness of the computing grid), the complexity of the equations that can represent the processes in more or less detail, and the size of the prediction ensembles (generally the ensembles have several tens of members, but for some applications it could be advantageous to increase to several hundred). Finally, the distribution of computing power between atmospheric prediction and impact models requires careful consideration to ensure an optimal final result.
In the end, the start time of production varies according to the centres and products, from about ten minutes to several hours before the broadcast time.
5. R&D in anticipation
The improvement of NWP systems is based on the R&D departments of the NMS, which cooperate extensively with each other, but also with Universities and Research Organizations. There are still major knowledge challenges in the field of atmospheric processes and predictability, with obvious societal benefits that justify the public authorities devoting significant resources to this subject (in France, in university and CNRS laboratories in particular). The development of observation systems also leads to active technological research, with significant industrial benefits, particularly in the space sector, but also for ground-based radars and lidars [6].
Among the major R&D trends currently observed (2016), we can note in particular:
– The profound rewriting of codes to make the most of the new massively parallel computer architectures (problem of “scalability” [7]).
– The development of “coupled” prediction systems, in which one or more of the following modules are added to the atmospheric dynamics and physics model: underlying continental surface, ocean and wave dynamics, atmospheric composition (chemical species and especially aerosols). For this reason, NWP models increasingly resemble climate models, and most countries are seeking to share developments for NWP and climate.
– The development of ensemble predictions, which are now applied not only to the atmosphere, but also to other models (ocean and sea state, air quality, hydrology, snow cover, etc.)
– The accuracy and number of satellite observations are changing rapidly: the first direct wind measurements from Earth orbit are expected in 2017 (ESA’s ADM-AEOLUS Doppler lidar) and the first hyperspectral measurements in infrared from a geostationary satellite (3rd generation Meteosat IRS Instrument) are expected in 2020. Weather radar measurements are also becoming more efficient and varied.
– Indirect information on the state of the atmosphere from an increasingly diverse range of sources is gradually becoming available (so-called Big Data Paradigm [8]). For example, the trajectory of commercial aircraft is analyzed to estimate wind speed, wireless telecommunications disruptions provide information on rainfall, GPS networks provide information on air humidity, cars and mobile phones are now equipped with temperature and pressure sensors as standard. Capturing this new data and using it to improve forecasts will be one of the major challenges of the near future.
– In the United States and Europe, NMS are gradually moving towards the free distribution of raw NWP data over the Internet (see PSI Directive [9] in Europe).
– The private sector is also beginning to take an interest in the production of NWP, which is seen as an activity that can generate profits. Panasonic and IBM (The WeatherCompany [10]) recently communicated on this topic.
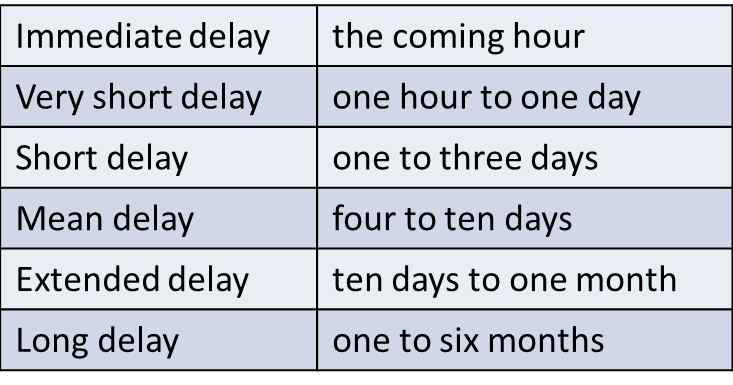
Table: Weather forecast deadlines
References and notes
Cover image: As early as 1922, an English scientist, Lewis Fry Richardson, thought that it would one day be possible to calculate atmospheric flow fast enough to make forecasts. He imagined a calculation factory where hundreds of mathematicians would calculate the flow by hand, under the direction of a “conductor”! [© F. Schuiten, Météo-France]
[1] WMO is a United Nations family organization
[2] The European Centre for Medium-Range Weather Forecasting, located in Reading, UK (Woods, 2005).
[3] Meteorological radars make it possible to locate precipitation areas within a radius of about 80km by scanning the space in three dimensions at intervals of about two minutes.
[4] Intergovernmental Panel of Experts on Climate Change, set up by the UN.
[5] El Niño is the warming of the waters of the eastern tropical Pacific that occurs every 3 to 5 years around Christmas, with considerable impacts on regional activity.
[6] Meteorological lidars are instruments that emit a laser beam and measure the light backscattered by the atmosphere, based on the radar model; they make it possible to determine approximately the air speed and aerosol content in a volume of several kilometres around the instrument.
[7] The scalability of a code is its ability to efficiently exploit computers composed of a very large number of processors, computing in parallel. The most efficient weather codes distribute the calculations over tens of thousands of processors without loss of efficiency.
[8] Big Data is the set of methods and tools that extract useful information from the massive data flows that circulate on the Internet.
[9] Public Sector Information, a directive that requires public services to make their data freely accessible to citizens, unless there are justified exceptions.
[10] The WeatherCompany, based in the USA, is the world’s largest private meteorological company. Since the beginning of 2016, it has been part of the IBM group.
The Encyclopedia of the Environment by the Association des Encyclopédies de l'Environnement et de l'Énergie (www.a3e.fr), contractually linked to the University of Grenoble Alpes and Grenoble INP, and sponsored by the French Academy of Sciences.
To cite this article: BOUGEAULT Philippe (January 5, 2025), Introduction to weather forecasting, Encyclopedia of the Environment, Accessed July 29, 2026 [online ISSN 2555-0950] url : https://www.encyclopedie-environnement.org/en/air-en/introduction-weather-forecasting-2/.
The articles in the Encyclopedia of the Environment are made available under the terms of the Creative Commons BY-NC-SA license, which authorizes reproduction subject to: citing the source, not making commercial use of them, sharing identical initial conditions, reproducing at each reuse or distribution the mention of this Creative Commons BY-NC-SA license.