Variability of solar activity and climate impacts over the last centuries
PDF
The primary energy source for the Earth’s surface is the solar energy flux. While the flux received at the Earth’s surface at a given location varies considerably, especially seasonally, the flux radiated by the Sun is relatively constant. However, variations in solar activity have been known for a very long time, and the hypothesis that this solar activity can affect our climate is an old one. What do we know about this solar activity over the last millenium; what activity can influence the climate; which influences are discernible?
1. The Sun, a variable star
Insolation, the flow of solar energy received on the Earth’s surface, varies mainly because of the Earth’s movements in its orbit, which causes daytime and seasonal alternation. On the contrary, irradiance, the flow of energy radiated by the Sun, has long been considered constant, hence its name “solar constant”. It was not until the extremely accurate measurements obtained by satellite that this “constant” was shown to be variable, but these variations are very small (in the order of 0.1% on the time scales at stake here).
The main indicator of the Sun’s own activity is the sunspots, these episodic dark spots on the Sun’s surface. These spots had been known for a very long time, but it was the diffusion of the telescope at the very beginning of the 17th century that made it possible to count these spots regularly [1]. These counts gradually revealed a very marked cycle with a 11-year period as well as variations on a century scale.
More recently, other expressions of this solar activity have been highlighted, including solar flares, extremely short phenomena (a few hours at most) of radiation ejection and high-energy particles, which are responsible for the northern lights (read Solar energies).
1.1. The 11-year cycle (known as the Schwabe cycle)
The convective and magnetic activity of the outermost layers of the Sun, the photosphere, chromosphere and corona, shows marked and cyclical variations in its activity. When activity is strong, warmer and more radiant areas, the faculae, are formed on the visible ‘surface’ of the Sun (photosphere) accompanied by cooler and less radiant areas, the sunspots. These zones have an existence of the order of the week, and accompany the rotation of the Sun in 27 days. The solar atmosphere (chromosphere and corona) is also warmer and more radiant all over the Sun. Flashes are triggered more frequently from the corona.

Satellite radiometers have been accurately measuring the variations in solar irradiance associated with this activity since about 1978. These measurements indicate a variation of 1 W/m2, or about 0.1%, between the maximum and minimum of the total solar irradiance (Figure 1). These variations are stronger, relatively, in the ultraviolet wavelengths, in the order of 1 to 10%, even if their precise values remain debated [2].
1.2. Secular variations in solar activity (“Gleißberg” variations)
While the number of sunspots is a good quantitative indicator of solar activity, it has the important bias of being levelled from below, with little or no sunspots during the Great Minima. However, the period covered by satellites does not include a Great Minimum: therefore, we do not know the minimum values of the irradiance, nor its total amplitude at this century time scale.
1.3. Secular to millennium variability: indirect indices of solar activity
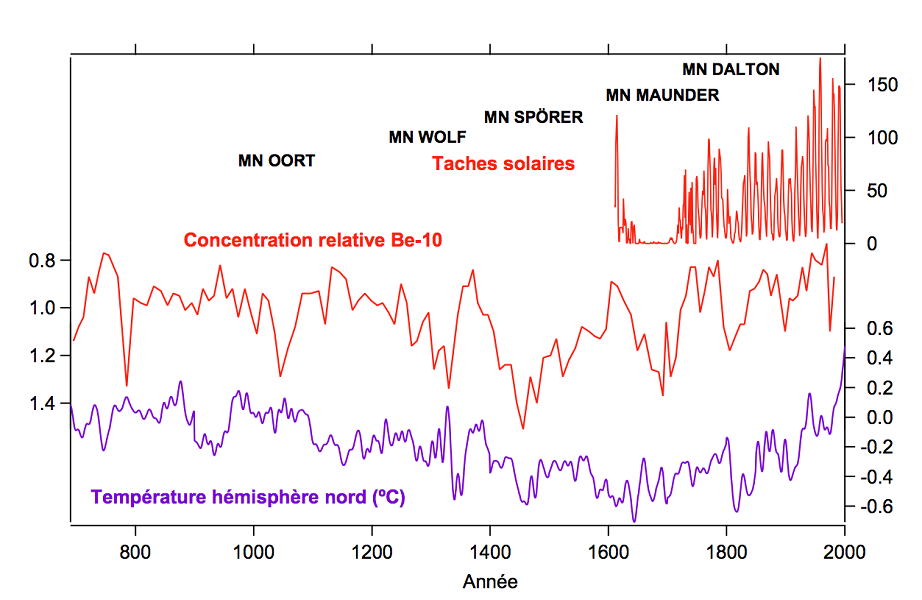
Before these direct records of solar activity, indirect indices (‘proxies’) must be used to reconstruct it. The most reliable are the cosmogenic isotopes, Carbon-14 and Beryllium-10, whose production in the Earth’s upper atmosphere is modulated by the solar magnetic field (Figure 2). These isotopes are recorded in tree rings and the ice on polar ice caps and mountain glaciers. Their concentration is interpreted in terms of solar activity, but only relative variations can be reconstructed. To obtain absolute variations, for example of total solar irradiance (in W/m2), it is necessary to calibrate these concentrations with independently known variations, either measurements (but restricted to a very short and recent period) or estimations based on physical models of solar activity [3].
However, these indirect indices remain relatively imperfect, both in terms of reliability and temporal resolution. In particular, the 11-year solar cycle remains very poorly resolved in the long records of these proxies, even if recent studies have highlighted it over the last millennium [4].
Over the past millennium, these proxies show that solar activity was low not only during the Maunder Great Minimum but also, and perhaps even lower, during the Spörer Great Minimum in the 15th century. The modern Grand Maximum, at the end of the 20th century, seems a little higher than the medieval Grand Maximum of the 8th century (Figure 2).
2. Impacts of the 11-year solar cycle on the Earth’s climate
Following the identification of 11-year solar cycles, countless studies have sought to find correlations with climate variations or other parameters [5]. Few of these correlations were significant and withstood serious analysis [6].
2.1. Impacts on the Earth’s surface
It now seems clear that the variations in irradiance due to the 11-year cycles are too small and too fast to generate significant temperature variations at the Earth’s surface, given its thermal inertia. In fact, the maximum amplitude of the irradiance, of the order of 1 W/m2 during a solar cycle, modifies the solar flux absorbed by the surface by about 0.14 W/m2, taking into account the geometric dilution factor on the terrestrial sphere (factor 1/4), the global albedo (0.3), and the absorption by the atmosphere (about 20%). The impact on a hemispherical or global average of the surface temperature seems just detectable, in the order of 0.1ºC per cycle (link : Forcing and retroactive effects; climate sensitivity).
However, a persistent correlation has been shown between these solar cycles and surface pressure and temperature in some regions of the Pacific [7]. It also appears that this solar cycle interacts with oscillations within the climate system, including those of the same decadal time scale, the Pacific decadal Oscillation and the North Atlantic Oscillation [8]. At the regional scale, solar activity could favour some synoptic regimes, particularly in winter, blocking regimes that favour the advection of polar cold air over Western Europe [9].
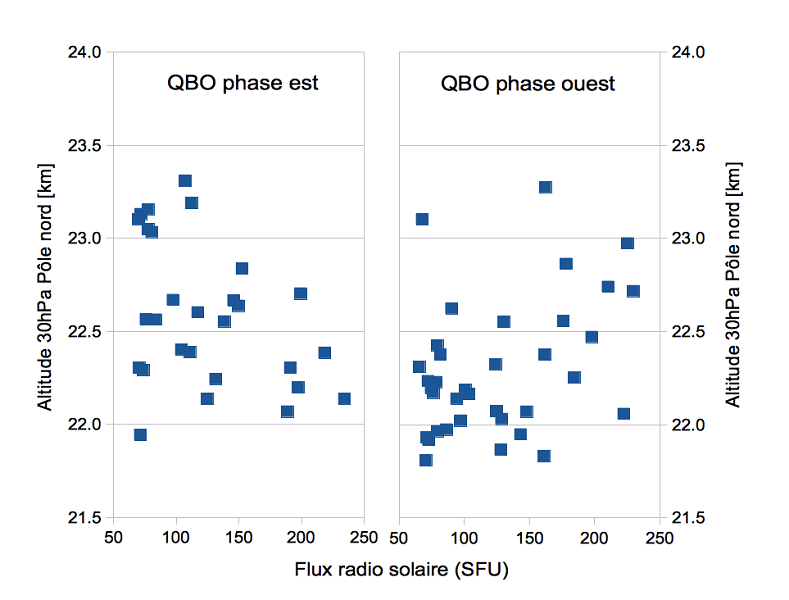
2.2. Impacts on the stratosphere
2.3. Possible impacts on cloud formation
Solar activity modulates not only the radiation of the Sun but also the flow of energy particles that penetrate the Earth’s atmosphere. This flow is primarily formed by the galactic cosmic radiation, deflected by the solar magnetic field (which varies with the activity of the Sun). Energetic particles are also emitted by the Sun itself, particularly during eruptions. These energetic particles interact with molecules in the atmosphere to form ions. The hypothesis that this ionization has a climatic impact dates back to more than 50 years [12], but remains highly debated, both theoretically and in observations. The mechanism most often advanced is that these ions would promote the formation of condensation nuclei necessary for cloud formation.
The role of clouds on heat exchange in the climate system is fundamental, via radiative fluxes, in visible and infrared wavelengths, but also latent heat fluxes. Solar modulation of the flow of energetic particles has a very limited direct climatic impact, but a very strong amplification could exist via this control on clouds. However, the various proposed correlations between energetic particle fluxes and cloud cover remain highly debated [13].
3. Impacts of secular variability on climate: the last millennium
The Maunder Great Solar Minimum (~1645-1715), well known by sunspots, took place during a period described by historians in Europe as the “Little Ice Age” [14]. However, this cool period remains poorly defined in time, probably because the decadal variability was strong compared to the climate change, and also because its definition depends on the considered criteria and regions. In its wide acceptance, the Little Ice Age extends from the 15th century to the middle of the 19th century, an end marked by the massive retreat of alpine glaciers.
Interpretation of historical and natural records (tree rings, in particular) in terms of local climatic conditions (temperature and/or precipitation) confirmed that the Little Ice Age was a detectable phenomenon on the scale of the Northern Hemisphere, but with a small amplitude (about 0.2ºC) compared to regional and temporal variability (i.e., colder and warmer decades).
Climate models are used to test the respective importance of different factors of climate change, including solar variability. These factors are taken into account by the radiative imbalance they are responsible for (‘climate forcing’,[link: point 1.3]). Recent studies agree with a small but detectable contribution of the solar activity to surface temperature variations from regional to global scales. However, the contribution of strong volcanic eruptions to these temperature variations has been revised upwards by these studies, including at decadal and even centennial scales [15].
4. Conclusion
It therefore seems likely that solar activity has had more pronounced climate impacts at the regional scale than at the global scale, at the time scales considered here. Better reconstructions and simulations of these regional climate variations, and independently of climate forcings, are needed to understand their relationships. These studies of the last few centuries make it possible to consider the climatic impact of the Sun over the next few centuries, particularly with the hypothesis of a return to a very low level: this impact should remain low on a global scale compared to those of anthropogenic forcings (greenhouse gases, albedo), but at a regional scale it will continue to interact with climate variability [16].
References and notes
Cover picture. Increase in global temperatures from 1950 to the end of 2013. [Source: NASA (Public domain), via Wikimedia Commons]
[1] Clette, F., L. Svalgaard, J. M. Vaquero, and E. W. Cliver (2014). Revisiting the Sunspot Number. Space Science Reviews, 186, 35-103. http://dx.doi.org/10.1007/s11214-014-0074-2
[2] Ermolli, I., et al. (2013). Recent variability of the solar spectral irradiance and its impact on climate modelling. Atmospheric Chemistry and Physics, 13, 3945-3977. http://dx.doi.org/10.5194/acp-13-3945-2013
[3] Delaygue, G. and E. Bard (2011). An Antarctic view of Beryllium-10 and solar activity for the past millennium. Climate Dynamics, 36, 2201-2218. http://dx.doi.org/10.1007/s00382-010-0795-1
[4] Mélanie Baroni, CEREGE, personal communication, December 2015
[5] Herschel, W. (1801). Observations Tending to Investigate the Nature of the Sun, in Order to Find the Causes or Symptoms of Its Variable Emission of Light and Heat; With Remarks on the Use That May Possibly Be Drawn from Solar Observations. Philosophical Transactions of the Royal Society of London, 91, 265-318, http://dx.doi.org/10.1098/rstl.1801.0015
[6] Pittock, A. B. (1978). A critical look at long-term Sun-weather relationships, Review of Geophysics, 16(3), 400-420, http://dx.doi.org/10.1029/RG016i003p00400
[7] Christoforou, P. and S. Hameed (1997). Solar cycle and the Pacific’centres of action’. Geophysical Research Letters, 24, 293-296. http://dx.doi.org/10.1029/97GL00017
[8] Van Loon, H. and G. A. Meehl (2014). Interactions between externally forced climate signals from sunspot peaks and the internally generated Pacific Decadal and North Atlantic Oscillations. Geophysical Research Letters, 41, http://dx.doi.org/10.1002/2013GL058670
[9] Barriopedro, D., García-Herrera, R. and Huth, R. (2008). Solar modulation of Northern Hemisphere winter blocking. Journal of Geophysical Research, 113(D14), D14118, http://dx.doi.org/10.1029/2008JD009789.
[10] Marchand, M. et al. (2012). Dynamical amplification of the stratospheric solar response simulated with the Chemistry-Climate Model LMDz-Reprobus. Journal of Atmospheric and Solar-Terrestrial Physics, 75-76, 147-160, http://dx.doi.org/10.1016/j.jastp.2011.11.008
[11] Labitzke, K. (1987). Sunspots, the QBO, and the stratospheric temperature in the north polar region. Geophysical Research Letters, 14(5), 535-537. http://dx.doi.org/10.1029/GL014i005p00535
[12] Ney, E. P. 1959. Cosmic Radiation and the Weather. Nature, 183(4659), 451-452, http://dx.doi.org/10.1038/183451a0
[13] Calogovic, J., Albert, C., Arnold, F., Beer, J., Desorgher, L. and Flueckiger, E. O. (2010). Sudden cosmic ray decreases: No change of global cloud cover. Geophysical Research Letters, 37(3), http://dx.doi.org/10.1029/2009GL041327
[14] Eddy, J. A. (1976). The Maunder Minimum. Science, 192, 1189-1202, http://dx.doi.org/10.1126/science.192.4245.1189
[15] Schurer, A. P., Tett, S. F. B. and Hegerl, G. C. (2014). Small influence of solar variability on climate over the past millennium. Nature Geoscience, 7(2), 104-108, http://dx.doi.org/10.1038/ngeo2040
[16] Ineson, S., Maycock, A. C., Gray, L. J., Scaife, A. A. A., Dunstone, N. J., Harder, J. W., Knight, J. R., Lockwood, M., Manners, J. C. and Wood, R. A. (2015). Regional climate impacts of a possible future grand solar minimum. Nature Communications, 6, http://dx.doi.org/10.1038/ncomms8535
The Encyclopedia of the Environment by the Association des Encyclopédies de l'Environnement et de l'Énergie (www.a3e.fr), contractually linked to the University of Grenoble Alpes and Grenoble INP, and sponsored by the French Academy of Sciences.
To cite this article: DELAYGUE Gilles (January 8, 2025), Variability of solar activity and climate impacts over the last centuries, Encyclopedia of the Environment, Accessed July 29, 2026 [online ISSN 2555-0950] url : https://www.encyclopedie-environnement.org/en/climate/solar-activity-variability-and-climate-impacts-case-of-recent-centuries/.
The articles in the Encyclopedia of the Environment are made available under the terms of the Creative Commons BY-NC-SA license, which authorizes reproduction subject to: citing the source, not making commercial use of them, sharing identical initial conditions, reproducing at each reuse or distribution the mention of this Creative Commons BY-NC-SA license.