Genetic polymorphism and selection
PDF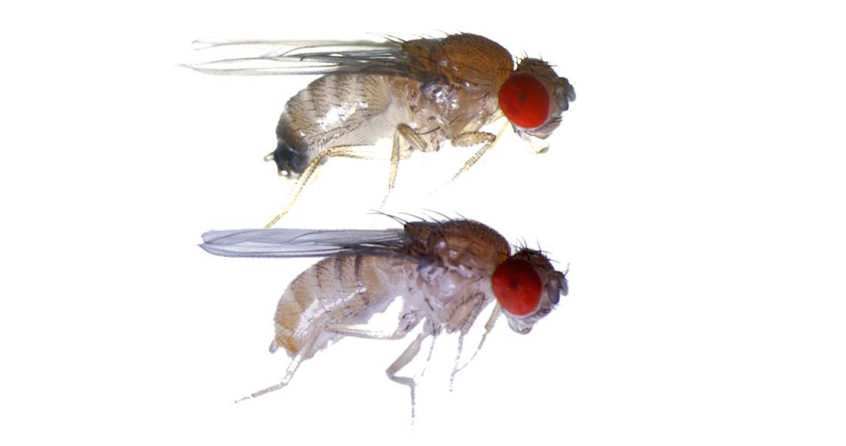
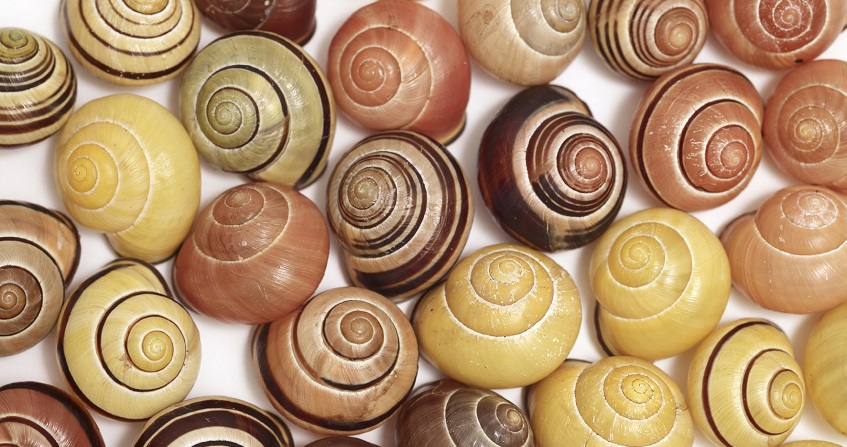
Polymorphism has caused controversy about its role in evolution. But if it essentially follows a neutral evolution, it serves as a reference, in contrast, for the study of natural selection. It is also used by ecologists in conservation biology to reconstruct the past history of species.
1. Mutations, random drift and neutral evolution
Polymorphism consists of mutations that escape DNA repair systems over cell divisions. Their rate of appearance is therefore a biological variable. In humans and chimpanzees, it is µ ≈ 10-8 mutations by nucleotideBasic element of a nucleic acid such as DNA or RNA. It is composed of a nucleic base (or nitrogenous base), a ose with five carbon atoms, called pentose, whose association forms a nucleoside, and finally one to three phosphate groups. and by generation. The considerable amount of sperm produced by male mammals means that there is much more cell division in male germ lineAll cells from stem cells to gametes than in female germ line: 380 against 23 at age 30 (i.e. 16 times more), and even more so when men age (840 against 23 at age 50, i.e. 36 times more). This means that in these species the mutations are mainly produced in male lines and depend on the age of the father. Each birth produces about 100 new mutations per genomeGenetic material of a living organism. It contains genetic information encoding proteins. In most organisms, the genome corresponds to DNA. However, in some viruses called retroviruses (e.g. HIV), the genetic material is RNA., but because only a small part of the genome is codingDescribes the part of the DNA or RNA of a gene translated into protein. Represents only a part of the gene from which it originates, as well as the mRNA in which it is registered., 99% of them have no effect on survival or fertility. They are called neutral. A new allelTwo homologous genes are called alleles when they have different shapes, distinguishable at a given level of observation. An allele can therefore correspond to a single sequence, or to a set of sequences that are different but not distinguishable at the phenotype level. (e.g. blue/brown/green eye colour but at the nucleotide level there are many more different alleles, several per colour). can be neutral, harmful or advantageous. Neutral mutations are the most studied, as they allow predictive models to be written to explore population history. Their distribution also serves as a null hypothesisRefers to the basic point of view, to the default position regarding a given phenomenon. In general, hypotheses opposing the null hypothesis have the burden of proof. to interpret, by comparison, that of deleterious or beneficial mutations.
We could think that in a genome comprising only neutral alleles, the drift of allelic frequencies would compensate for one fluctuation on the other and that the allelic diversity H would remain stable in the long term. But this impression is false. Gradually, diversity is eroding. This phenomenon is very similar to the loss of diversity of family names, a slow but significant phenomenon in human isolates such as remote villages. When a family does not have a boy, it does not pass on its surname. The same surname can be transmitted by related families, but the smaller the population, the greater the probability of names being lost. This is obviously not due to any biological property of the Y chromosome, which accompanies male births. Chance is enough to explain it. This property reflects the fact that the constitution of a daughter generation from a parental population follows the principle of a draw with replacementDrawing successively with delivery of tokens in an urn containing n tokens, means taking a first token, reading its value, putting it in the urn, taking a second token, reading its value, putting it in the urn, etc. until the p-th token. This means choosing p objects among n with repetition (you can choose the same object several times) and in order (the order in which you choose the objects is important). The number of successive draws with tokens among n is: n × n × n × … × n = np..
Like the Y chromosomes, some genes of the parental generation are not derived, and are not found in the daughter population. If the genes of the progeny are randomly drawn in a population of constant size, the probability that genes are not drawn is given by a Poisson’s law of parameter 1 as q(0) = e-1 = 0.367. These undrawn genes (more than a third) disappear without offspring. Their absence is compensated by parental genes which, by chance, have left more descendants. If this were not the case, the ancestral lines would remain parallel without ever meeting. The grouping of ancestral lines when going back in time is no different from a loss of diversity when going down to the present, nor is it different from what is called consanguinity.
The measurement of the diversity of formula (1) has a useful property: it depends on the sample size on which it is estimated. When a daughter population “t+1” is sampled by drawing n genes from a parental generation “t” the daughter generation shows a loss of variation equal to 1/n, according to the formula E(Hs) = Ht (1 – 1/n). This is true even if the daughter population is larger than the mother population, since it is a draw with replacement, but the larger the population, the less diversity is eroded. It is sufficient that the population be finite in size, which is what all real populations are. By convention, geneticists refer to this loss of variation as 1/Ne, where Ne is referred to as the effective number of chromosomes [1]. Thus from a generation 1 to a generation 2:
E(H2) = H1 (1 – 1/Ne) (3)
The effective size is almost always much smaller than the actual size of the chromosomes, for reasons that will be discussed later. For example, it is estimated that in the past of the human lineage, the effective number of chromosomes was in the order of 10,000. If there were no mutations, it is shown that the population would become monomorphic after a time T, of hope:
E(T) = 2 Ne (4)
There are two consequences to this: first, the polymorphism of a species is always “recent” on the scale of the duration of a species, since it depends on mutations that have restored the polymorphism despite the erosion of diversity that accompanies the drift of allelic frequencies. Second, the level of polymorphism is a compromise between two opposing mechanisms, creating the neutral mutation-drift balance.
The disappearance of polymorphism over time can be expressed in the opposite direction: when we go back in time, there is always a last common ancestor between two genes of the same locusPosition of the gene on the chromosome. In population genetics, all homologous genes (homology class). Two chromosomes or two genes are homologous if they match and exclude each other at meiosis.. This is what John Kingman called the coalescence process. The ancestor is not the same for different locus, because sexuality multiplies the number of ancestors, therefore also the common ancestors of genes. If the probability of having an ancestor common to the previous generation q = 1/Ne, remains constant over time, the distribution of ancestors follows an exponential law t = q. e-qt. The age expectation of these ancestors is equal to Ne. Two genes will be genetically similar if no mutation has occurred since then. But it is enough that a mutation has occurred in one of the lines leading from the ancestor to each of the two genes for both genes to be alleles. It can be deduced that the number of nucleotide differences between these two genes is θ = Ne x 2µ, where µ is the neutral mutation rate. This θ value, defined as θ = 2Neµ, is a fundamental parameter of population genetics.

The neutral evolution of natural populations is very important in conservation biology, as it allows the history of species to be reconstructed. Geneticists have long known that random genetic drift allows them to infer models of population differentiation and species structure in space (Figure 1). During the second half of the 20th century, the most commonly used indicator to study the structuring of a population into sub-populations was the FST of the formula:
FST = 1-HS/HT (5)
where HS is the average of the diversities of the sub-populations and HT is the diversity of the total population [2].
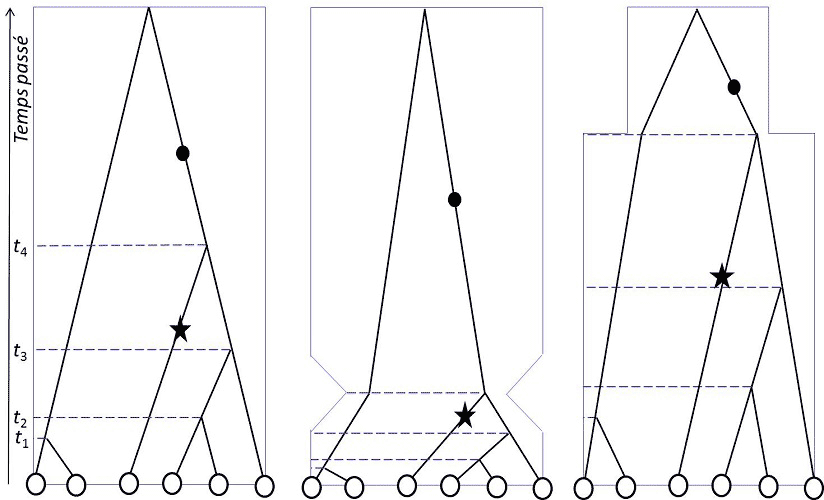
In the 21st century, the age of numerical genome analysis, the theory of coalescence [3], independently developed by Kingman, Hudson and Tajima in 1982-83, makes it possible, in addition to studying structuring, to determine whether populations have remained stable or have undergone demographic changes (Figure 2).
2. Neutral model and biodiversity management
Figures 1 and 2 illustrate how genetic variation profiles are affected by population history: spatial structuring, colonization, migration, population change are all events that impart a specific signature in the molecular polymorphism of species, and allow ecologistswork in ecology. The job of an ecologist is to study the relationships between organisms and the surrounding world. Should not be confused with the ecologist, who campaigns to protect ecology. to trace its history. During the Quaternary era – the current geological period – the world’s climates changed cyclically, resulting in periodic changes in the coastline, a north-south shift of biological associations and glaciers, and periods of wet or dry climate at all latitudes. The resulting movements, decreases, increases, invasions of populations, indices of species’ responses to changes in their environment, are systematically recorded by population biologists before any natural population management initiative is undertaken. Most of the applications of population genetics today are in conservation biology.
3. Harmful mutations
Because genes code for proteins, most mutations in coding regions modify the protein sequence (about 3/4 of the mutations, a proportion that varies according to the composition of the sequence). In the human lineage, about 40% of these changes are deleterious, i.e. they are missing when the evolution of the genome of this species is assessed since its separation from the chimpanzee lineage. If a mutation were neutral, it would have a 1/Ne chance of replacing the other genes present at this locus one day (in a population of effective size Ne, the other genes taken together are in a 1-1/Ne proportion, and each also has a 1/Ne chance of replacing all the others). But a mutation can be harmful and affect the health or fertility of the individuals who carry it. Its frequency may fluctuate for a few generations by random drift before disappearing by selection (forty generations on average in Drosophila). All members of a species are carriers of deleterious mutations. You and I are. They are almost always in the heterozygousstate. This characterizes an organism that has two different alleles of the same gene at the same locus for each of its homologous chromosomes., because if a mutation has a frequency, for example, of 1/1000, it will have a thousand times fewer representatives in the homozygotestate, characterized by an organism that has two identical alleles of this gene at the same locus for each of its homologous chromosomes. than in the heterozygote state. It is the slight disadvantage of heterozygotes that eliminates the mutation rather than the often much greater disadvantage of the homozygous. Since the effects of deleterious mutations on several locus are cumulative, the mutation burden becomes a quantitative variable like any other whose additive effects may be undetectable, but nevertheless effective over the long term to purge the genome permanently. This explains why proteins remain functional and harmful mutations remain of low frequency. They are probably one of the factors that explain the maintenance of genetic recombination. This makes it possible both to group harmful mutations together to eliminate them and to limit the consequences of their elimination on adjacent regions of the chromosomes.
4. Advantageous mutations
What are the 60% of mutations affecting proteins without deleterious effect? Like mutations affecting other regions of the genome, they can be “neutral”, i.e. without any effect on health or fertility in a particular environment and in a particular communication system of a species. Their frequency fluctuates randomly in natural populations. But if conditions change, they can be advantageous. They are then part of the natural selection and sexual selection imagined by Darwin, but also of the selection in the first sense of the word, i.e. the selection made by man on his domestic species. There are two types of polymorphism selected: transient polymorphism and balanced polymorphism.

5. Is polymorphism useful?
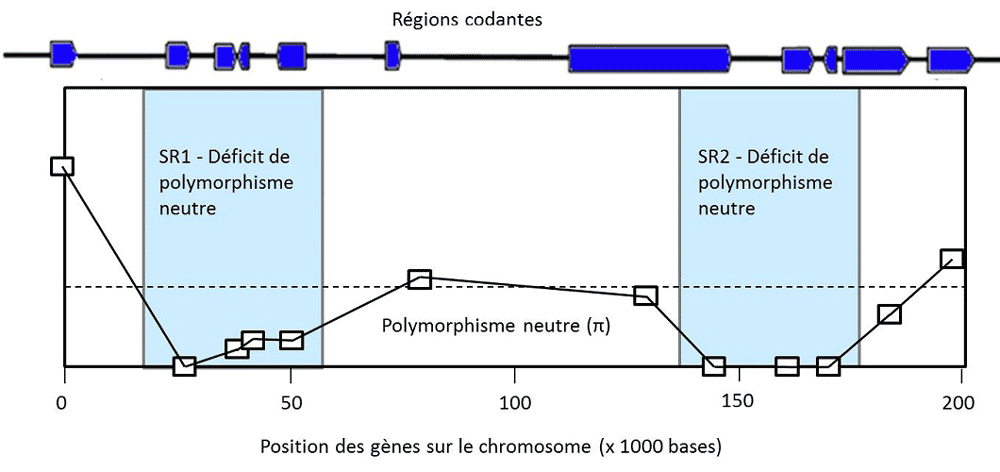
In the 1930s to 1960s, natural population geneticists discovered an increasing number of polymorphisms in nature. They wanted to assess its extent and discover its potential utility in terms of evolution. Debates opposed researchers who considered that genetic diversity conferred an advantage in itself and that selection maintained it at high levels, to researchers who considered that selection led to a phenotypeAll the observable characteristics of a fairly homogeneous wild individual, the remaining variations being rather harmful. None of them were right. The Frenchman Gustave Malécot had already demonstrated in the 1950s that neutral polymorphism was a consequence of Mendel’s {tooltip}laws{ind-text}Lois concerning the principles of biological heredity, set out by the Czech monk and botanist Gregor Mendel (1822-1884). in a finite size population [6]. It was finally the discovery in 1966 of extremely high levels of molecular polymorphism, which could not be explained by natural selection alone [7], that allowed the Japanese Kimura and Ohta to put forward the neutralist theory [8]. It was realized that the alternative to Darwin’s theory of natural selection was not the fixity of species (as thought by Darwin’s opponents, for example) but a continuous genetic change predicted by the neutral model, similar to the random walk of a diffusion phenomenon in physics. This vision was definitively accepted in the 1980s. However, the very low value of the effective population size measured in all species, compared to the reproductive population size, indicates that forces are eroding genetic diversity much more than neutralist models predict. This erosion is due in part, still poorly estimated, to natural selection, which eliminates harmful mutations and fixes advantageous variations, and thus increases the effects of drift on the neutral variation. Although extremely important for the future of the species, the selected polymorphisms certainly represent only a small fraction of the cases of polymorphism.
Neutral molecular polymorphism provides the basic theory, the reference model, from which the selection and history of populations are studied. The paradox is that, from now on, the molecular signatures of natural selection are sought in the genome using neutralist theory.
The existence of selective forces that maintain the recombination system, Mendel’s laws [9], and the genetic mixing of sexuality is an argument for considering that polymorphism, which they maintain in this way, has a short-term advantage in natural populations.
References and notes
[1] Until about 2000, the effective size was expressed in individuals and not in chromosomes, so the effective size of the chromosomes was 2Ne for autosomes, 1.5Ne for ,X chromosomes, and 0.5Ne for Y chromosomes and mitochondria, provided that the number of males and females at breeding is the same. These formulas can be found in manuals.
[2] This formula, here very general, takes several forms and denominations according to the genetic model used: Wright’s FST (for two alleles), Nei’s GST (its generalization, of which formula 5 above is a variant), ΦST,ρST, etc. It can be replaced by statistics with similar properties: DXY, AMOVA. This redundancy shows above all the success of “F-statitics” in ecology. Because of the dependence of the estimate on the sample size, the use of unbiased estimators must also take into account the particularities of the observation design. Cf: Weir B.S. & Cockerham C.C. (1984) Estimating F-statistics for the analysis of population structure. Evolution 38:1358-1370
[3] Kingman J.F.C. (1982) On the genealogy of large populations. Journal of Applied Probability 19A:27-43; Hudson R.R. (1983) Properties of a neutral allele model with intragenic recombination. Theoretical Population Biology 23:183-201; Tajima F. (1983) Evolutionary relationship of DNA sequences in finite populations. Genetics 105:437-460.
[4] Derome N., K. Métayer, C. Montchamp-Moreau & M. Veuille (2004) Signature of selective sweep associated with the evolution of sex-ratio drive in Drosophila simulans. Genetics 166: 1357-1366; Derome N., E. Baudry, D. Ogereau, M. Veuille & C. Montchamp-Moreau (2008) Selective sweeps reveal a two-locus model for sex-ratio meiotic drive in Drosophila simulans. Molecular Biology and Evolution, 25:409-416.
[5] Yassin A., Bastide H., Chung H., Veuille M., David J.R. & Pool J.E. (2016) Ancient Balancing Selection at tan Underlies Female Colour Dimorphism in Drosophila erecta. Nature Communications DOI: 10.1038/ncomms10400.
[6] Malecot G. (1948) The mathematics of heredity. Masson et Cie; Nagylaki T. (1989) Gustave Malécot and the transition from classical to modern population genetics. Genetics 122, 253-268.
[7] Lewontin R.C. & Hubby J.L. (1966) Molecular Approach to the Study of Genic Heterozygosity in Natural Populations. II. Amount of Variation and Degree of Heterozygosity in Natural Populations of Drosophila pseudoobscura, Genetics 54: 595-609; Lewontin R.C. (1974) The Genetic Basis of Evolutionary Change. Columbia Univ. Press, New York.
[8] Kimura M. (1969) The Rate of Molecular Evolution Considered from the Standpoint of Population Genetics. Proceedings of the National Academy of Sciences, 63:1181-1188.
[9] http://uel.unisciel.fr/biologie/analgen/analgen_ch01/co/learn_ch1_01_01_01.html
The Encyclopedia of the Environment by the Association des Encyclopédies de l'Environnement et de l'Énergie (www.a3e.fr), contractually linked to the University of Grenoble Alpes and Grenoble INP, and sponsored by the French Academy of Sciences.
To cite this article: VEUILLE Michel (January 5, 2025), Genetic polymorphism and selection, Encyclopedia of the Environment, Accessed July 29, 2026 [online ISSN 2555-0950] url : https://www.encyclopedie-environnement.org/en/life/genetic-polymorphism-and-selection/.
The articles in the Encyclopedia of the Environment are made available under the terms of the Creative Commons BY-NC-SA license, which authorizes reproduction subject to: citing the source, not making commercial use of them, sharing identical initial conditions, reproducing at each reuse or distribution the mention of this Creative Commons BY-NC-SA license.