The Tara Oceans expedition explores the diversity of plankton
PDF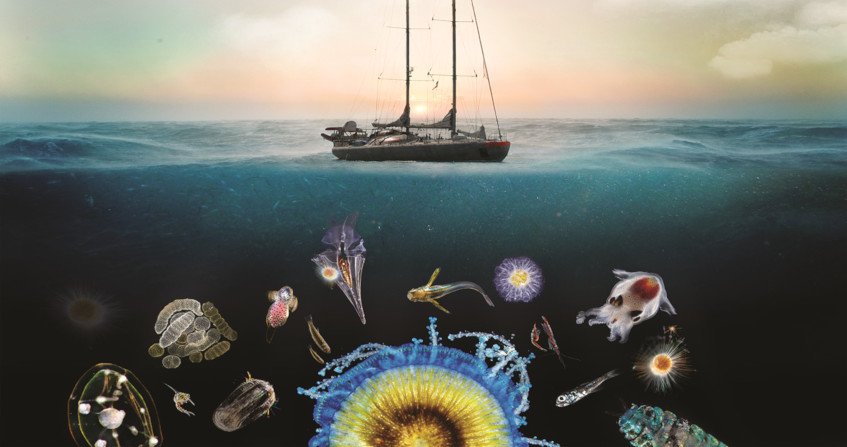
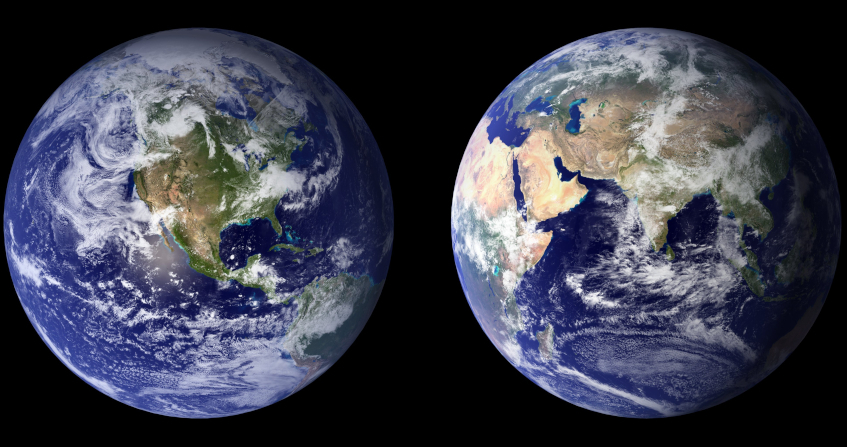
The oceans cover two thirds of our planet, and they are where life was born more than 3 billion years ago. The ocean is a formidable pump that absorbs nearly 30% of the carbon dioxide emissions due to human activities, notably thanks to the phytoplankton that captures it during photosynthesis. Plankton, made up of organisms invisible to the naked eye, play a major role in the major biogeochemical cycles of carbon, (half of the oxygen produced on Earth comes from the oceans), nitrogen, phosphorus and sulphur, amongst others. However, the micro-organisms that participate in these cycles are still largely unknown to us. The Tara Oceans expedition has set up an international scientific consortium to develop high-resolution sampling protocols, analyze the samples, generate data and analyze them to explore this unknown world. After three years of navigation and study of our planet’s oceans, scientists from the Tara Oceans expedition have revealed an unsuspected diversity of eukaryotic single-celled organisms (also called protists). The sequencing of close to a billion genetic barcodes has made it possible to radically change our vision of the biological and functional diversity of the world’s plankton, which populates an ecosystem that is key to the functioning of our biosphere.
1. Exploring the largest ecosystem on Earth

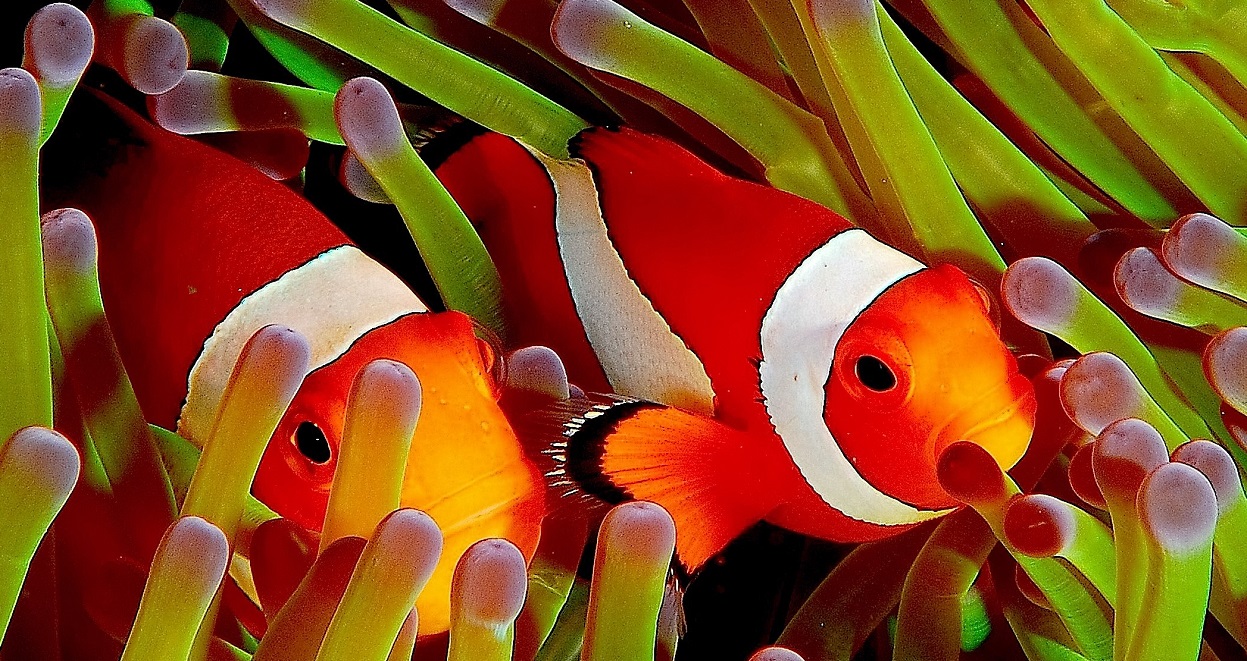
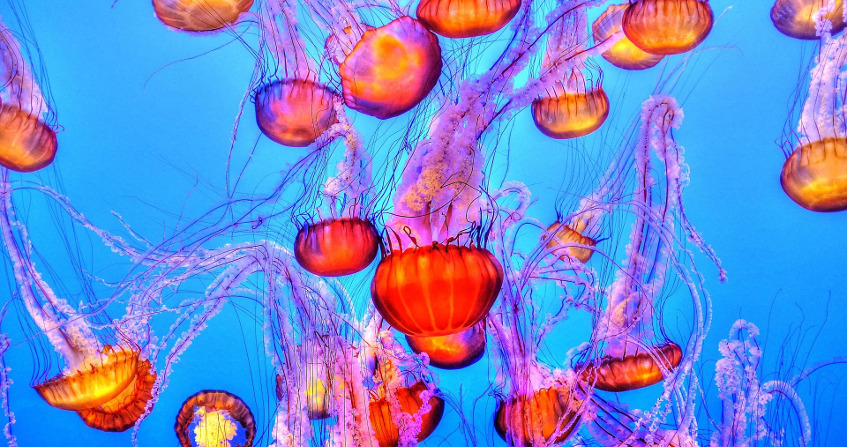
The ocean represents the largest continuous ecosystem on Earth, and the majority of its biomass is made up of organisms that are invisible to the naked eye: marine microorganisms, many of which make up “plankton”. The term “plankton” comes from the Greek word planktos, or “wanderer”, and refers to organisms that live in the water column and are unable to swim against the current. Marine plankton is thus composed of protists (unicellular eukaryotes), bacteria, archaea, viruses, but also the larval stages of larger organisms, such as the larvae of fish or crustaceans (Figure 1).
Exploration of the global distribution of marine microbial communities and diversities became quantitative with the advent of high throughput DNA sequencing technologies in the mid-2000s, paving the way for large spatial scale sampling campaigns. Indeed, the distribution of plankton is highly dependent on abiotic factors, such as light, nutrients, turbulence, temperature, salinity or pH, as well as biotic factors, such as the presence of other organisms including predators or symbionts. Although the local abundance of plankton varies horizontally, vertically and seasonally, planktonic organisms are present throughout the oceans.
The importance of plankton on a global scale is manifold:
- Plankton are at the base of food chains and they account for 50% of the annual primary productivy (photosynthesis) on Earth [1].
- Plankton metabolism plays a major role in the major biogeochemical cycles of carbon, oxygen, nitrogen, phosphorus and sulphur.
- The ocean is also a formidable pump that absorbs nearly 30% of the carbon dioxide emissions (a greenhouse gas) caused by human activities, in particular thanks to phytoplankton that capture carbon dioxide during photosynthesis (See A carbon cycle disrupted by human activities).
2. The Tara Oceans Expedition
- Tara Arctic (2006-2008) during two years of drifting on the ice pack, scientists onboard the schooner collected data on the atmosphere, the ice and the ocean. Caught in the ice for 504 days, Tara reached the northernmost position ever reached by a ship (excluding icebreakers): 88°32’10” N.
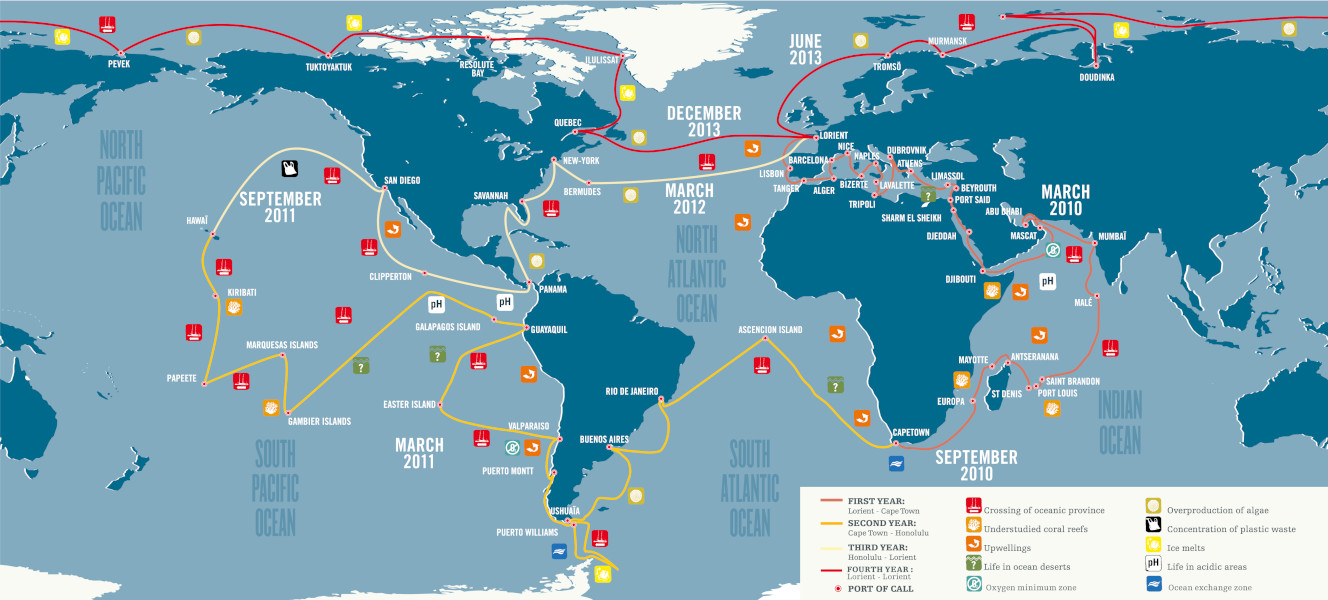
- Tara Oceans (2009-2013) made it possible to carry out a study of unprecedented scope on plankton, during a 140,000 kilometre journey across all the oceans of the planet. The Tara Oceans Polar Circle expedition was also part of the Tara Oceans project, a 6-month mission around the Polar Circle and the first in history to pass through the Northeast and Northwest Passages during the same year.
- Tara Méditerranée (2014) assessed the impact of micro-plastics on the health and functioning of ecosystems in the Mediterranean.
- Tara Pacific (2016-2018) explored the potential for resistance, adaptation and resilience of coral reefs in the face of global change.
- Tara Microplastics (2019) travelled the 4 European sea fronts and took samples from the 9 main European rivers to trace the origins of plastic pollution.
A total of 40,000 seawater and plankton samples were collected from 210 stations in 20 biogeographic provinces. Many questions animated this expedition:
- What is the extent of plankton diversity in our oceans?
- Which organisms carry out the most important functions?
- What are the effects of environmental parameters and biotic interactions on the ocean ecosystem?
In order to answer these questions, the Tara Oceans expedition brought together more than 250 scientists from around the world and carried out highly standardized sampling for more than three years on the 36-metre-long schooner.
The Tara Oceans project used many new technologies and analytical tools to establish the first global data collection effort that couples biogeography, ecology, genetics and morphology, bringing together an international community of scientists from many different disciplines: marine ecologists, microbiologists, oceanographers, statisticians, biogeochemists, computer scientists, and evolutionary biologists.
The standard sampling programme was designed to study a wide variety of marine ecosystems: upwellings, biodiversity hotspots, low pH or oxygen-poor zones, etc. A total of 210 stations were defined (Figure 3) on which a more precise environmental characterisation was conducted in order to contextualise the morphological and genetic sampling of plankton.
3. Main principles of sampling
- The first is the surface water layer (SUR), defined as the layer three to seven metres below the surface.
- The second is the so-called “deep chlorophyll maximum” (DCM) layer, which corresponds to the zone of maximum abundance of photosynthetic plankton, determined by measuring the chlorophyll concentration by fluorimetry. The existence of this maximum can be explained by a compromise between the two conditions necessary for phytoplankton growth: the presence of light and the supply of nutrients from cold deep water.
- The third sampling was carried out in the so-called “mesopelagic” zone, below the DCM and where light from the surface no longer passes, on average at a depth of 700 metres.
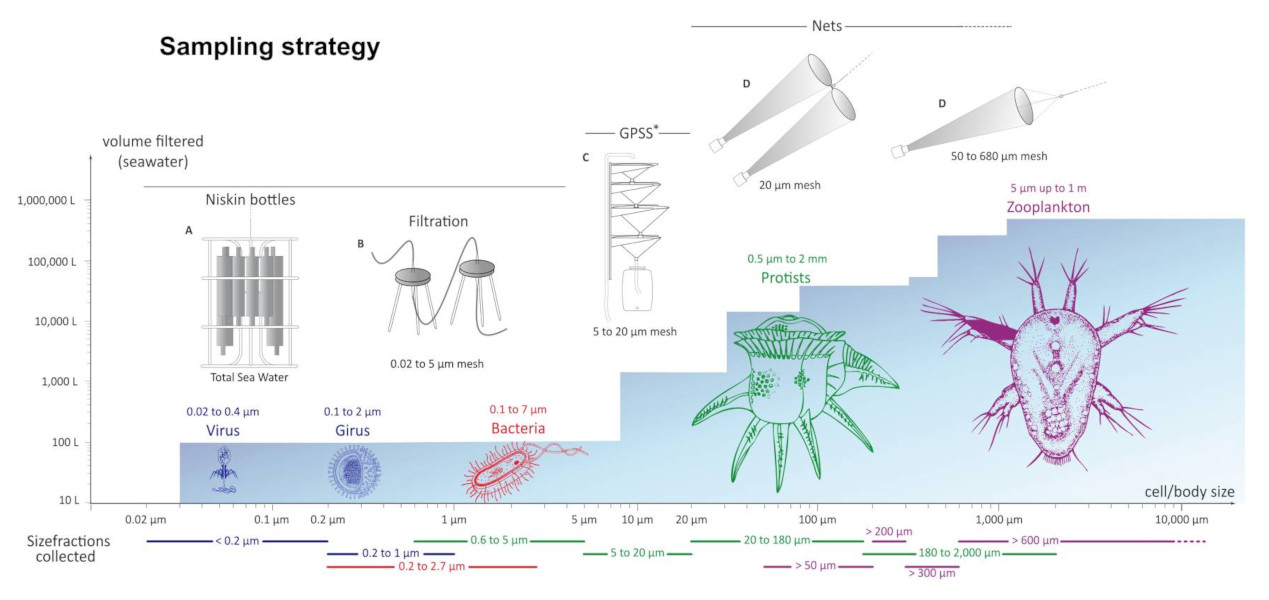
For each station, sampling was done on several organism size fractions (Figure 4) [2].
The plankton collected during the Tara Oceans expedition covers six orders of magnitude in terms of size that correspond to :
- Viruses and giant viruses (also known as giruses) (See Focus Ocean Viruses);
- prokaryotes (bacteria and archaea);
- unicellular eukaryotes (protists, fungi and microalgae);
- multi-cellular eukaryotes (such as copepods).
Unicellular eukaryotes measure between 0.8 and 2000 microns. Nets of appropriate mesh sizes were used to create several size fractions: 0.8-5 microns, 5-20 microns, 20-180 microns, 180-2000 microns.
Video 1: Tara Oceans (with photo below): plankton sampling. Plankton filtration (GPSS).
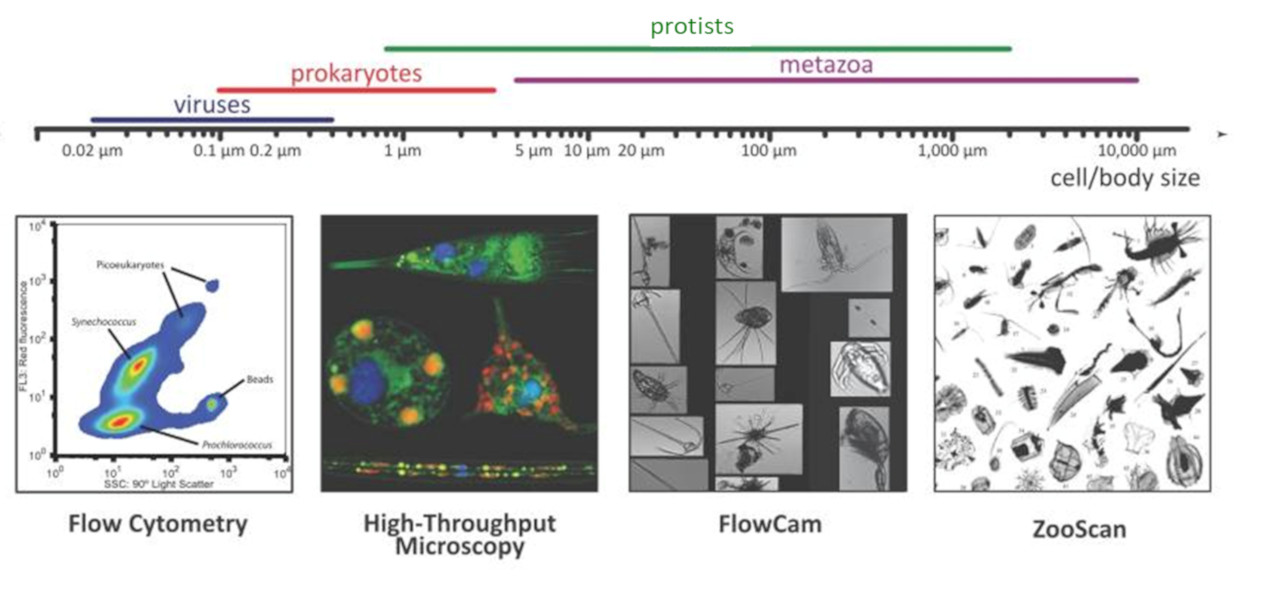
- On the one hand, automated recognition systems, such as the FlowCam [3] and the ZooScan [4], have enabled quantitative measurements of the biodiversity of organisms ranging from 20 microns to a few centimetres.
- On the other hand, 3D confocal microscopy and transmission electron microscopy have enabled detailed ultra-structural analyses of small protists.
4. Analysis of the genetic diversity of plankton
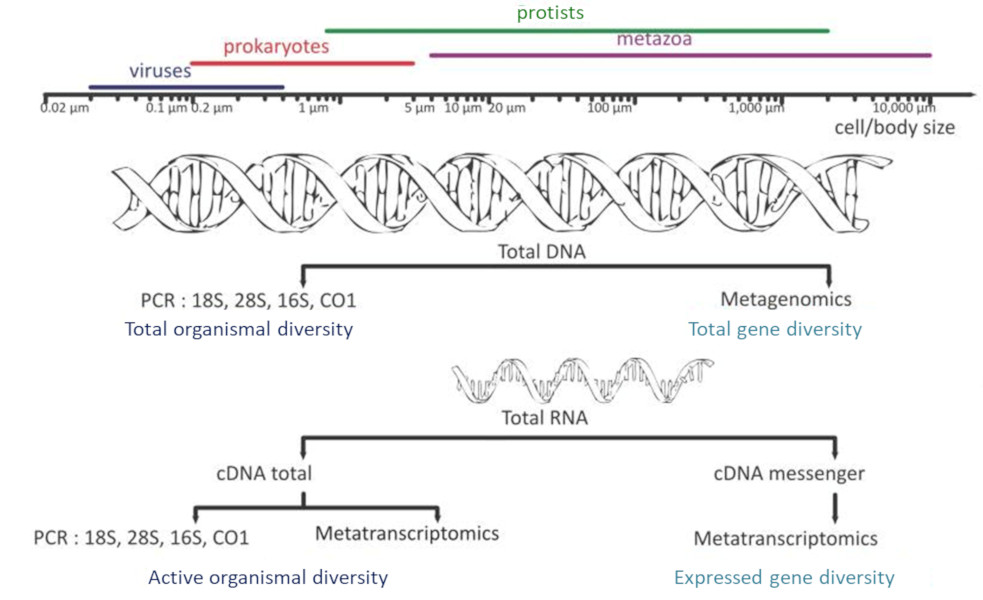
- Sequencing of 16S and 18S rDNA (metabarcoding), the genes encoding ribosomal RNA: Who’s there?
- Metatranscriptomics: Determination of all the RNAs produced – the transcriptome – by the different organisms collected during the process of transcribing a gene into a protein: What do they do?
- Metagenomics: characterization of all the genes present in the environmental sample: Who can do what?
The prefix “meta” added to the terms “barcoding”, “transcriptomics” and “genomics” expresses the idea that these molecular analyses are performed not on a single species but on a set of species from environmental samples. High-throughput DNA sequencing [5],[6] has opened the door to exploring, both qualitatively and semi-quantitatively, the genetic diversity of environmental samples.
4.1. Who’s there?
The exploration of the genetic diversity of samples was based on the use of different molecular technologies.
Molecular barcoding (DNA barcoding). The phylogeny of microorganisms has long been based on morphological and biochemical characteristics. Recently, molecular markers (barcodes) have been used to reconstruct the evolutionary history of living organisms, based on the – simplified – idea that the further apart two organisms are evolutionarily, the greater the difference between their genomic sequences.
Strictly speaking, a DNA barcode is a short sequence (typically 100 to 400 base pairs) corresponding to a standard portion of the genome (e.g. 18S ribosomal DNA), which can be used to identify species, such as a barcode used in the supermarket that allows the relationship between the product (the sequence) and its price (the identification of the species) to be made (See: DNA barcode to characterize biodiversity). This sequence is chosen on the basis of precise criteria [7]:
- intra-species variability must be low: this sequence must be almost identical in all organisms of the same species;
- inter-species variability must be high so that two different species can be differentiated on the basis of their sequence.
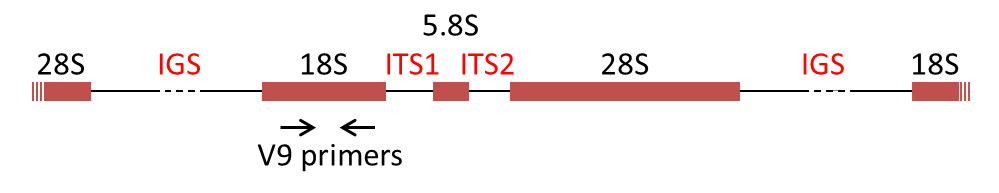
The most commonly used DNA molecular markers for phylogenetic reconstruction are the genes encoding the rRNAs of the ribosomal subunits, the rDNAs. In the majority of eukaryotes, 18S rRNA is present in the small ribosomal subunit, while the large subunit contains three rRNA molecules (5S, 5.8S, 28S in mammals and 25S in plants). The genes encoding the rRNAs are often grouped in a cluster, separated by internal transcribed spacers (ITS1 and ITS2) and an intergenic spacer (IGS) (Figure 7) [8].
Metabarcoding. The impact of barcoding as a molecular tool goes far beyond a higher resolution phylogeny of known species: conservation, species discovery, and community ecology benefit from it [9],[10]. With the advent of high-throughput sequencing, molecular barcoding (DNA barcoding) has become a widespread tool for the ecology of eukaryotic (and prokaryotic!) communities through a method known as metabarcoding.
More formally, DNA metabarcoding refers to the automated identification of multiple species from a single sample containing whole organisms, or an environmental sample containing degraded DNA (from soil, water, faeces, etc.) [11]. A good barcode for a molecular metabarcoding study (such as 18S rDNA) should :
(i) correspond to a portion of nearly identical genes within individuals of the same species, but which differ between species;
(ii) be usable for all species considered in the study;
(iii) allow taxonomic assignment at different taxonomic levels [6].
Once extracted, the sample DNA is amplified by PCR (polymerase chain reaction). PCR is a technique that allows a specific DNA (or RNA) sequence to be duplicated in large numbers (with a multiplication factor of the order of a billion) from:
- a small amount (of the order of a few picograms) of nucleic acid;
- specific nucleotide primers called “universal” primers, such as the sequence called V9 [12], which makes it possible to specifically amplify the selected portion of DNA (the amplicon, for example, 18S rDNA) of all the organisms present.
The final PCR product obtained after amplification is therefore a mixture of all the V9 sequences of the organisms in the test sample.

In a second step, each of the copies is then sequenced: we thus obtain the whole diversity of the V9 sequences of our sample (Figure 8) [13]. Sequences showing a sufficient degree of similarity are grouped into operational taxonomic units (OTU) [14]. The threshold of 97% similarity of DNA sequences is often used. A species must then be matched to each OTU.
This taxonomic assignment is made by comparing the OTU of the sample with databases of reference organisms. The idea is to see which known sequence the OTU is closest to, and in what proportion. The degree of similarity will give with some degree of certainty a species, genus, or family name: if a OTU has a sequence 100% identical to a species with a known name, it is assigned the identity of that species.
But sometimes the sequences are not similar enough, so identifications can only be made at the genus level and not at the species level.
The only snag is that more than 40% of the OTUs determined from the Tara Oceans expedition are totally new and do not correspond to any known species. We simply know that they are Eukaryotes but it is almost impossible to place them in a phylogenetic tree. Exciting!
4.2. Who does what?
![]()
To specifically study eukaryotic transcripts, it is possible to select only eukaryotic-specific mRNAs (Figure 9) [16],[17]. These mRNAs are then retrotranscribed in the presence of a reverse transcriptase: the complementary DNAs obtained are sequenced and their sequences compared with those present in reference databases, which can make it possible to specify both a functional (which genes do these transcripts come from, what can they be used for?) and taxonomic (from which organisms do these transcripts come from?) annotation. This is the “who does what”, detailed in Carradec et al [17].
4.3. Who can do what?
Today, and mainly for the prokaryotic domain, genomic analyses focus on whole genome sequencing, or metagenomics [18]. Instead of using specific PCR primers (see Metabarcoding above), all the genomes in the environmental sample are then sequenced.
- The first step, after extraction of the DNA, is to fragment all the DNAs present in the sample into very short pieces and then sequence them; this is called shotgun sequencing or random sequencing.
- Subsequently, the sequenced fragments are assembled bioinformatically from the overlapping regions to reconstruct the original genomes.
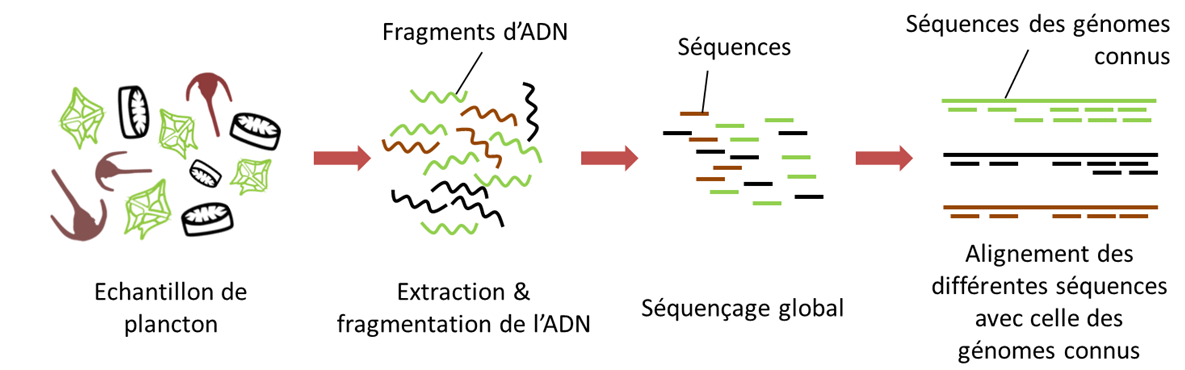
The “metagenomic” sequencing thus accounts for all the genes not expressed but present in the sample. This type of sequencing provides information on the genetic potential of the community of organisms in the sample, it is the “who can do what”, but does not necessarily do it. This approach with huge potential faces many technical limitations.
At the time of the Tara Oceans expedition, the size of DNA fragments that could be sequenced at high throughput was just over 500 base pairs. If we consider, for example, the genome of a diatom (abundant phytoplankton), which is at least 30 million base pairs long, this means that at least 60,000 DNA fragments must be sequenced to reconstitute this complete genome (Figure 10). In practice, analyses are never carried out on a single individual, but from a mixture of DNA fragments from different individuals.
In reality, it is not possible to limit ourselves to sequencing 60,000 fragments at random, because otherwise some parts of our diatom genome will have been sequenced several times, but others not at all, and the reconstructed genome will therefore have “holes”. Overlapping fragments of DNA are also needed to reconstruct the sequence order.
To overcome this problem, we sequence the equivalent not of a single genome (60,000 fragments) but, for example, of twenty genomes (or 1,200,000 fragments!).

Coupled with quantitative imagery, these high-throughput sequencing approaches allow not only an understanding of the structure, location and function of genes, but also, and most importantly, an exploration of the diversity of plankton. Using powerful methods based on bioinformatics, these analyses provide data on the evolution, metabolism and interactions between organisms (See: Focus The ocean’s biological carbon pump), and enable the reconstruction of community metabolomes, gene and organism networks, and models of the spatial distribution of species (Figure 11).
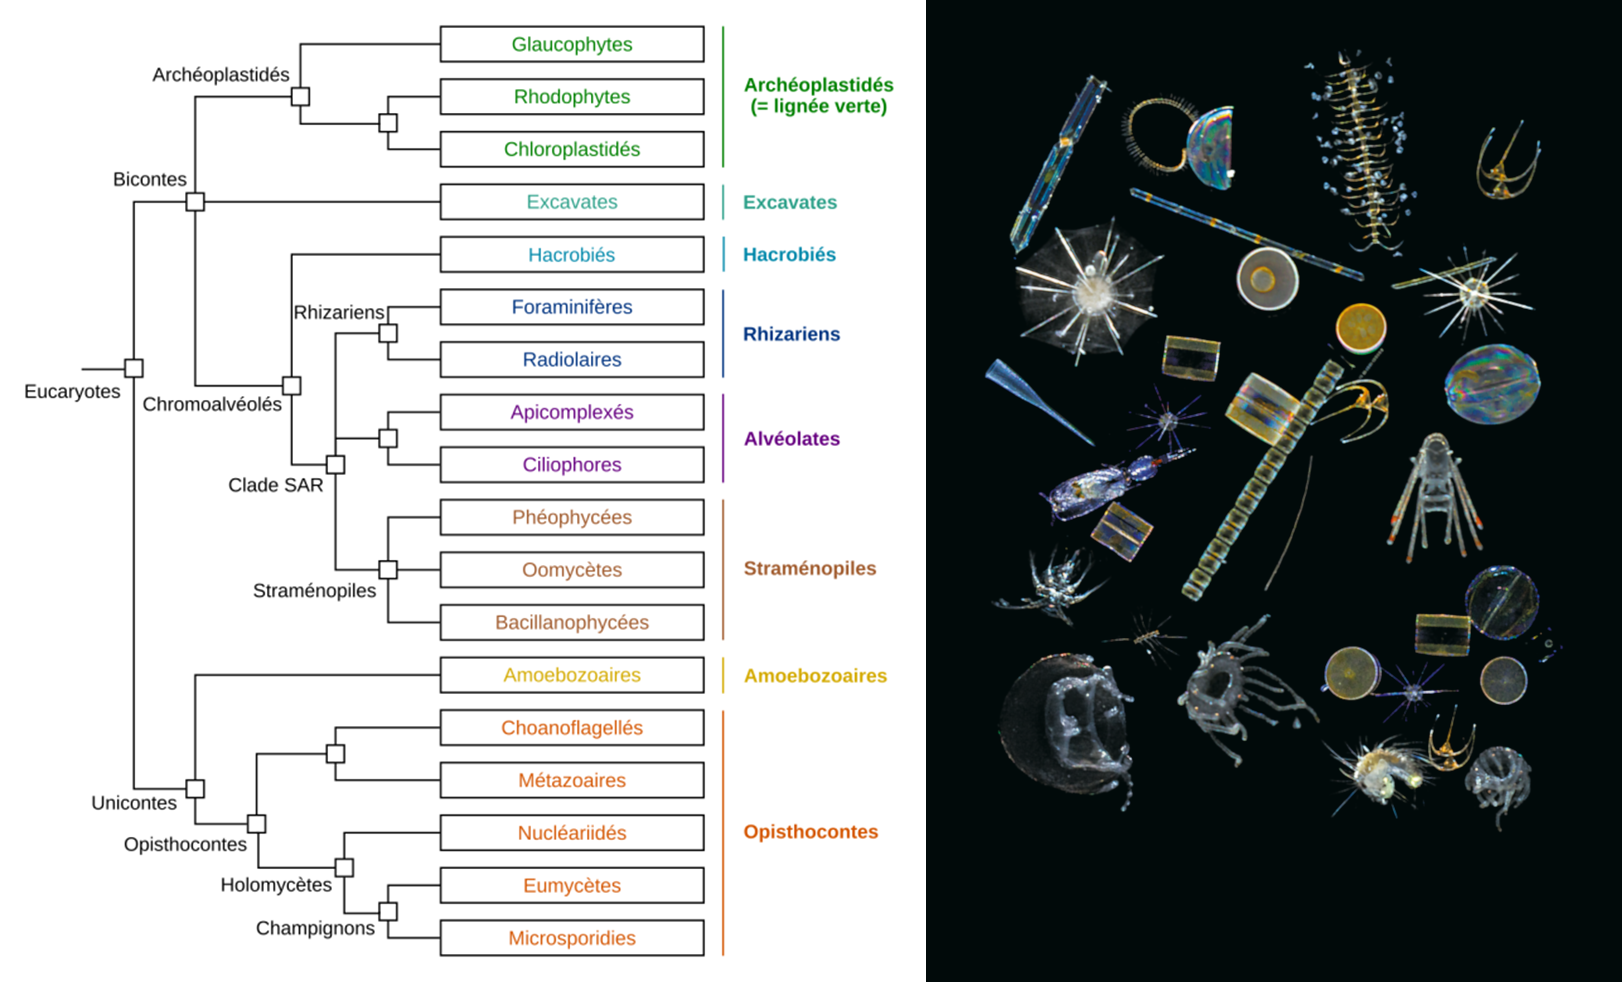
5. Unsuspected diversity: plankton protists
- Presentation of Tara Oceans results at the “Maison des Océans”
In this study, researchers deciphered and analyzed nearly one billion ribosomal DNA sequences from only 46 sampling sites. These sequences are used as markers of eukaryotic biodiversity (See What is biodiversity? and Biodiversity is not a luxury but a necessity), from the smallest unicellular organisms (<1 micron) to planktonic animals a few millimetres in size [22].
The large quantity of genetic barcodes generated made it possible first of all to characterize almost all the eukaryotic species of plankton in the photic zone analysed. 150,000 genetic types of eukaryotic plankton were identified, which represents an unsuspected diversity compared to the 11,000 species described so far. It appeared that the vast majority of the genetic types listed have no close reference in current genetic databases, demonstrating that these organisms are mostly unrecorded and uncultivatable. One third of the genetic diversity could not be associated with any of the major eukaryotic lines recognized today.
Among the genetic types that can be classified in the tree of eukaryotic life, most have been found to correspond to unicellular or protist organisms, with a phenomenal diversity of parasites, symbiotic species, and predators of all kinds. Photosynthetic organisms were much less diverse, smaller, and would represent a much lower biomass.
To date, more than 100 publications have resulted directly from the analysis of the data generated by the Tara Oceans expedition, including five founding articles that were the subject of a special “Tara Oceans” issue of the journal Science in 2015 (query of the ISI Web of Science database over the period 2009-2019 using the terms “Tara Oceans” alone; October 2, 2020).
6. Messages to remember
- After three years of sailing around the globe, the researchers of the Tara Oceans expedition carried out the most exhaustive study of plankton possible and made it possible to take an overall picture of the world’s planktonic ecosystem.
- This work has led to the discovery of 150 million marine genes, 100,000 genetically-defined species and the determination of the distribution factor of planktonic communities from more than 40,000 seawater samples. In particular, they revealed an unsuspected diversity in protists (single-celled eukaryotic organisms).
- More than 100 scientific publications in leading journals are a direct result of the analysis of the data generated by the Tara Oceans expedition. These data are freely available to all scientists in public databases.
- In parallel with these research activities, the Tara Oceans project also aimed to raise public awareness of the issues related to climate change, through numerous workshops, on-board visits, educational tools available on their website and validated by scientists.
- The science thus generated was also put at the service of climate governance: as a special observer at the UN, the Tara Oceans expedition mobilized political decision-makers at the highest level.
Initial scientific organisation of Tara Oceans: Eric Karsenti, EMBL, Scientific Director, Etienne Bourgois Director of Tara Expeditions, Romain Troublé Secretary General of Tara Expeditions – Stephanie Kandels Lewis (EMBL) & Didier Velayoudon (DVIP consulting) Operational Managers
Tara Oceans scientific coordinators: This interdisciplinary and international group developed the sampling strategy and overall plan, set the overall expedition and project objectives, led the expedition and carried out most of the analysis of the results over the past ten years. See reference [23].
Notes and References
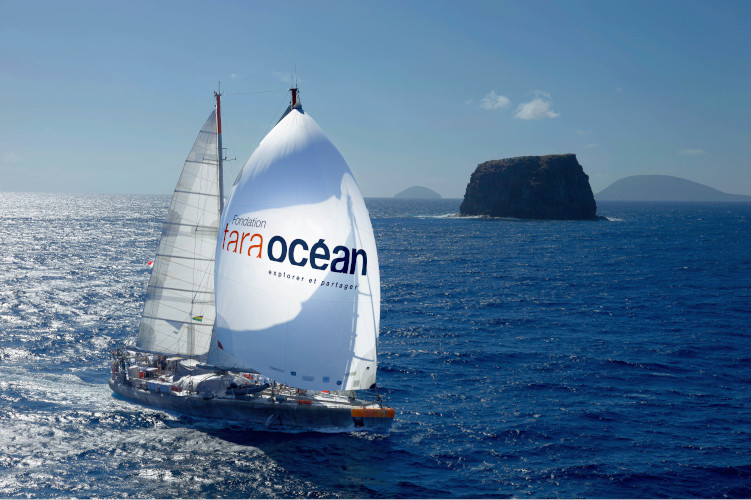
Cover image. [Source: Photo © G.Bounaud_C.Sardet_La Niak_Fondation Tara Océan]
[1] Field CB. 1998. Primary production of the biosphere: integrating terrestrial and oceanic components, Science 281, 237-240.
[2] Water samples preserved with paraformaldehyde were used for high-resolution microscopy.
[3] FlowCam https://www.embrc-france.fr/fr/prestation/flowcam
[4] ZooScan https://www.embrc-france.fr/fr/prestation/zooscan
[5] DNA and RNA from plankton collected during the Tara Oceans expedition were anaysed at the National Sequencing Centre – Genoscope. Created in 1996 to participate in the Human Genome project and to develop genomics programs in France. It then set its sights on environmental genomics and metagenomics.
[6] Dardel F. & Képès F., 2002, Bioinformatics: genomics and post-genomics, Éditions de l’École Polytechnique 153-180 p. (ISBN 978-2-7302-0927-4, read online).
[7] Valentini A, Pompanon F, Taberlet P. 2009. DNA barcoding for ecologists, Trends in Ecology & Evolution, 24, 110-117.
[8] Zagoskin M, Lazareva V, Grishanin A & Mukha D. 2014. Phylogenetic information content of Copepoda ribosomal DNA repeat units: ITS1 and ITS2 impact. BioMed Research International, 926342. https://doi.org/10.1155/2014/926342
[9] Kress WJ, Erickson DL, Uriarte M & Garcı C. 2015. DNA barcodes for ecology, evolution, and conservation. Trends in Ecology & Evolution, 30, 25-35.
[10] Bucklin A, Lindeque PK, Rodriguez-Ezpeleta N, Albaina A & Lehtiniemi M. 2016. Metabarcoding of marine zooplankton: prospects, progress and pitfalls. Journal of Plankton Research, 38, 393-400.
[11] Taberlet P, Coissac E, Pompanon F, Brochmann C & Willerslev E. 2012. Towards next generation biodiversity assessment using DNA metabarcoding, Molecular Ecology, 21, 2045-2050.
[12] By comparing the already known 18S rDNA sequences between various organisms, a region called V9 was identified. It is 130 base pairs long and its ends are highly conserved in all known organisms. The ends of this sequence can therefore serve as an anchor point for primers during PCR.
[13] Villar E. et al (2015) Environmental characteristics of Agulhas rings affect interocean plankton transport. Science DOI:10.1126/science.1261447
[14] Blaxter M, Mann J, Chapman T, Thomas F, Whitton C., Floyd R & Eyualem A. 2005. Defining operational taxonomic units using DNA barcode data. Philosophical Transactions of the Royal Society B: Biological Sciences, 360, 1935-1943.
[15] Messenger RNA or mRNA is a transient copy of a portion of DNA corresponding to one or more genes. The mRNA is used as an intermediary by cells for protein synthesis. In a cell, the mRNA population corresponds to the expressed genes and is then translated into proteins.
[16] These are so-called polyadenylated mRNAs: they present in the 3′ part of a tail made of a succession of adenosines, absent in prokaryotes (see ref [6]).
[17] Carradec Q. et al. 2018. A global ocean atlas of eukaryotic genes. Nature Communications 9, 1038.
[18] Sacha Schutz Introduction to metagenomics
[19] Assembly consists of aligning and/or fusing DNA or RNA fragments from a longer sequence in order to reconstruct the original sequence using bioinformatics tools. The problem of assembly can be compared to the problem of reconstructing the text of a book from several copies of the book, previously shredded into small pieces.
[20] Genome annotation involves analyzing the nucleotide sequence that constitutes the raw information to extract the biological information. It makes it possible, on the one hand, to locate genes and coding regions and, on the other hand, to identify or predict their biological function (this is functional annotation). These two steps are initially based on the use of sophisticated algorithmic tools, the development of which is one of the fields of bioinformatics.
[21] Lecointre G & Le Guyader H. 2016. Classification phylogénétique du vivant – Tome 1, Éditions Belin, Collection Nature, 584 pp. (in french)
[22] by Vargas C, Audic S, Henry N, Decelle J, Mahe F, Logares R, Lara E, Berney C, Le Bescot N, Probert I, Carmichael M, Poulain J, Romac S, Colin S, Aury JM, Bittner L, Chaffron S, Dunthorn M, Engelen S, Flegontova O, Guidi L, Horak A, Jaillon O, Lima-Mendez G, Lukes J, Malviya S, Morard R, Mulot M, Scalco E, Siano R, Vincent F, Zingone A, Dimier C, Picheral M, Searson S, Kandels-Lewis S, Acinas SG, Bork P, Bowler C, Gorsky G, Grimsley N, Hingamp P, Iudicone D, Not F, Ogata H, Pesant S, Raes J, Sieracki ME, Speich S, Stemmann L, Sunagawa S, Weissenbach J, Wincker P & Karsenti E. 2015. Eukaryotic plankton diversity in the sunlit ocean. Science, 348, 1261605.
[23] Scientific coordinators Tara Oceans:
Silvia Acinas, Department of Marine Biology and Oceanography, Institut de Ciències del Mar (CSIC), Barcelona, Catalonia, Spain.
Peer Bork, Structural and Computational Biology, European Molecular Biology Laboratory, Meyerhofstr. 1, 69117 Heidelberg, Germany.
Emmanuel Boss, School of Marine Sciences, University of Maine, Orono, Maine 04469, USA.
Chris Bowler, PSL Research University, Institut de Biologie de l’Ecole Normale Supérieure (IBENS), CNRS UMR 8197, INSERM U1024, 46 rue d’Ulm, F-75005 Paris, France.
Colomban de Vargas, CNRS, UMR 7144, EPEP & Sorbonne Universités, UPMC Université Paris 06, Station Biologique de Roscoff, 29680 Roscoff, France.
Mick Follows, Department of Earth, Atmospheric and Planetary Sciences, Massachusetts Institute of Technology, Cambridge, MA, USA.
Gaby Gorsky, Sorbonne, UPMC Université Paris 06, CNRS, Laboratoire d’oceanographie de Villefranche (LOV), Observatoire Océanologique, 06230 Villefranche-sur-Mer, France.
Nigel Grimsley, CNRS, UMR 7232, BIOM, Avenue du Fontaulé, 66650 Banyuls-sur-Mer, France.
Pascal Hingamp, Aix Marseille Univ, Université de Toulon, CNRS, IRD, MIO, Marseille, France.
Daniele Iudicone, Stazione Zoologica Anton Dohrn, Villa Comunale, 80121 Naples, Italy.
Olivier Jaillon, Genoscope, Institut de biologie François Jacob, Commissariat à l’Energie Atomique (CEA), CNRS, Université Evry, Université Paris-Saclay, Evry, France
Lee Karp-Boss, School of Marine Sciences, University of Maine, Orono, Maine 04469, USA.
Uros Krkic, Cell Biology and Biophysics, European Molecular Biology Laboratory, Meyerhofstrasse 1, 69117 Heidelberg, Germany.
Fabrice Not, CNRS, UMR 7144, Sorbonne Universités, UPMC Université Paris 06, Station Biologique de Roscoff, 29680 Roscoff, France.
Hiroyuki Ogata, Institute for Chemical Research, Kyoto University, Gokasho, Uji, Kyoto, 611-001, Japan.
Stephane Pesant, MARUM, Center for Marine Environmental Sciences, University of Bremen, Bremen, Germany.
Jeroen Raes, Department of Microbiology and Immunology, Rega Institute, KU Leuven, Herestraat 49, 3000 Leuven, Belgium.
Emmanuel Reynaud, Earth Institute, University College Dublin, Dublin, Ireland.
Christian Sardet, Sorbonne Université UPMC Université Paris 06, CNRS, Laboratoire d’oceanographie de Villefranche (LOV), Observatoire Océanologique, 06230 Villefranche-sur-Mer, France.
Mike Sieracki, National Science Foundation, Arlington, VA 22230, USA.
Sabrina Speich, Laboratoire de Physique des Océans, UBO-IUEM, Place Copernic, 29820 Plouzané, France.
Lars Stemmann, Sorbonne, UPMC Université Paris 06, CNRS, Laboratoire d’oceanographie de Villefranche (LOV), Observatoire Océanologique, 06230 Villefranche-sur-Mer, France.
Matthew Sullivan, Department of Microbiology, The Ohio State University, Columbus, OH 43214, USA.
Shini Sunagawa, Structural and Computational Biology, European Molecular Biology Laboratory, Meyerhofstr. 1, 69117 Heidelberg, Germany.
Jean Weissenbach, Genoscope, Institut de biologie François Jacob, Commissariat à l’Energie Atomique (CEA), CNRS, Université Evry, Université Paris-Saclay, Evry, France
Patrick Wincker, Genoscope, Institut de biologie François Jacob, Commissariat à l’Energie Atomique (CEA), CNRS, Université Evry, Université Paris-Saclay, Evry, France
The Encyclopedia of the Environment by the Association des Encyclopédies de l'Environnement et de l'Énergie (www.a3e.fr), contractually linked to the University of Grenoble Alpes and Grenoble INP, and sponsored by the French Academy of Sciences.
To cite this article: VINCENT Flora, BOWLER Chris (January 5, 2025), The Tara Oceans expedition explores the diversity of plankton, Encyclopedia of the Environment, Accessed August 3, 2026 [online ISSN 2555-0950] url : https://www.encyclopedie-environnement.org/en/life/the-tara-oceans-expedition-explores-the-diversity-of-plankton/.
The articles in the Encyclopedia of the Environment are made available under the terms of the Creative Commons BY-NC-SA license, which authorizes reproduction subject to: citing the source, not making commercial use of them, sharing identical initial conditions, reproducing at each reuse or distribution the mention of this Creative Commons BY-NC-SA license.