Thermodynamics of a rising air parcel in a cumulonimbus
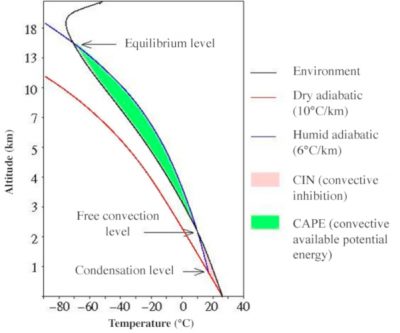
PDFTo understand why and up to what altitude the air rises in a storm, some thermodynamics concepts are necessary (see Pressure, temperature and heat). Consider an air parcel close to the ground, in an atmosphere characterized by a temperature profile typical of pre-storm conditions (black curve in the figure). If this parcel rises, it encounters an increasingly low pressure, so it expands. Since the air exchanges very little heat with the outside, this relaxation is practically adiabatic and this requires the temperature to decrease. In the altitude-temperature diagram in the figure, the air parcel follows the red curve, called dry adiabatic. This parcel of air cools more than the environment, thus becoming denser and is likely to sink again. But under certain conditions lifting processes, such as turbulence in the atmospheric boundary layer or certain phenomena of breezes observed on the coasts or in the mountains, provide sufficient energy to the air parcel to allow it to continue its ascent. As it cools, the amount of water vapour that the air is able to carry decreases, in accordance with the Clausius-Clapeyron relationship [1]. The excess water vapour then condenses into droplets from an altitude called the Lifting Condensation Level (LCL).
As a result, condensation releases latent heat, which heats the plot, which cools less than expected by the dry adiabatic. The plot follows the blue curve of the figure, called wet adiabatic. The temperature profile in the immediate environment may be such that the air parcel, when it exceeds a certain altitude, becomes warmer than its environment. This altitude is called the Level of Free Convection (LFC). The warmer and less dense air parcel then continues to rise under the influence of Archimedes’ force of buoyancy. This ascent continues until the parcel becomes colder than its surroundings, at an altitude called the Equilibrium Temperature Level (ETL). The parcel then slows down and eventually stops.

The green surface on the figure represents the positive energy, called CAPE (Convective Available Potential Energy), the air parcel can acquire between LFC and ETL. The larger the CAPE, the faster the air parcel rises. The pink surface represents a negative energy called CIN (Convective INhibition). This is the energy required to force the air parcel up to its free convection level. Under typical conditions before a storm, the atmosphere is conditionally unstable. This means that after providing the CIN to force the parcel to rise to NCL, the parcel is in an unstable position that allows it to rise without further energy input to the ETL.


