




Biomass of soil organisms
PDFSoil is probably the most species-rich habitat on the planet (see Soil biodiversity). From Arctic soils to deserts, from grasslands to temperate and Amazonian forests, every climate and terrestrial environment is home to unique communities. Bacteria, archaea, fungi, protists and animals form networks that break down organic matter, recycle nutrients and interact with plant roots. However, their biomass remains difficult to measure on a global scale. Dominated by microorganisms, it is concentrated mainly in the surface horizons, but extends well beyond a metre in depth.
1. Soil: a major habitat for living organisms
A review published in 2023 estimates that the soil is likely home to 59 ± 15 per cent of the planet’s species [1]. This proportion is higher than the 25 per cent estimate often cited previously, as it takes into account all major groups of living organisms and adopts a broad definition: species are considered to be soil-associated if they live in or on the soil, or if they complete part of their life cycle there [1]. The soil thus harbours organisms of extremely varied sizes and functions (Figure 1).
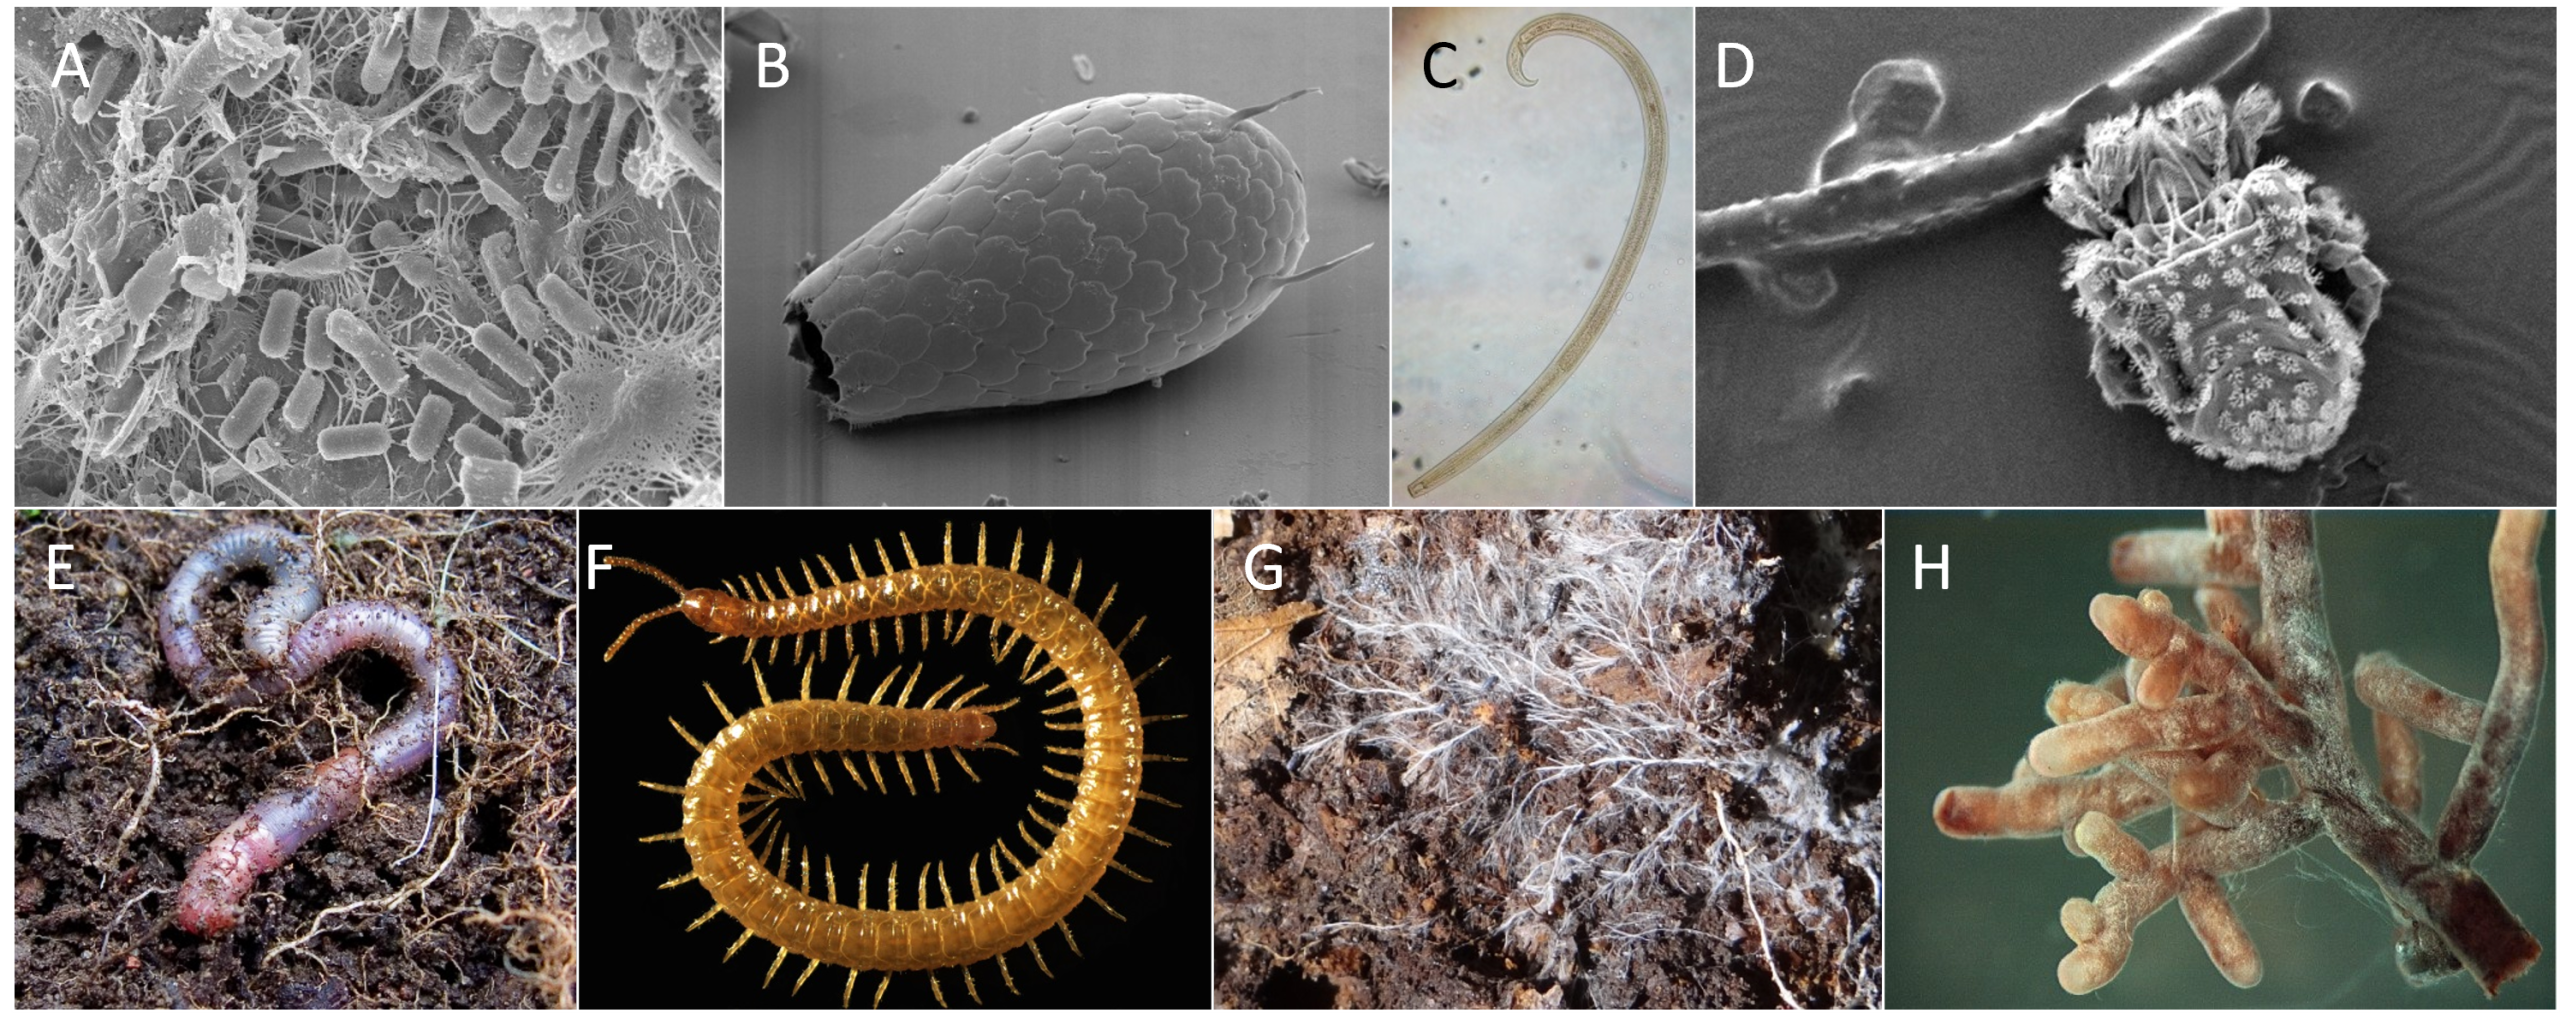
2. What exactly are we measuring?
Biomass is the mass of living organisms present at a given time. Globally, it is generally expressed in gigatonnes of carbon (Gt C), which allows for the comparison of organisms with vastly differing water content. [2]
In soil, biomass is distributed across three compartments:
- Living soil biomass: this comprises the microorganisms and animals living in the soil.
- Roots are also living and underground, but they are generally counted as part of plant biomass.
- Finally, litter and soil organic matter, consisting mainly of dead or decomposed plant material. The carbon in these should not be added to the living biomass.
This convention significantly alters the result. Excluding roots, the biomass of soil organisms is in the region of 20 to 25 Gt C in the global synthesis by Bar-On et al. Including living roots, which account for approximately 130 Gt C, the underground biomass is much higher. It is therefore always necessary to specify the scope of the analysis. [2]
3. Biomass dominated by microorganisms
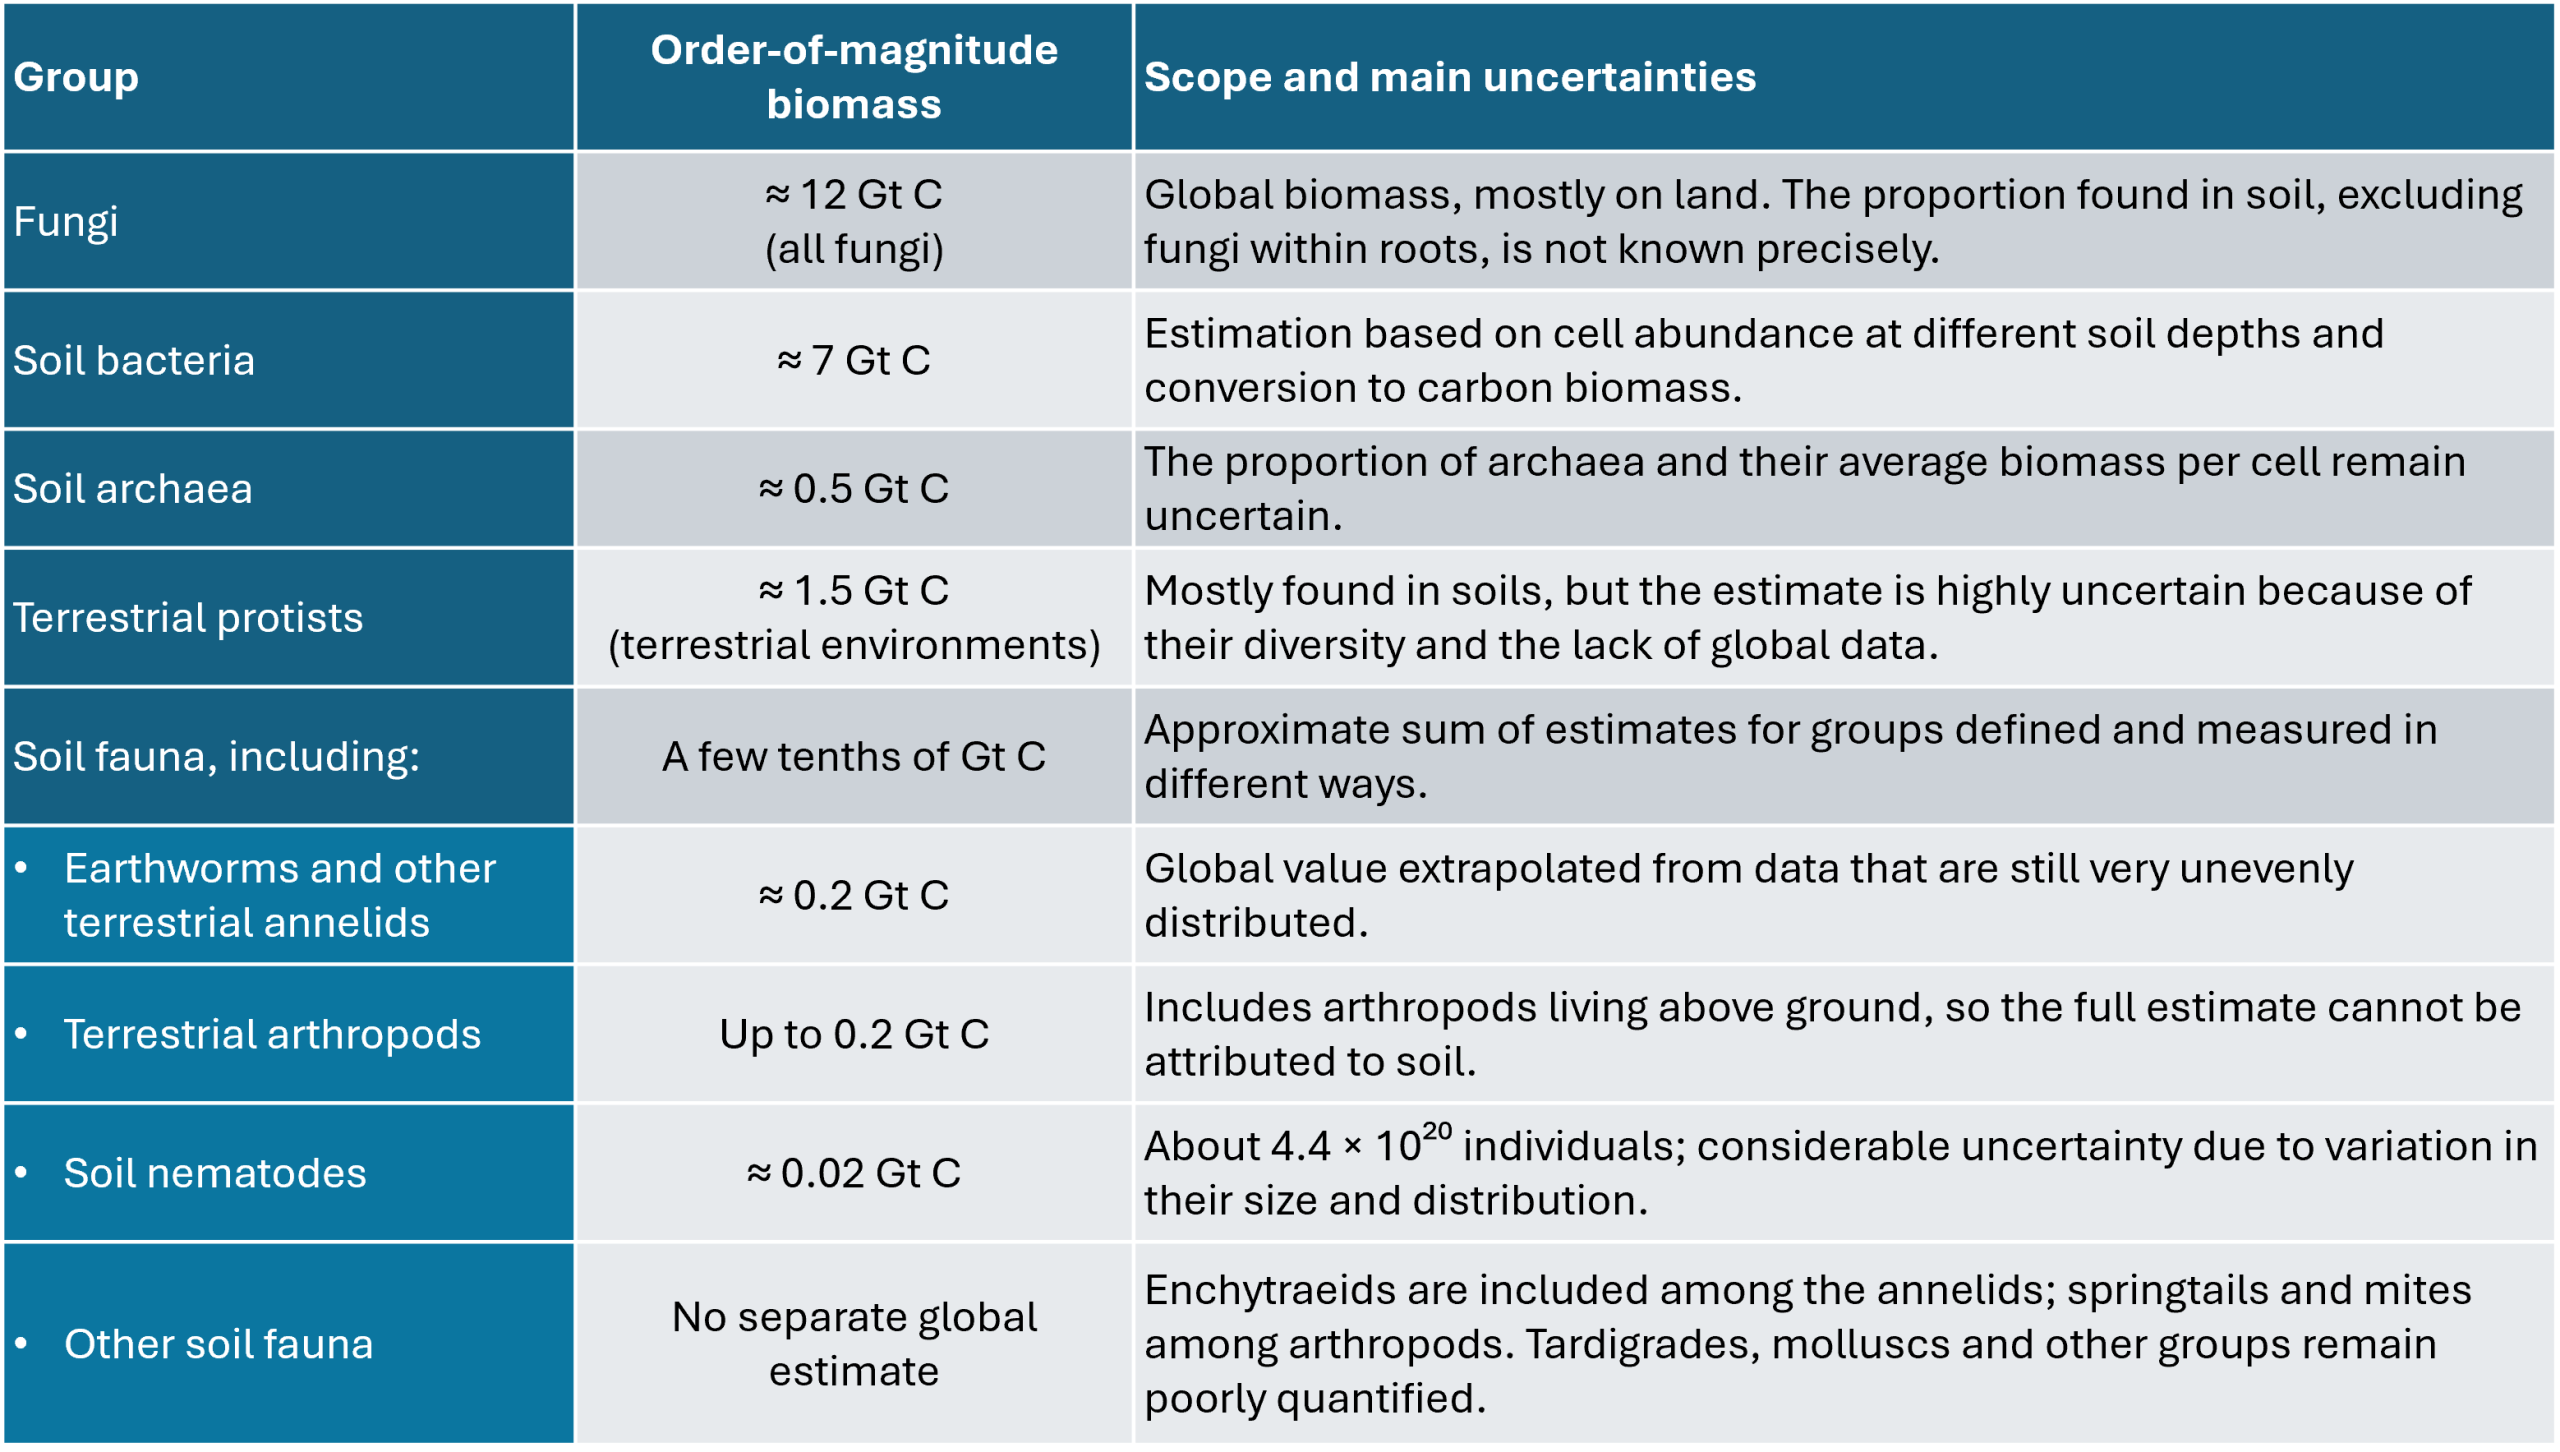
When roots are excluded, fungi, bacteria, archaea and protists constitute the bulk of living soil biomass. Global figures remain estimates of order of magnitude, as they are derived from scattered measurements and different conversion methods depending on the group. [2]
Table 1. Orders of magnitude of global biomass for the main groups of soil organisms, excluding roots. The figures are expressed in gigatonnes of carbon (Gt C). They provide orders of magnitude and do not all correspond to a strictly identical scope. For some groups, notably fungi and arthropods, the available estimates cover all terrestrial habitats; the proportion present in the soil remains only partially known. The values for the sub-categories should not be added together to obtain a precise total for soil fauna, as some estimates cover all terrestrial habitats and the scopes differ depending on the group. Plant roots are not included in these figures. According to Bar-On et al. (2018) [2] and van den Hoogen et al. (2019) [3].
4. Fungi and mycorrhizal symbioses
Fungal hyphae explore the pores in the soil, break down organic compounds and often form associations with roots. Ectomycorrhizae surround the root tips without penetrating the cells; they are found in only a few plant species, but are widespread in many boreal and temperate forests. Arbuscular mycorrhizae penetrate the cell walls of the root cortex. They are associated with around 70 per cent of plant species [4] and are particularly widespread in grasslands, savannahs, cultivated areas and many tropical forests. [5]
The global biomass of fungi is not limited to that of mycorrhizae. Previous estimates, based on work by Bar-On et al., attributed approximately 0.2 Gt C to ectomycorrhizal fungi and 0.15 Gt C to arbuscular mycorrhizal fungi, out of a total fungal biomass of approximately 12 Gt C [2]. A study published in 2026 provided the first spatially resolved global estimate of arbuscular mycelium. It is based on more than 16,000 soil cores from 322 studies, spread across 9 of the 14 biomes, and on machine learning models [4]. The authors estimate that the top 15 centimetres of soil contain approximately 300 ± 60 Mt C of living hyphae, or nearly 0.3 Gt C, which remains within the range of previous estimates but is double Bar-On’s figure. This represents around 2–3 per cent of soil fungal biomass.
The distribution is highly uneven. Grasslands account for around 40 per cent of this biomass. Cultivated soils have, on average, a hyphal density approximately 47 per cent lower than that of uncultivated soils, an effect consistent with the application of phosphate and nitrogen fertilisers and the use of fungicides. This estimate has its limitations: it relates solely to the living mycelium within the top 15 centimetres, and there remains considerable uncertainty in regions where sampling is limited, such as deserts, the tundra and certain temperate forests [4].
5. Abundant but less massive fauna
5.1. Soil arthropods
A global synthesis published in 2023 compiled several thousand estimates of soil arthropod biomass from around 500 sites, spanning numerous biomes, from tropical forests to deserts. The authors standardised measurements of density, dry mass and abundance, then extrapolated these to the area of the different habitats. They thus estimate the dry biomass of soil arthropods at approximately 200 million tonnes, with an uncertainty range of 100 to 400 million tonnes, equivalent to approximately 0.1 Gt C after conversion [6]. Their number is estimated to be around 1019 individuals, with an estimated range of 0.5 ×10¹⁹ to 2 ×10¹⁹.
However, the number of individuals and the biomass do not paint the same picture:
- Mites and springtails (see Collembola: actors of soil life) account for over 95 per cent of individuals, of which around two-thirds are mites.
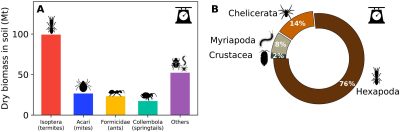
Figure 3. Taxonomic distribution of the dry biomass of soil arthropods. A, contribution of the main groups; B, distribution amongst the major subphyla. [Source: Rosenberg et al. [6]; article distributed under a CC BY 4.0 licence.] - Termites, which are much heavier, alone account for nearly 40 per cent of the biomass of soil arthropods.
- Ants, springtails and mites each account for around 10 per cent (Figure 3A).
- Hexapods thus account for nearly 76 per cent of this biomass, ahead of chelicerates (14 per cent), myriapods (8 per cent) and crustaceans (2 per cent) (Figure 3B) [6].
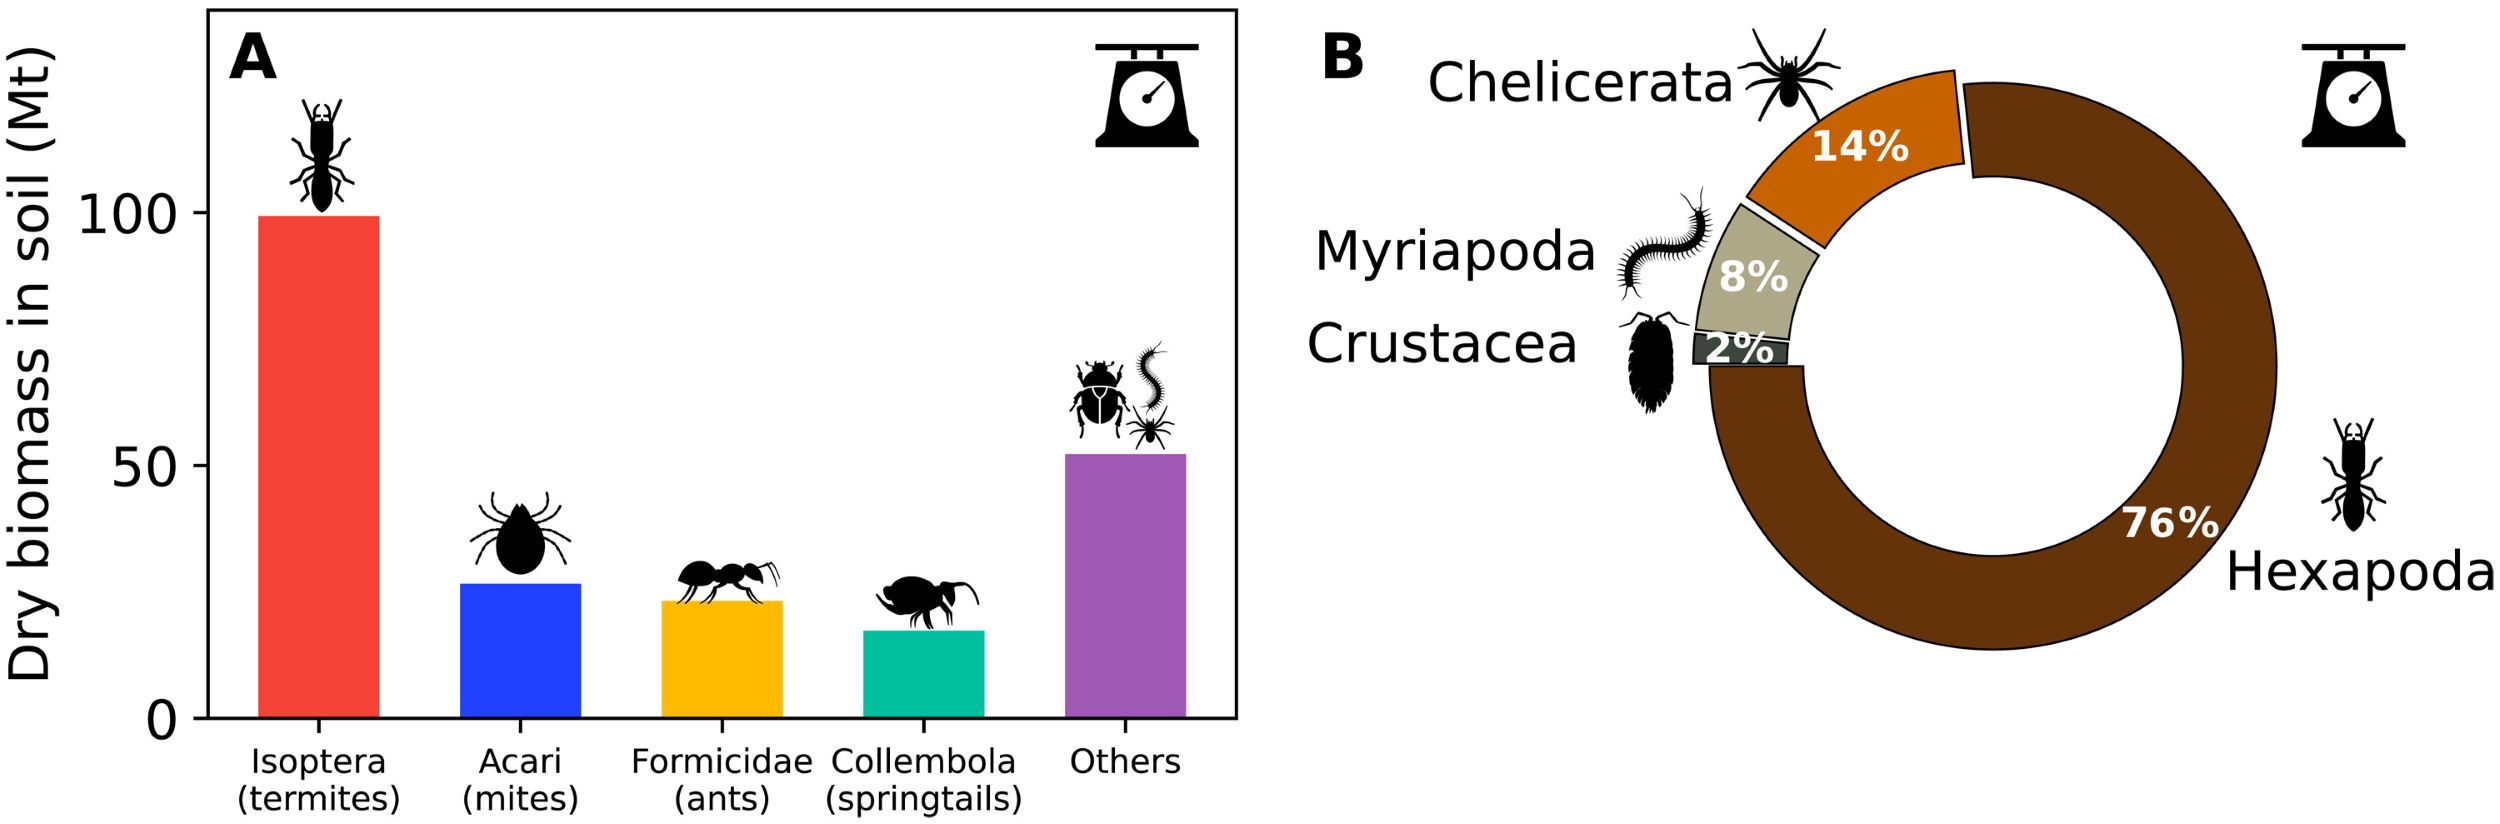
The dry biomass of all terrestrial arthropods, including those found in vegetation and litter, is estimated at around 300 million tonnes, or nearly 0.15 Gt C. This total should therefore not be confused with that of soil-dwelling arthropods alone. Furthermore, the biomass of these animals remains far lower than that of soil microorganisms, although their ecological functions are significant [2],[6].
5.2. Nematodes, earthworms and other animals
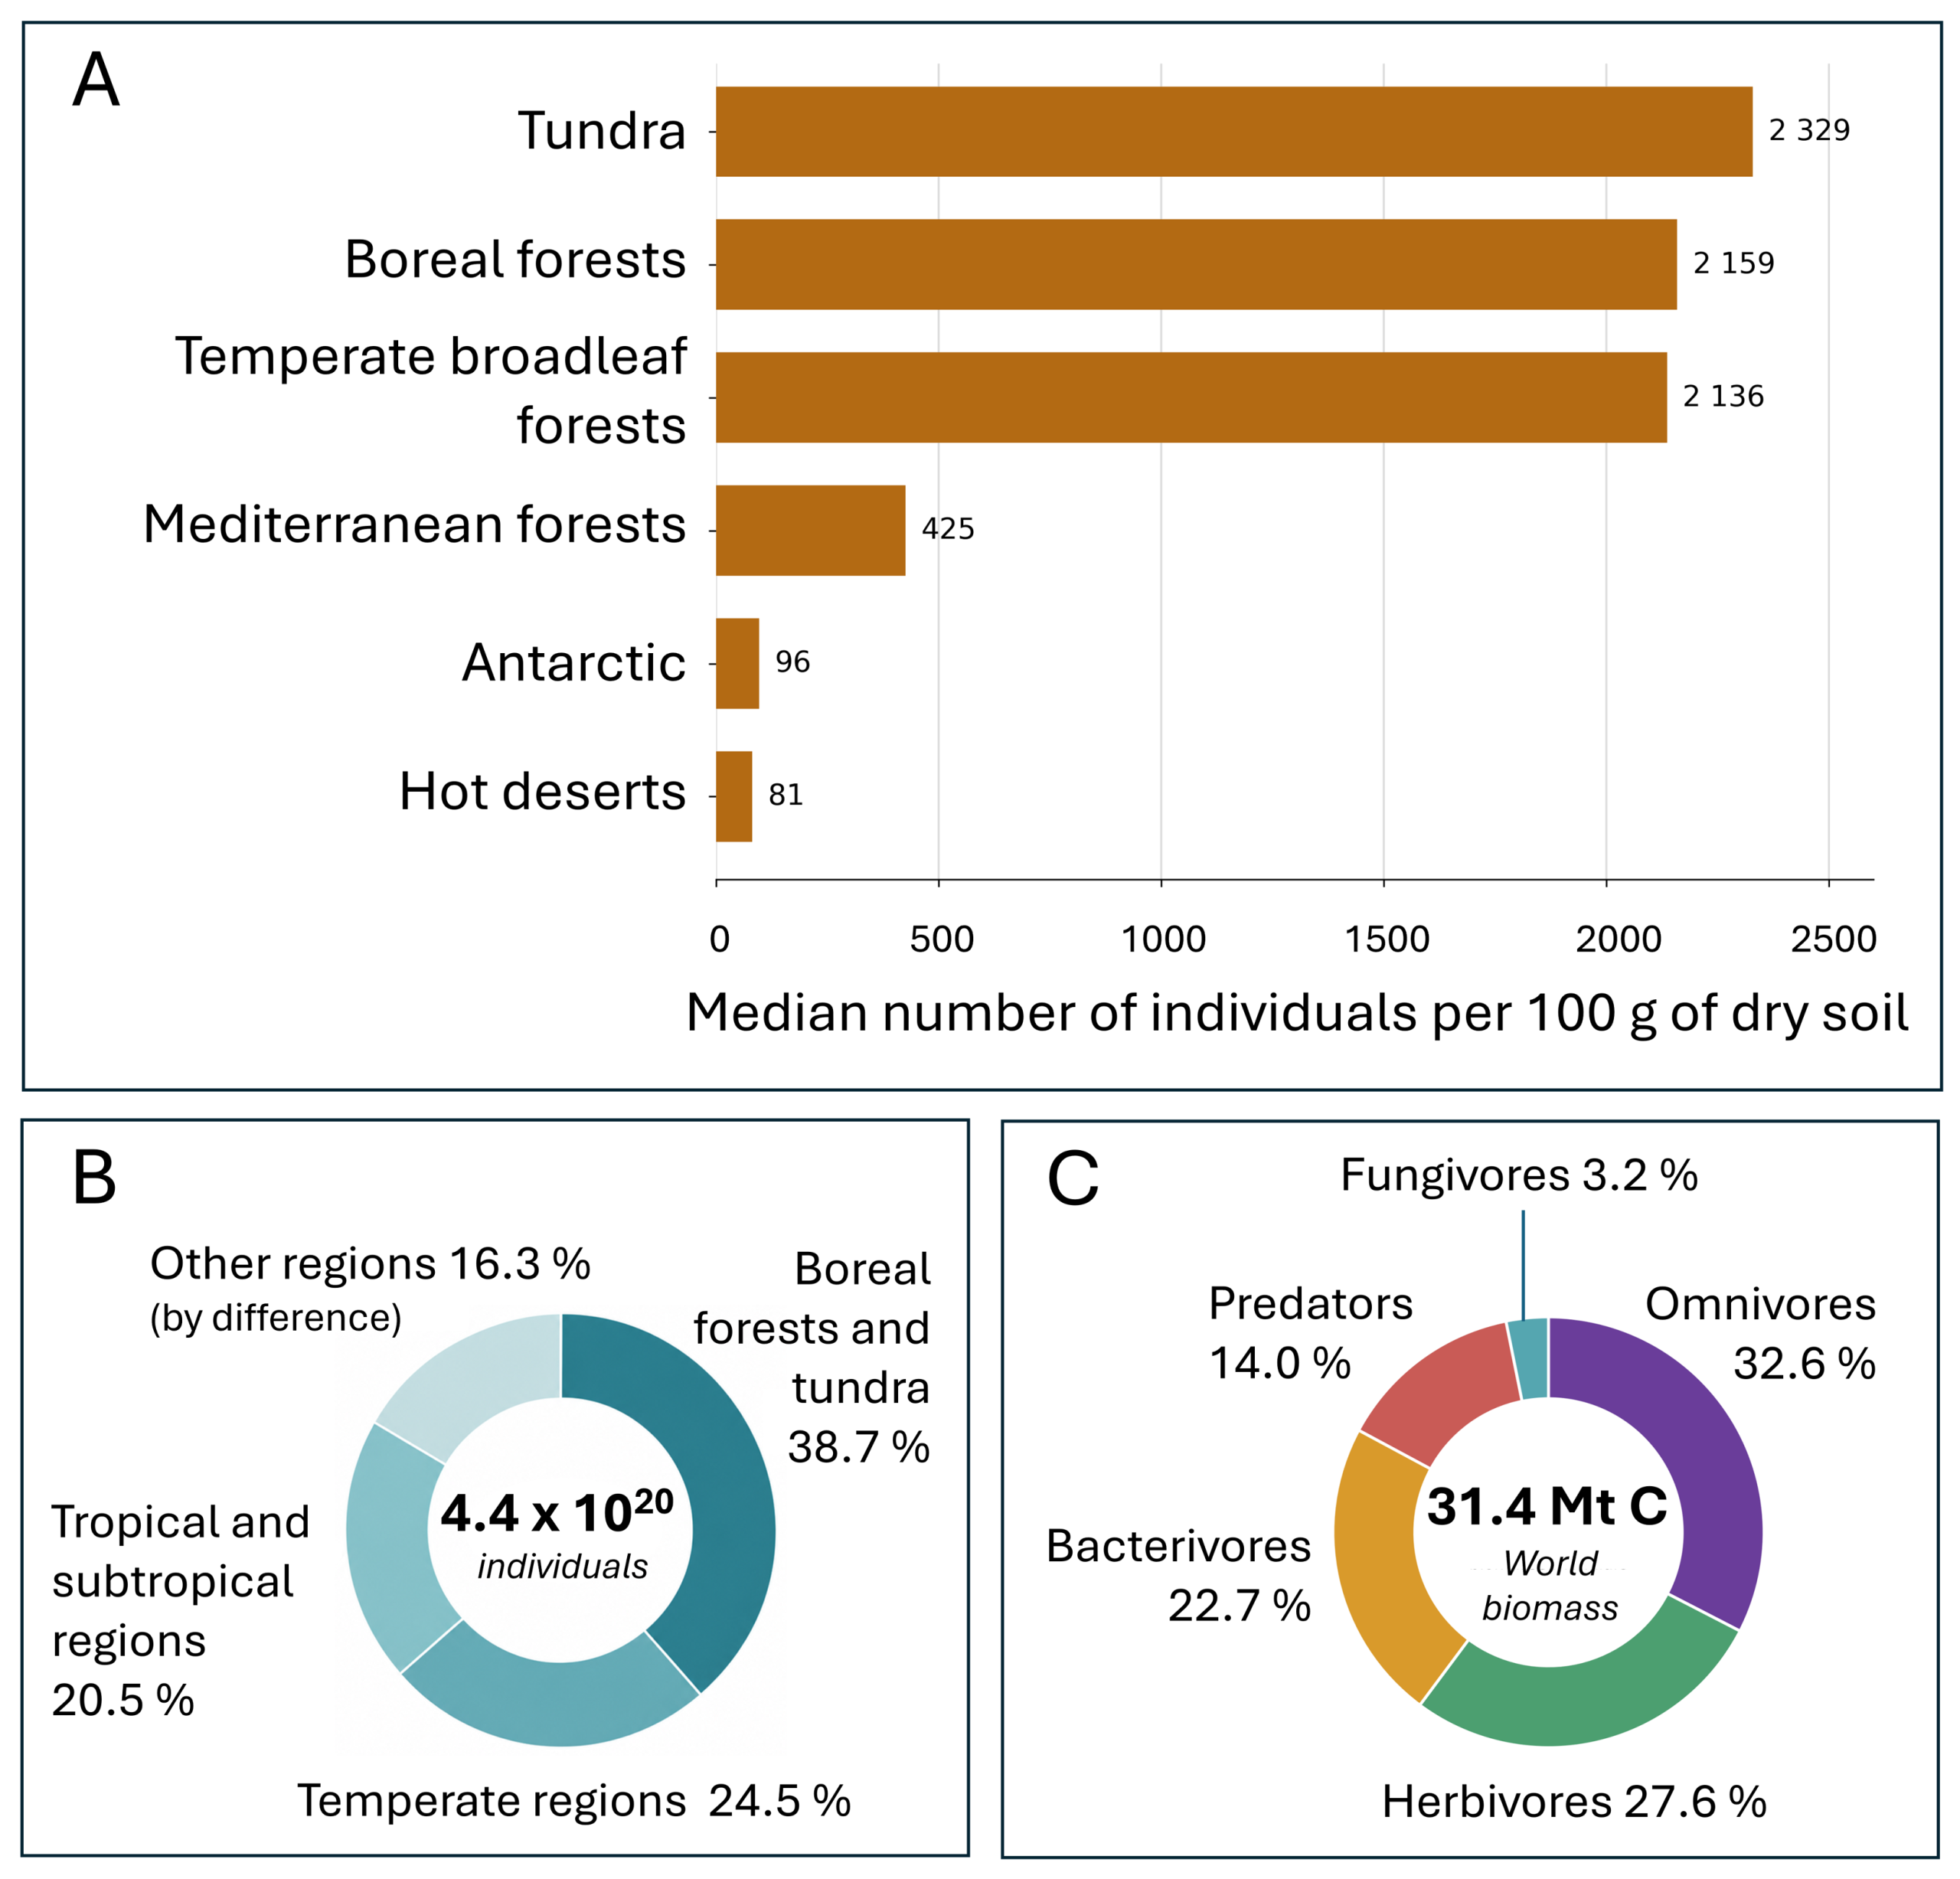
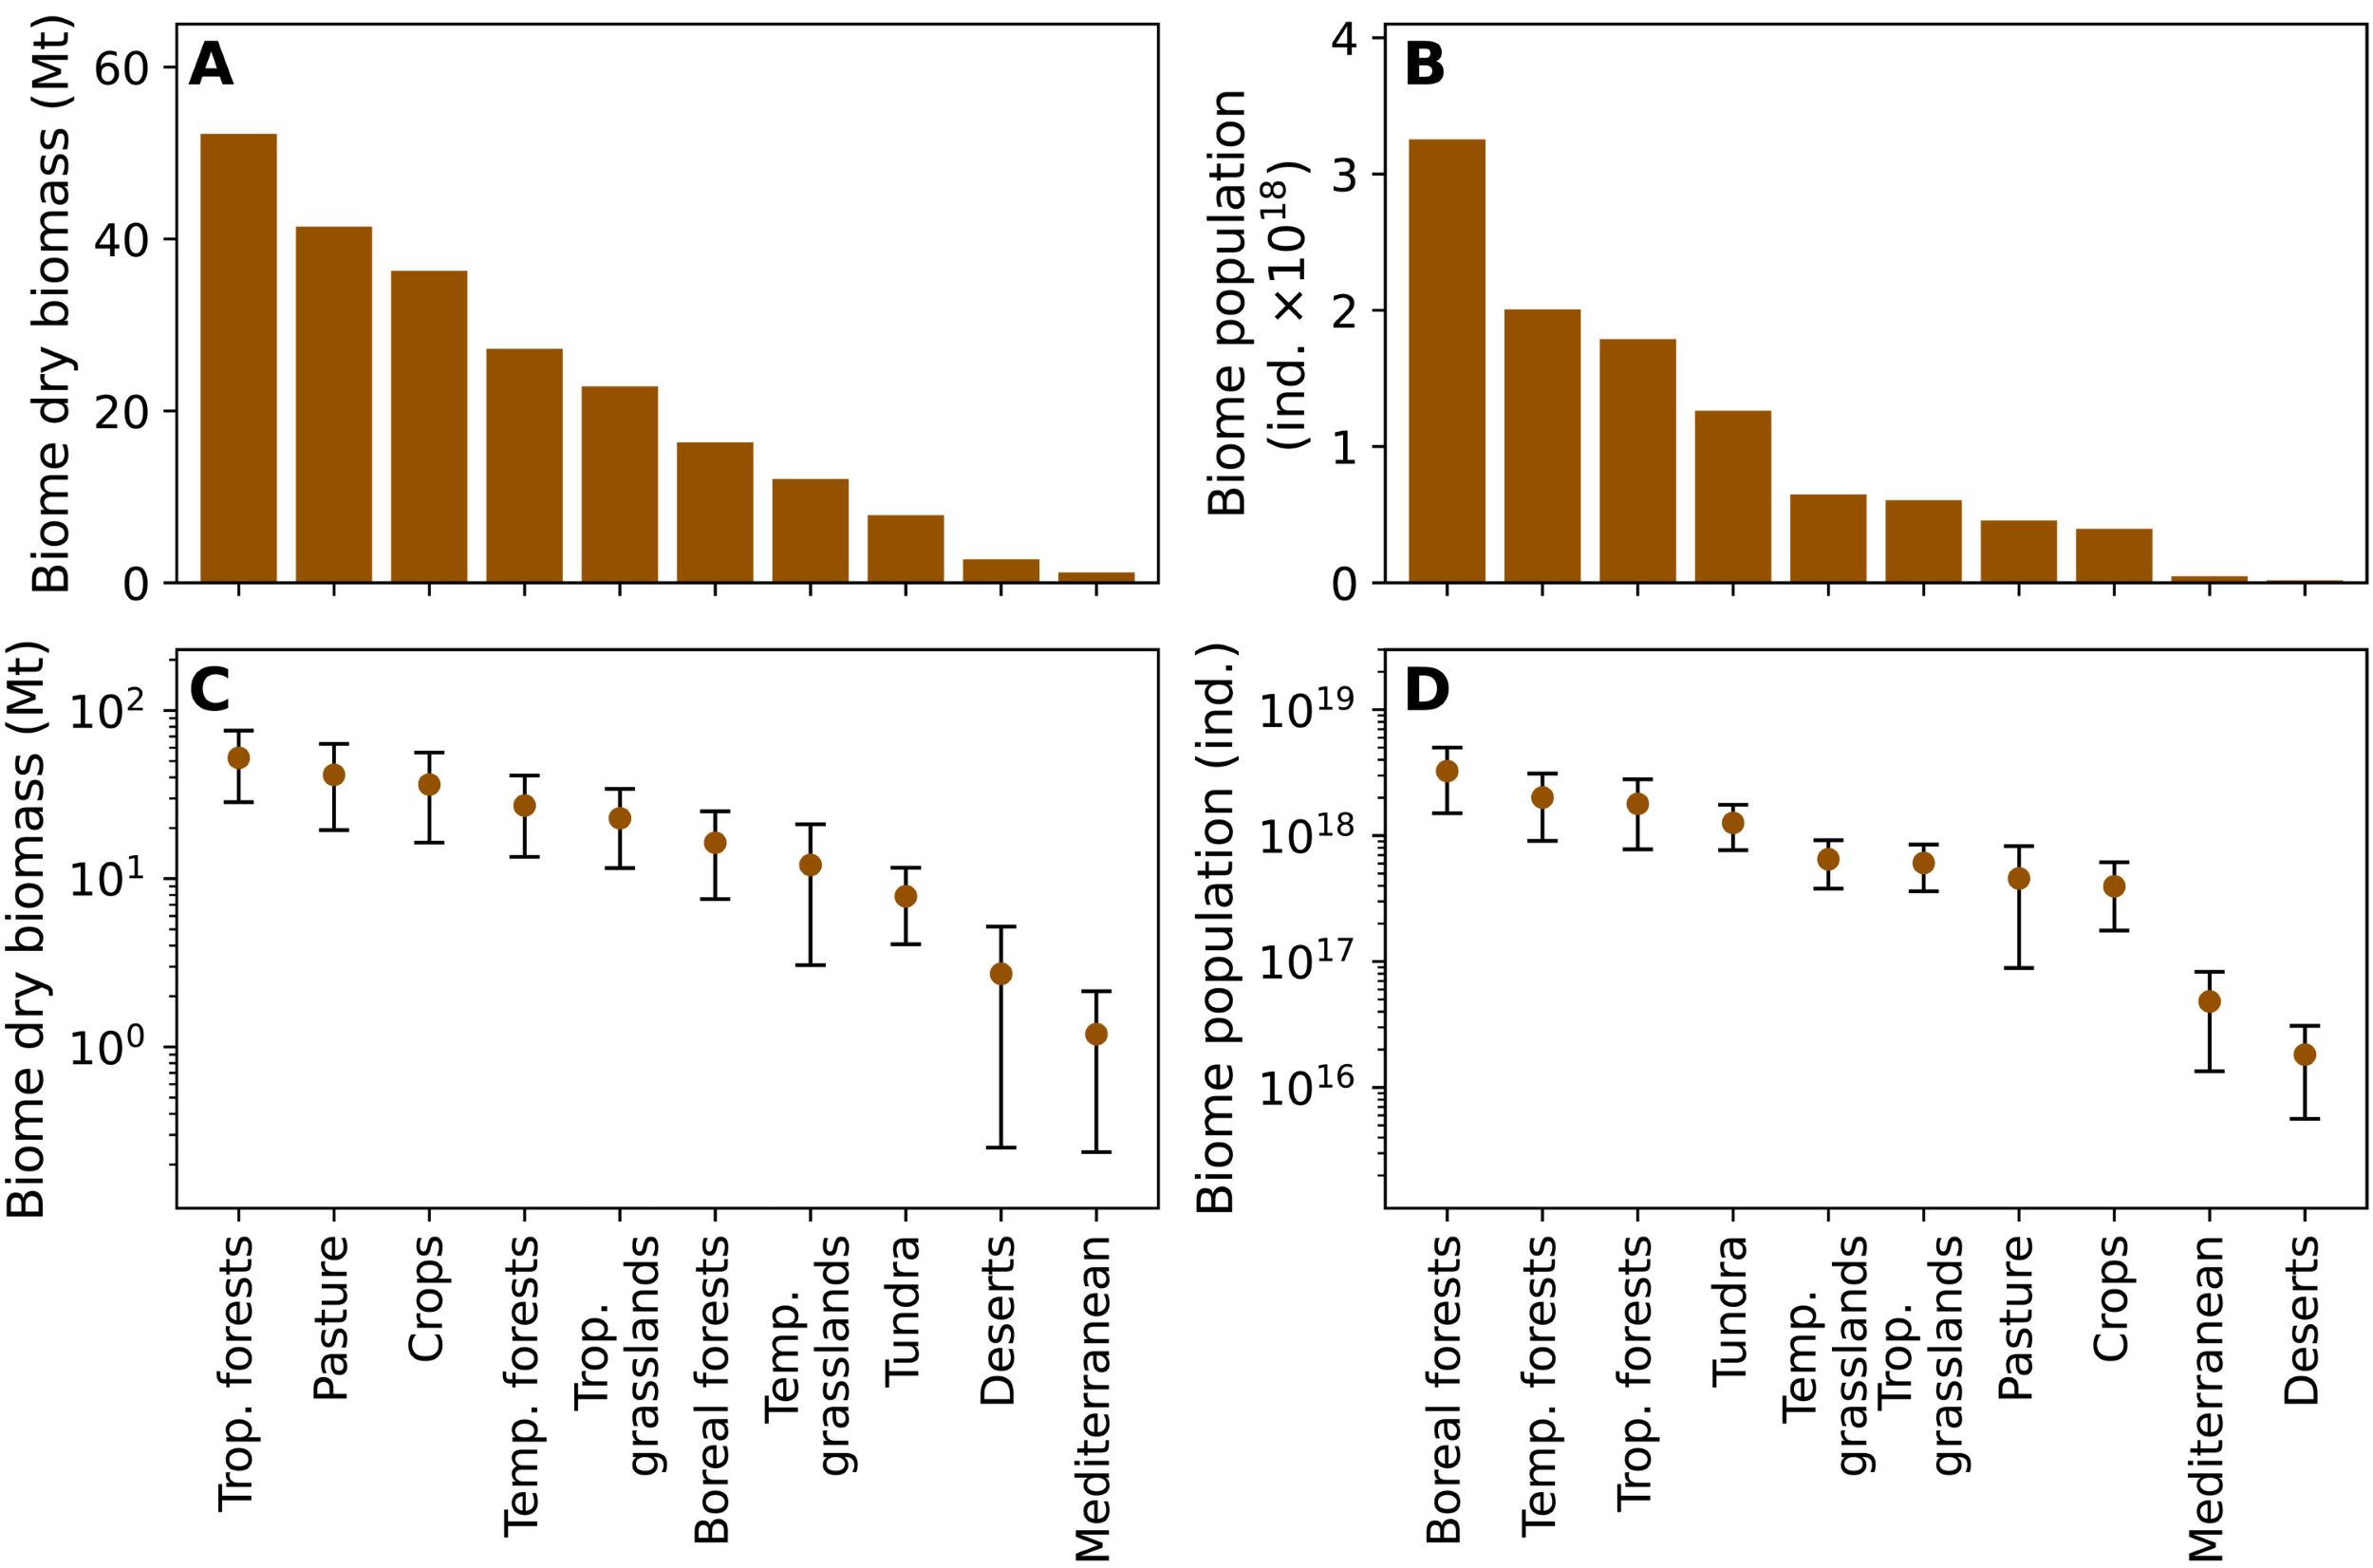
The distribution is not uniform (Figure 4): boreal forests and the tundra are home to particularly high populations, whilst deserts cover a vast area but generally have low local densities. Nematodes occupy various positions in the food web: they are bacterivores, fungivores, herbivores, omnivores and predators. Biomass alone therefore does not reflect their ecological importance. Organisms of modest mass can control microbial communities, accelerate nutrient recycling or transfer carbon to higher trophic levels [3],[5].
Earthworms are far less numerous, but their individual mass is much greater. Their global biomass has been estimated at around 0.2 Gt C [2]. Their distribution across soils is, however, highly variable. [7]
6. Biomass decreases with depth
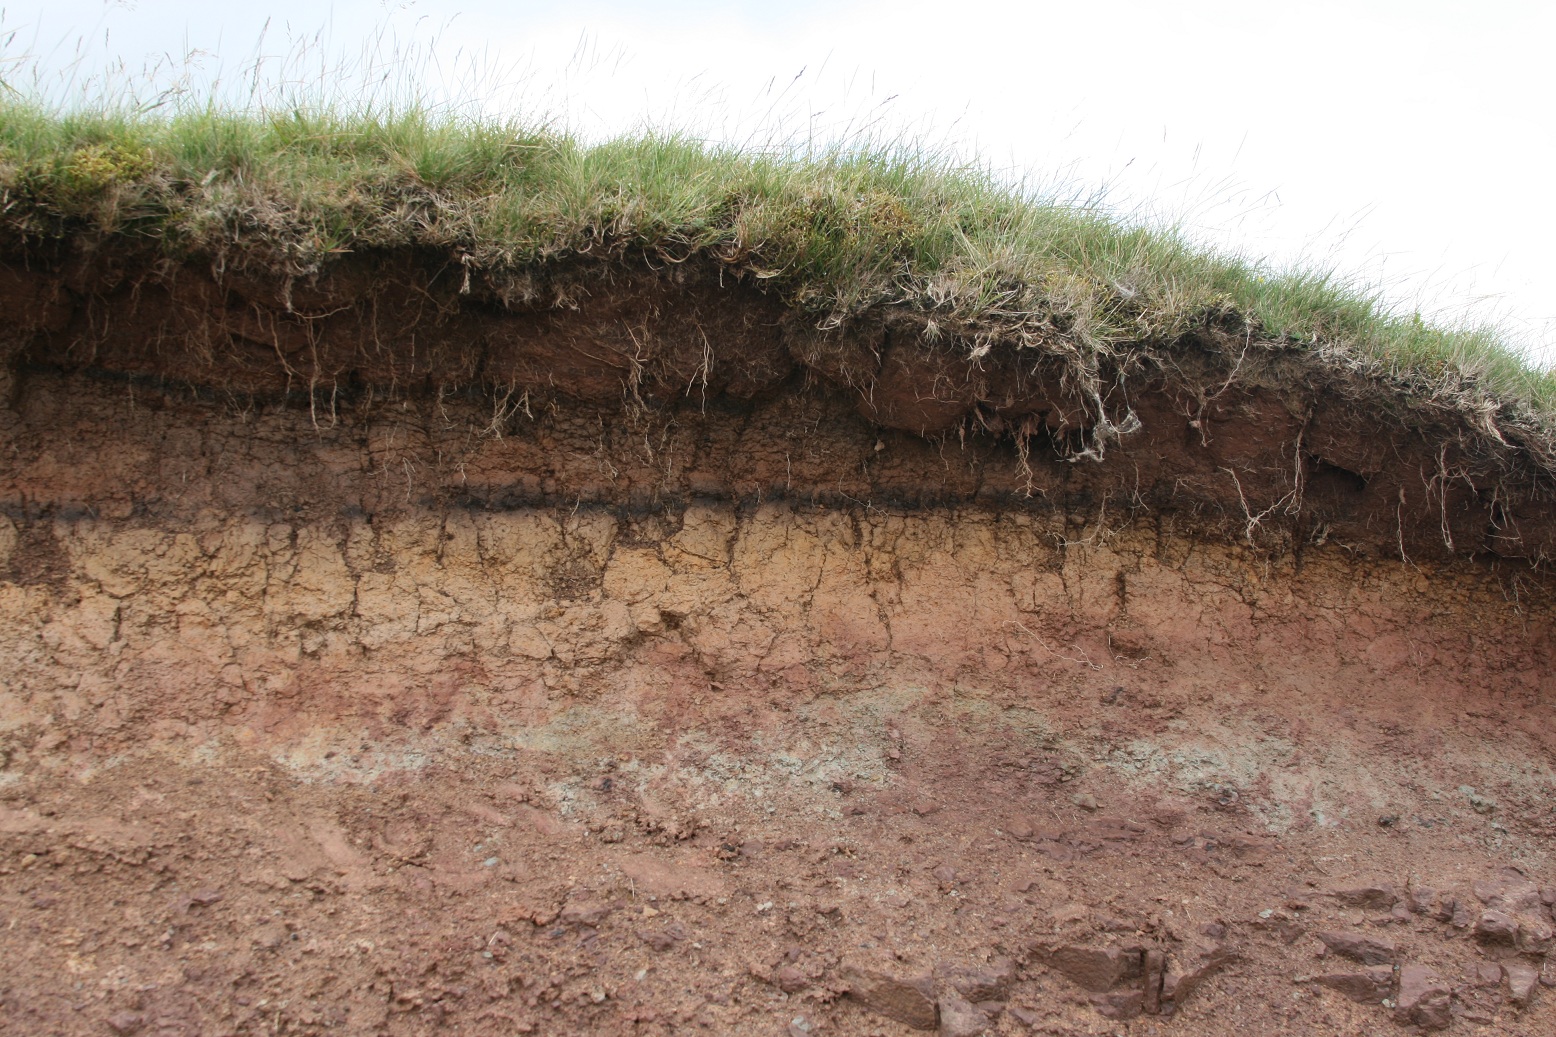
Microorganisms remain present in deeper soil horizons. Data compiled in global syntheses suggest that bacterial cells located between 1 and 8 m may account for approximately 15–30 per cent of soil bacterial cells, but this proportion is highly uncertain [2]. Beyond approximately 8 m lies the deep continental subsoil, whose biomass – dominated by bacteria and archaea – is counted separately from that of the soil. [8]
Litter should not be equated with living biomass. It consists mainly of leaves, twigs and other dead plant matter. The microorganisms and small animals it contains are alive, but account for only a fraction of its total carbon. Directly comparing the carbon stock in litter with the biomass of organisms therefore amounts to adding together compartments of a different nature. [2]
7. Estimates that remain highly uncertain
- Geographical coverage. Temperate regions are better sampled than many tropical, arid or boreal areas.
- Depth. Most samples are taken from the top few centimetres or the first metre of soil.
- Methods. Sieving, extraction, microscopic counting, biochemical analyses and environmental DNA do not detect the same organisms.
- Conversions. Converting a number of cells, individuals or DNA sequences into carbon mass requires variable conversion factors.
- Temporal variability. Moisture, temperature, season and resource availability cause active biomass to vary rapidly.
The new global maps combine a greater number of field measurements, climate data, soil properties and statistical models. They enable the identification of rich or poorly understood areas. However, they do not transform an estimate into an exhaustive census. [1]
8. Biomass, activity and soil health are not synonymous
High biomass indicates the presence of a significant quantity of living matter, but it is not sufficient to determine the health of a soil. Two soils with the same biomass may differ in terms of their diversity, food webs and functions. Conversely, low biomass may ensure a rapid rate of decomposition or nutrient recycling. [5]
Changes in land use, intensive tillage, erosion, pesticides, excessive fertiliser use, pollution, global warming and droughts alter biomass and community composition. To monitor these changes, it is necessary to combine measurements of biomass, diversity, biological activity and the physical and chemical properties of the soil. [5]
9. Messages to remember
- Soil is thought to harbour around 59 ± 15 per cent of the planet’s species, but diversity and biomass do not measure the same thing.
- Excluding roots, the biomass of soil organisms is in the region of 20 to 25 Gt C and is dominated by fungi and prokaryotes.
- Living roots, generally counted as part of plants, add around 130 Gt C to the underground biomass.
- Litter and soil organic matter are primarily non-living compartments and should not be confused with biomass.
- Most organisms are concentrated near the surface, but microbial biomass persists at depths of several metres.
- Individual numbers and biomass provide different information: small organisms may dominate in terms of numbers, whilst larger ones dominate in terms of mass.
Notes and references
Thumbnail. Ver de terre sur de la terre. Probablement un Lumbricus terrestris [Source : pfly, Licence CC BY-SA 2.0, via Wikimedia Commons]
[1] Anthony M.A., Bender S.F. & van der Heijden M.G.A. (2023). Enumerating soil biodiversity. Proceedings of the National Academy of Sciences, 120, e2304663120. https://doi.org/10.1073/pnas.2304663120
[2] Bar-On Y.M., Phillips R. & Milo R. (2018). The biomass distribution on Earth. Proceedings of the National Academy of Sciences, 115, 6506–6511. https://doi.org/10.1073/pnas.1711842115
[3] van den Hoogen J. et al. (2019). Soil nematode abundance and functional group composition at a global scale. Nature, 572, 194–198. https://doi.org/10.1038/s41586-019-1418-6
[4] Stewart J.D. et al. (2026). Global density and biomass of arbuscular mycorrhizal fungal networks. Science, 392, 1171–1176. https://doi.org/10.1126/science.adu4373
[5] Bardgett R.D. & van der Putten W.H. (2014). Belowground biodiversity and ecosystem functioning. Nature, 515, 505–511. https://doi.org/10.1038/nature13855
[6] Rosenberg Y. et al. (2023). The global biomass and number of terrestrial arthropods. Science Advances, 9, eabq4049. https://doi.org/10.1126/sciadv.abq4049
[7] Phillips H.R.P. et al. (2019). Global distribution of earthworm diversity. Science, 366, 480–485. https://doi.org/10.1126/science.aax4851
[8] Magnabosco C. et al. (2018). The biomass and biodiversity of the continental subsurface. Nature Geoscience, 11, 707–717. https://doi.org/10.1038/s41561-018-0221-6