Mountain glaciers, sentinels of climate change
PDF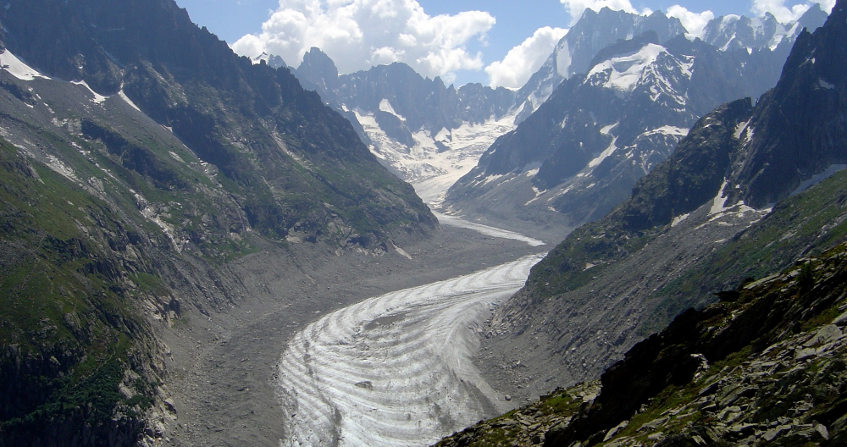
As true icons of mountain regions, glaciers are major tools for detecting climate change. However, the interactions between glaciers and climate are complex, sometimes indirect and highly variable from one region of the world to another. The measurement or estimation of glacier surface mass balance (the gain or loss of surface mass each year) is an important variable to understand past and current fluctuations over the past century or decades. These observations provide us with information on the very high mass losses observed over the past 30 years. With the help of models, it is possible to estimate the future of these glaciers and therefore some associated impacts, such as hazards of glacial origin, such as lakes or seracs falls.
The sharp decline of most mountain glaciers is one of the most obvious and visible natural elements of climate change during the twentieth century. As such, glacier evolution is now recognized as a very relevant indicator of climate change. In inaccessible regions, in mountains and in polar regions, where direct meteorological data are lacking, glacier monitoring provides us with direct information on climate fluctuations. The evolution of glaciers also has very important consequences: glaciers are a major component of the hydrological cycle in many mountain catchments. Their contribution to sea-level rise over the last century and the next century also occupies an important place in the work of the scientific community. Not to mention all the glacial or hydro-glacial hazards that may occur in different parts of the planet.
Therefore, long-term monitoring of glaciers is necessary to properly document the relationship between glaciers and climate, to detect current climate change, to document recent climate change and to predict its evolution and associated impacts.
In this article, we will focus mainly on the Alps’ glaciers, among the best documented in the world, to describe precisely the evolution of these glaciers and the processes involved.
- 1. Glaciers and climate, complex interactions quantified by mass balance
- 2. Fluctuations in alpine glaciers since the end of the last glaciation (Holocene)
- 3. Very high altitude glaciers: a specific response to climate change
- 4. The impacts of these glacier changes
- 5. Mountain glaciers around the world are generally retreating
- 6. The future of glaciers: a very strong decline in the coming decades
1. Glaciers and climate, complex interactions quantified by mass balance
While the advance or retreat of glaciers in the landscape is a highly visual testimony to their evolution, the fact remains that the link between these fluctuations and climate fluctuations is specific to each glacier. Glaciers are made up of ice that flows from the upper parts to the valleys: due to the geometry of each (size, slope, altitude, shape of the basin, etc.), the flow velocity is very different from one glacier to another. The fronts of glaciers thus respond with extremely variable weather to the stresses of the climate. To decipher the climate signal recorded by each glacier, it is therefore necessary to measure and analyze the mass balance of the entire glacier.
1.1. The mass balance of a glacier
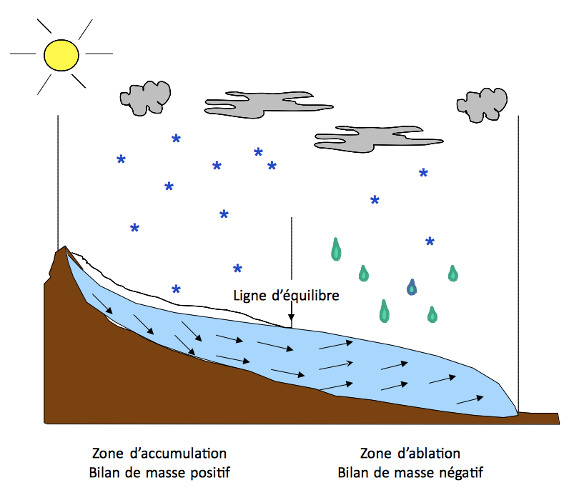
Glaciers result from the competition of two processes, called accumulation and ablation.
Accumulation is the mass gain mainly due to snowfall. In the Alps, accumulation is mainly due to winter snowfall. A winter with heavy snowfall will benefit glaciers. In tropical regions, some of the snow falls in summer, which is the wet season. However, at the local level, snow accumulation also depends on the redistribution of snow by wind, avalanche flows, etc.
Surface ablation is the loss of mass by melting, sublimation (evaporation of snow), and in some cases by disintegration of the glacier tongue into a lake or sea in the form of icebergs (referred to as “calving” of the glacier). Ablation results from the surface energy balance, i.e. the sum of the energy flows on the surface of the glacier, in the form of radiation but also as “sensitive” heat (see focus).
The evolution of a glacier thus depends on the balance between these two terms of gain and loss of mass, the difference being the mass balance of the glacier. The total mass balance hides significant local disparities at the glacier scale, because weather conditions vary according to altitude but also exposure. These assessments are carried out at the end of the hydrological year (which runs in the Alps from October of year n to the end of September of year n+1).
In the upper part of the glacier, the mass gain is greater than the loss: this is the accumulation area, still covered with snow at the end of the summer (the ablation season). The mass balance is positive in this area. This is the domain of the famous “eternal snows”, whose extension varies from one year to the next.
In the lower region of the glacier, the loss of mass outweighs the gain, the balance is negative, it is the ablation zone. At the end of the ablation season, the winter snow disappeared and gave way to the ice of previous years.
The annual surface mass balance is directly related to local weather conditions (precipitation, temperature, humidity, wind, radiation, see focus). Monitoring this parameter over the long term and on different glaciers around the world is therefore particularly interesting from a climate point of view.
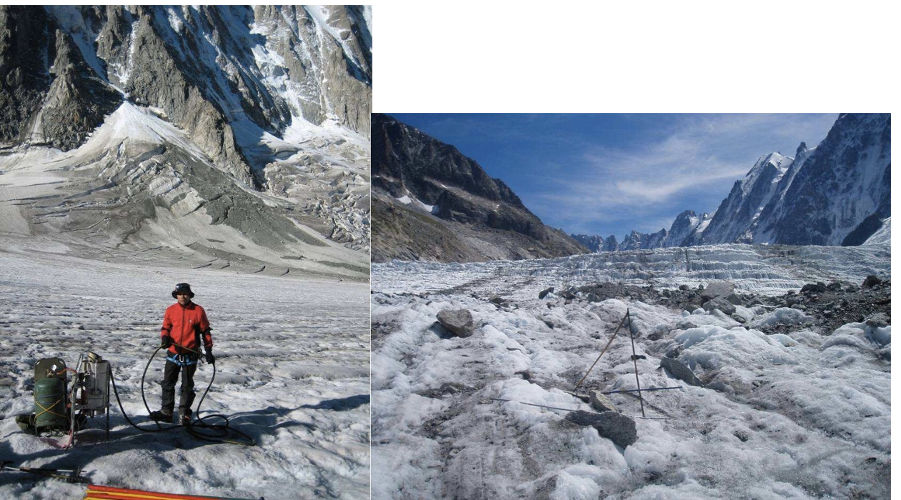
1.2. Measurement of the surface mass balance

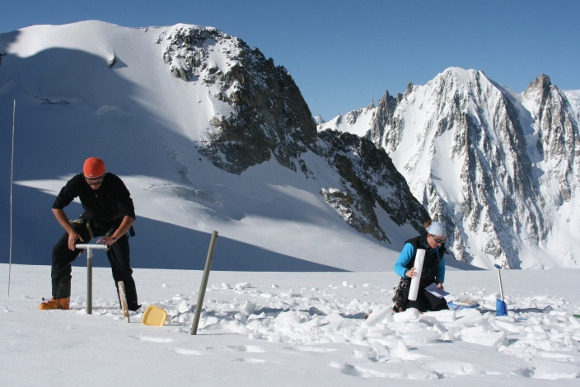
In the accumulation zone, these beacons are implanted in spring in the boreholes used to measure the accumulation. These posts will make it possible to monitor the summer snowmelt in this area.
In the ablation zone, 10 m long beacons are placed in the fall, before the winter snowfall, using a steam probe, in several locations representative of the ablation zone. The emergence of these beacons during the summer allows the loss of ice to be measured at each point in the ablation zone.
1.3. Depending on the region, the mass balance of glaciers is sensitive to different meteorological parameters
The sensitivity of a glacier to weather variables is highly dependent on regional conditions:
- In the Alps, ablation is strongly correlated with atmospheric temperature.
- The so-called “maritime” glaciers, near the oceans (as in Scandinavia), are very sensitive to variations in precipitation.
- Some regions of the world such as Pamir, in the western Himalayas, are heavily affected by the monsoon regime, which provides most of the rainfall.
- In very dry regions, such as the Andes, sublimation (direct transformation from the solid phase of a body to the gas phase) plays an important role in ablation and strongly affects the energy balance since it consumes a lot of energy (and leaves less for melting, see focus).
- The so-called “cold” glaciers, at very low temperatures (typically below -10ºC), located in high mountains (and in polar regions) must warm up to 0°C before melting begins. Their mass balance is therefore much less sensitive to warming.
It should be noted that the functioning of polar ice caps is quite different. Melting is not enough to remove the ice accumulated in the upper parts, and the glaciers come to throw themselves into the sea and eventually lose their accumulated mass via the “calving” of icebergs. This is the case with many of the “emissary” glaciers of the Antarctic ice cap. The mass balance of these glaciers is very sensitive to flow conditions (especially at the base of the glacier) and much less sensitive to surface melting processes.
The response of glaciers to climate change is therefore not identical in different regions of the world.
1.4. A glacier adjusts to climate through its mass balance
In any case, glacier flow plays an important role in this climate response by modifying the geometry of the glacier: its surface, length and thickness. However, this geometry itself influences the total mass balance. Indeed, if a glacier undergoes surface warming, surface melting will increase, its mass balance will decrease and, with a variable response time, its front will retreat: its surface thus decreases in its lower part. Since this reduction in surface area is located in the ablation zone, the total amount of melting of the glacier will decrease and its total mass balance tends to return to zero. Thus, the surface of a glacier adjusts to climatic conditions to move towards a state of equilibrium. As climatic conditions are never stable, such a balance is never exactly achieved in practice.
Thus, as the mass balance of an entire glacier adjusts, it is not the best indicator of climatic conditions. It is the point surface mass balance, i.e. the sum of accumulation and ablation measured at each point of the glacier, that is directly related to these conditions (see focus).
2. Fluctuations in alpine glaciers since the end of the last glaciation (Holocene)
During the last glaciation, the glaciers of the Alps occupied all the major valleys and extended into the Lyon plains. After the peak of the last glaciation, about 20,000 years ago, the glaciers began a very strong retreat that led them to their current configuration, in this interglacial period called the Holocene, which covers the last about 10,000 years. What is known about glacier fluctuations over the past 10,000 years?
2.1. Piecemeal and indirect knowledge at the beginning of the Holocene
At the scale of several millennia, we have only very indirect observations of successive advances and retreats, based on the positions of glacial moraines (accumulation of rocks of all sizes left by a glacier in its ablation zone), on pollens in peatlands, and on the study of tree rings (dendroclimatology). It seems that alpine glaciers have suffered a sharp decline in the first part of the Holocene, up to the climatic optimum maximum temperature within a Holocene period between 7,500 and 6,500 years before today, which was most likely the warmest period in the last 10,000 years. Freeze-up was then less than it is today.
Between 2,500 and 1,900 years before today, in Roman times, glaciers have declined sharply. They were as small or even smaller than they are today. But the second half of the Holocene also includes several cold episodes, including the “Little Ice Age“, which occurred in the Alps between the 14th and mid-19th centuries.
2.2. Evolution of glaciers since the end of the Little Ice Age
Since the middle of the 19th century, more quantitative observations have made it possible to detail the evolution of glaciers. In particular, a large number of measurements of glacier length (the position of the fronts) are available. Thanks in particular to old topographical maps and available field surveys, glacier variations tell us a far from uniform history of climate in the 20th and 21st centuries.
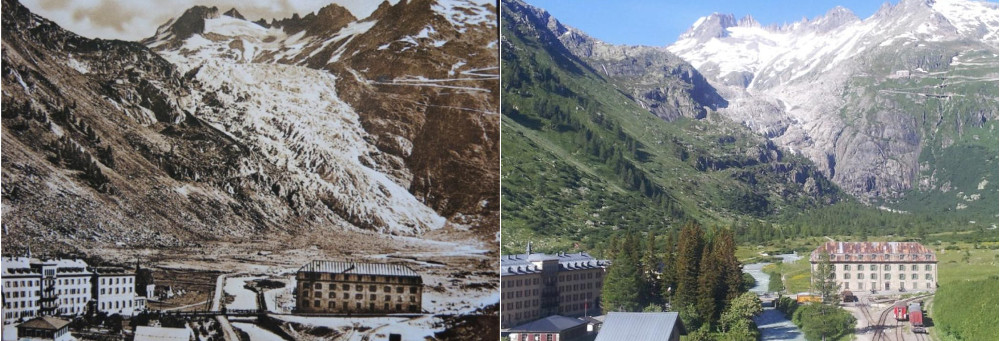
Admittedly, since 1850 and the end of the Little Ice Age, the vast majority of glaciers in the Alps have been decreasing. It is estimated that both surfaces and glacial volumes have decreased by an average of about half since the end of the Little Ice Age. But this average value conceals a great heterogeneity because some massifs have lost nearly 60% of their surface area (Vanoise and Ecrins massifs) with small glaciers that have totally disappeared and other glaciers that have fragmented, while some massifs have lost only 20 to 30% of their surface area (Mont-Blanc massif).
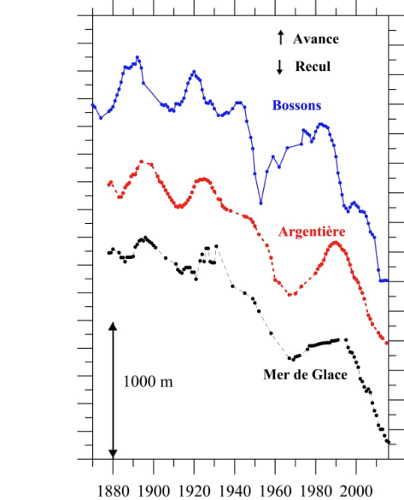
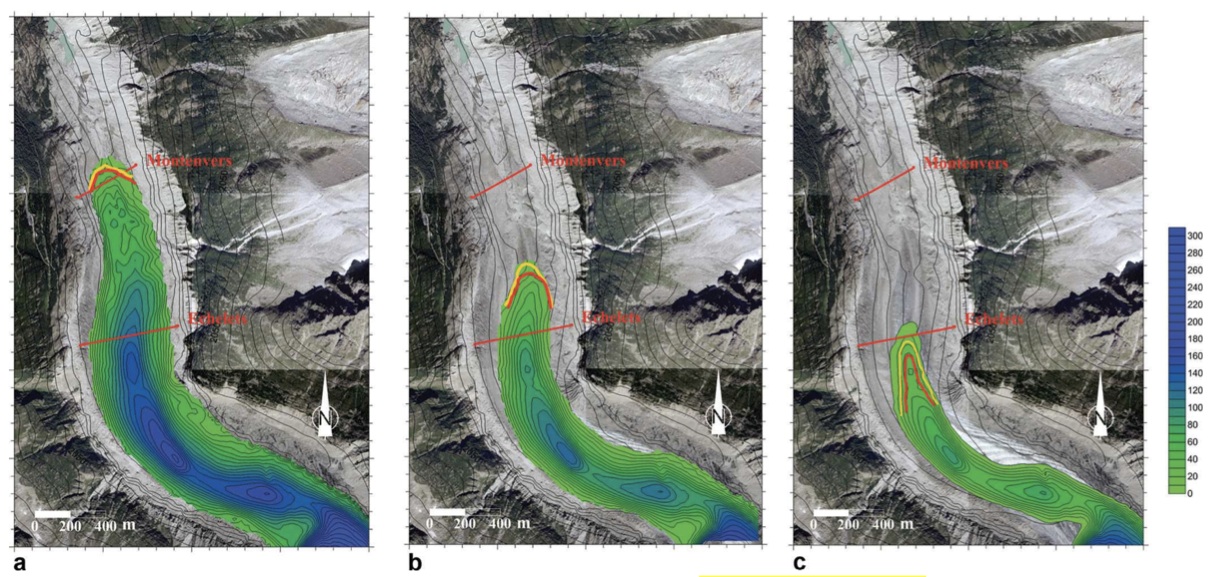
Finally, over the past 3 decades, glaciers have declined considerably. The Mer de Glace and the Argentière glacier in the Mont-Blanc massif have receded by about 750 m. The Bossons glacier has receded by more than 1 km. Glacial tongues have also become considerably thinner. The glacier of the Mer de Glace has lost nearly 100 metres of thickness in its lower part since 1990 (typically plumbing the Montenvers train arrival station).
These geometric changes (shortening and thinning) perceptible in the landscape are a consequence of the change in surface mass balances, with a response time that varies from a few years to several decades. Thus, the very strong changes in glacial languages observed over the last 3 decades are linked to very negative mass balances since the mid-1980s.
2.3. The significant mass loss of alpine glaciers over the past 30 years
As explained above, the surface mass balance represents the response of glaciers to climate more accurately than their length. Unfortunately, mass balance measurements are much more recent (since the 1950s in France) and cover fewer glaciers. Only about thirty continuous series of mass balances in the world exceed 30 years.
The Alpine countries (France, Switzerland, Italy, Austria) have a long tradition of mass balance measurements. Thus, based on these observations, a recent exhaustive study showed that the average mass balance of all Swiss glaciers is -0.62 m of water per year during the period 1980-2010 (equivalent water loss on average over their entire surface). The French, Austrian and Italian mountain ranges in the Alps suffered more or less the same fate. For example, the mass balances of the glaciers of the Mer de Glace and Argentière are on average -0.90 and -0.80 m of water/year respectively between 1983 and 2016. Since 2003, mass loss has accelerated and the mass balances of alpine glaciers have been even more negative. The mass balances of the glaciers of the Mer de Glace and Argentière have, on average, been -1.70 and -1.40 m of water/year respectively since 2003, thus revealing even more significant losses in ice volume.
It is interesting to note that the fluctuations in mass balance from year to year are remarkably similar throughout the Alpine range, over a distance of 400 km. This was shown by a recent study that compared the evolution of the mass balances of six large glaciers in the Alpine chain between Austria and France over the past 50 years.
As explained in paragraph 1.3, the total mass balance of a glacier depends not only on climatic conditions, but also on the evolution of its surface and its imbalance. Typically, over the same period 2001-2016, the large Argentière glacier (Mont-Blanc massif, 19 km²) and the small Saint-Sorlin glacier (Grandes Rousses massif, 3 km²) lost 1.30 and 2.00 m of water per year respectively. These differences in balance are all the more significant if one adds up the annual mass balances over time. Thus, over the period 2001-2 016, the cumulative mass balance of Argentière is -20 m of water, that of Saint-Sorlin -30 m of water.
To overcome this climate sensitivity specific to each glacier, it is more relevant to study the evolution of point mass balances (at each point of the glacier) rather than the overall mass balances of glaciers. Compared to the period 1962-1983, when glaciers were in a near-equilibrium state (few thickness changes during this period), point mass balances show that melting increased by 0.85 m of water per year in the following period 1983-2002, and by 1.63 m of water per year in the last period 2003-2013.
These negative mass balances are due to summer warming and a 2 to 3 week extension of the ablation season, while the amount of snow has changed little in recent decades at high elevations.
3. Very high altitude glaciers: a specific response to climate change
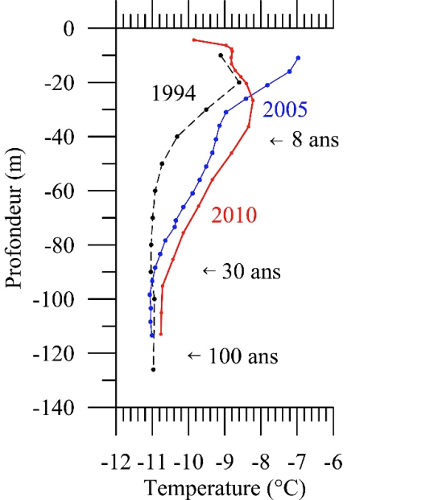
In the Alps, almost all valley glaciers are so-called temperate glaciers, which means that the temperature of the glacier is close to the melting point of the ice. Above approximately 3,500 m (in the Alps), the ice is said to be “cold”, i.e. at very low temperatures (about -11°C at the base of the Dôme du Gouter glacier at 4,300m, on the normal Mont-Blanc access road, and -17°C at the base of the small ice cap that covers the summit of Mont-Blanc). The temperature of a glacier depends on many factors, including altitude, exposure, surface snow accumulation and glacier flow. In particular, when a glacier has an accumulation basin at very high elevations, such as the Bossons glacier or the Taconnaz glacier (Mont-Blanc massif), the cold ice formed at very high elevations warms slowly as it flows downward and keeps the glacier in a “cold” state until it reaches altitudes well below 3500 m.
Observations on these cold sites at high altitudes show two very specific characteristics: on the one hand, ice thicknesses have changed relatively little over the last century. On the other hand, their internal temperature has varied significantly.
Thus, the thickness of the Dôme du Gouter glacier (4,300 m) has only changed by a few metres over the past 3 decades. A study has shown that the thickness of this glacier (like the one covering the summit of Mont Blanc) has remained unchanged, with an uncertainty of a few metres, since the beginning of the 20th century, when Joseph Vallot and his cousins had undertaken precise topographic measurements in the Mont-Blanc massif. However, these glacial massifs preserved at very high altitudes represent only a small area in the Alps.
4. The impacts of these glacier changes
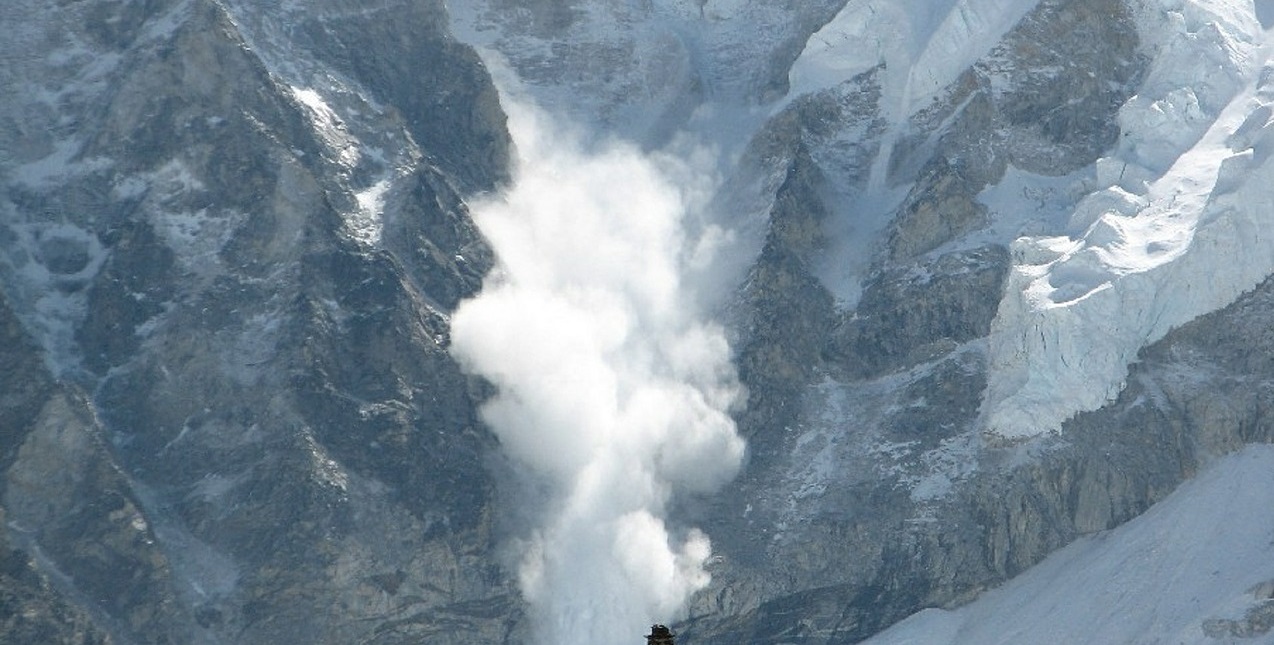
Warming and the increase in associated melting have consequences, among other things, on glacier-related hazards. Thus, the warming of cold high-altitude glaciers will modify the stability of so-called “suspended” glaciers, located on very steep slopes and which owe their stability to the fact that their basal temperature is strongly negative (which prevents the circulation of water in contact with the rocky bed). These glaciers will be destabilized when the temperature at their base reaches the melting point (the friction of the glacier on the rocky bed will then be greatly reduced). This is typically the case in the upper area of the Taconnaz glacier (Mont Blanc massif) [2].
Another hazard is related to the lakes that form in the depressions left by the retreating glacier, and closed by moraine dams that are sometimes unstable (proglacial lake). There is a risk of sudden emptying when these lakes have no or insufficient outlet, which poses a threat to the inhabitants of the valleys. These hazards are particularly relevant in Nepal where many glaciers are covered with morainal debris and leave imposing frontal moraines after their retreat.
Finally, a pocket of water can form in a glacier (intra-glacial lake). It results from complex processes indirectly linked to climate. Fortunately, these phenomena remain exceptional. However, they can be very deadly. In 1892, the sudden emptying of the water pocket of the Tête Rousse glacier in the Mont-Blanc massif caused 175 deaths in Saint Gervais. A pocket of water had re-formed and was detected in time in 2010: it could have caused 3,000 deaths if it had broken [3].
5. Mountain glaciers around the world are generally retreating
During the 20th century, an international effort was made to better document the evolution of glaciers. Nevertheless, of the 250,000 glaciers recorded worldwide, only about 30 have more than 30 years of mass balance measurements. In-situ glaciological data therefore remain very poor. Aerial photographs and satellite images can partially fill these gaps. Aerial photographs make it possible to accurately reconstruct the relief of glaciers by comparing views taken from different angles (this is called photogrammetry), but they have only been available since the 1950s and do not cover all glaciated massifs. Satellite images are now a remarkable source of documentation for estimating glacier thickness variations. But the first images with sufficient resolution only date from the early 1980s and only become common from the 2000’s onwards, which is too recent if long-term trends are to be analysed. Reconstructions using meteorological data and analyses of glacier sensitivity to climate variables can also complete the set of observations.
All the observations and reconstructions available around the world show that mountain glaciers generally receded after the end of the Little Ice Age, generally around the middle of the 19th century, although for some massifs the decline began as early as the middle of the 18th century. There are strong regional disparities, probably related to the regional disparity in climate change but also to the different sensitivity of glaciers around the world (section 1.3). For example, “sea glaciers” near the Norwegian coast or near the west coast of New Zealand are particularly sensitive to changes in precipitation. In the Himalayas, Nepalese glaciers appear to be very sensitive to monsoons from Southeast Asia. Andean tropical glaciers (Bolivia, Peru) are very sensitive to El-Niño phenomena, etc.
A quick tour of the planet shows that mountain glaciers are currently in general decline, with a few rare exceptions. As in the Alps, the glaciers of Alaska, the Tropical Andes and Patagonia are suffering considerable mass losses. Alaskan glaciers have lost about 0.6 m in thickness per year over the past 10 years, and Canadian Arctic glaciers have lost between 0.3 and 0.7 m in thickness. Tropical Andean glaciers (Bolivia, Peru, in particular) have lost an average thickness of 60 cm to 1.00 m of ice each year for 40 years. African glaciers will soon disappear: the glacier surface at the summit of Kilimanjaro increased from 11.4 km² to 1.8 km² between 1912 and 2012. It will probably disappear completely over the next few decades.
Himalayan glaciers suffer somewhat less impressive losses, averaging about 20 cm of ice per year over the entire Himalayan arc. However, the precise data, obtained by satellite, do not exceed 20 years of observations in this region [4]. It should be noted that this average masks considerable regional disparities: to the east of the Himalayan range (Nepal, Bhutan), mass balances are between -0.4 and -0.7 m of water per year over the period 2000-2 016, while to the west of the range (Pamir), mass balances are slightly negative (about -0.1 m of water per year). In the Kun Lun range (north of Karakoram), mass balances are even slightly positive (+0.15 m/year) over this period 2000-2016, most probably due to an increase in rainfall.
For an overview of the evolution of these glaciers in the world, we can refer to Francou and Vincent’s book (2015)[5]. In addition, detailed data on glaciers observed around the world are available on the World Glacier Monitoring Service website (http://wgms.ch).
6. The future of glaciers: a very strong decline in the coming decades
Thanks to all the long series of measurements obtained on glaciers in the different regions of the world, it is now possible to simulate the evolution of glaciers both in the past to reconstruct their history and in the future to determine their evolution. These are major issues for estimating mountain water resources or the contribution of glaciers to sea level.
These future simulations are based on climate scenarios that predict different trajectories of parameters such as temperature and precipitation until the end of the 21st century (some even beyond). It should be noted that precipitation change scenarios are extremely uncertain, and this uncertainty affects glacier change scenarios. From these climate scenarios, our good understanding of climate control of mass balance allows us to estimate mass balance scenarios for each glacier. These mass balance scenarios are then combined with dynamic models that simulate glacier flow to predict future retreat and volume loss.
All the simulations show that the Alps’ glaciers will decline sharply in the coming decades, regardless of the climate scenario for the next 20 years. Indeed, glaciers are in such a state of imbalance compared to current conditions that their surface area is far too large compared to the climatic conditions of the last 30 years. Even if climatic conditions remained the same over the next few decades, the surface area of glaciers would decrease considerably before returning to a steady state. For example, with the average climatic conditions of the last 20 years, the largest glacier in the Alps, Aletsch, would lose 40% of its volume before returning to a steady state.
However, realistic modelling requires very precise information on the glacier studied (ice thickness, bedrock topography), which severely limits studies to a few glaciers in the world. With a relatively optimistic scenario of +2°C by 2100, the front of the Aletsch glacier (which is now 22 km long) is expected to retreat by 10 km and could lose 90% of its volume. It is estimated that, on an Alpine scale, between 80 and 95% of the current glacier surface could disappear by the end of the 21st century, depending on the climate scenario followed. This will affect water resources in part of Europe (read “The impact of climate change on snow cover and Alpine glaciers: consequences on water resources”)
Notes and references
Cover image. Public domain.
[1] Gilbert, A., C. Vincent, 2013. Atmospheric temperature changes over the 20th century at very high elevations in the European Alps from englacial temperatures, Geophysical Research Letters, 40, 2102-2108 DOI : http://dx.doi.org/10.1002/grl.50401
[2] Gilbert, A., C. Vincent, O. Gagliardini, J. Krug and E. Berthier (2015). Assessment of thermal change in cold avalanching glaciers in relation to climate warming, Geophys. Lett. Res. Lett., 42, doi:10.1002/ 2015GL064838. DOI: http://dx.doi.org/10.1002/2015GL064838
[3] Vincent, C., Garambois, S., Thibert, E., Lefebvre, E., Le Meur, E., Six, D. Origin of the outburst flood from Glacier de Tête Rousse in 1892 (Mont Blanc area, France). Journal of Glaciology, 56, 688-698. 2010. DOI: https://doi.org/10.3189/002214310793146188
[4] Brown F., E. Berthier, P. Wagnon, A. Kääb and D. Treichler. 2017. A spatially resolved estimate of High Mountain Asia glacier mass balances from 2000 to 2016. Nature Geoscience. 7 August 2017, DOI: 10.1038/NGEO2999
[5] Francou B. and C. Vincent. What’s new on the white planet. 2015. Editions Glénat. 143 p. EAN/ISBN : 9782344008157. Publisher link: http://nature.glenatlivres.com/livre/quoi-de-neuf-sur-la-planete-blanche-9782344008157.htm)
[6] Vincent, C., M. Harter, A. Gilbert, E. Berthier and D. Six. 2014. Future fluctuations of Mer de Glace, French Alps, assessed using a parameterised model calibrated with past thickness changes. Ann. Glaciol, 55(66), 15-24. doi: 10.3189/2014AoG66A050
The Encyclopedia of the Environment by the Association des Encyclopédies de l'Environnement et de l'Énergie (www.a3e.fr), contractually linked to the University of Grenoble Alpes and Grenoble INP, and sponsored by the French Academy of Sciences.
To cite this article: SIX Delphine, VINCENT Christian (January 5, 2025), Mountain glaciers, sentinels of climate change, Encyclopedia of the Environment, Accessed July 30, 2026 [online ISSN 2555-0950] url : https://www.encyclopedie-environnement.org/en/climate/mountain-glaciers-sentinels-of-climate-change-2/.
The articles in the Encyclopedia of the Environment are made available under the terms of the Creative Commons BY-NC-SA license, which authorizes reproduction subject to: citing the source, not making commercial use of them, sharing identical initial conditions, reproducing at each reuse or distribution the mention of this Creative Commons BY-NC-SA license.