几个世纪以来太阳活动的变化和气候影响

solar activity

  太阳能是地球表面的主要能源。虽然地球表面的特定位置接收到的太阳能变化很大,特别是季节性变化,但太阳辐射是相对恒定。然而,太阳活动的变化早已为人们所熟知,自古以来人们就认为这种太阳活动会影响我们的气候。那么我们对过去一千年来的太阳活动了解多少?哪些活动会影响地球气候?哪些影响是可见的?

1. 太阳:一颗多变的星球

  日照,即地球表面所接收到的太阳能量,主要随着地球在其轨道上的运动而发生变化,昼夜和季节更替也因此产生。但辐射是太阳辐射的能量流,一直以来都被认为是恒定的,因此被称为“太阳常数”。直到卫星获得了极其精确的测量结果才发现这个“常数”是可变的,但这些变化非常小(在此处所涉及的时间尺度上约为 0.1%)。

  太阳自身活动的主要指标是太阳黑子,即太阳表面的偶发性黑点。这些斑点的存在早已为人所知,但直到17世纪初,望远镜的普及才得以对这些斑点进行定期计数。这些计数逐渐揭示了一个非常明显的周期,以11年为周期,以及一个世纪的变化。

       最近,包括太阳耀斑在内的其他太阳活动表现形式开始被人们所重视。太阳耀斑是一种非常短暂(最多持续几个小时)的辐射爆发和高能粒子喷射现象,是地球上北极光的成因(参阅:太阳能的能量)。

1.1. 太阳11年周期(施瓦贝周期)

  在太阳最外层,光球层、色球层和日冕的对流和磁场活动呈现出明显的、周期性变化。当太阳活动强烈时,太阳的可见“表面”(光球层)上就会形成温度较高、辐射较多的区域,即光斑。伴随光斑出现的温度较低、辐射较少的区域就是太阳黑子。这些区域以周为单位存在,持续时间为一个太阳自转周期(27天)。整个太阳大气层(色球层和日冕)的温度也会变得更高,产生更多辐射。日冕频繁地发出强光。

环境百科全书-太阳影响气候-过去150年左右太阳活动和地球表面温度的变化
图1. 过去150年左右太阳活动和地球表面温度的变化;通过无线电通量测量太阳的磁场活动。
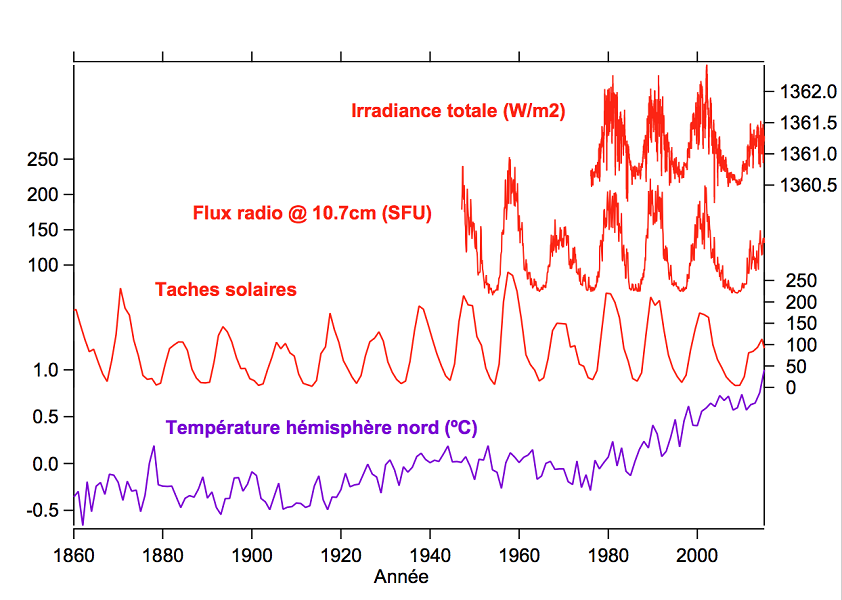
[来源:PMOD/WRC for irradiance; Hadley Centre/UEA CRU for temperature (HadCRUT4 version); Space Weather Centre of Canada for radio flux at 10.7 cm; Clette et al. 2014 (see ref.[1] (WDC/SILSO) for annual sunspots]. [© G. Delaygue]

  随着天文望远镜的进步,自17世纪初(1610年左右)起,人们就开始记录太阳黑子这一最显著的太阳活动。通过这些计数档案,可以重现出几乎不间断的、逐日逐年的太阳黑子活动[1]。周期为9~13年不等,其中11年周期最为明显(图1和图2)。

       大约自1978年开始,卫星辐射探测仪对太阳黑子相关的太阳辐射变化进行了精确测量。这些测量表明,太阳总辐射最大值和最小值之间的变化为1W/m2,即约0.1%(图1)。这种变化在紫外线波长中表现相对更明显,大约为1%到10%,但其精确数值仍然存在争议[2]

1.2. 太阳活动的长期变化(“Gleißberg”变化)

环境百科全书-太阳影响气候-1200年来的太阳活动
图2. 1200年来的太阳活动(太阳黑子和宇宙同位素 Be-10)和地球表面温度;太阳极小期(黑色)即太阳黑子少且Be-10浓度高的时期。
[来源:Hoyt & Schatten (1997) for sunspot groups (distributed by NOAA/NCDC); Mann et al (2009) for northern hemisphere temperature (anomaly); Delaygue & Bard (2011) for relative variations of the Be-10 isotope in ice (inverted scale)]. [© G. Delaygue]

       太阳黑子计数序列显示,在过去4个世纪里,11年周期的最大值一直在波动,而极小值保持稳定,期间几乎不会出现太阳黑子。因此我们观察到以非常高的极大期为特征的周期,这些周期被称为“极大值期”。我们正在走出20世纪60年代和70年代达到顶峰的“现代极大期”。极大值低、太阳黑子极少的时期称为“极小值期”。在太阳黑子计数的时间跨度中,最重要的是蒙德极小值期(1645~1715年左右),在此期间观察到的太阳黑子极少。较长时间范围内出现的波动通常被称为Gleißberg周期(图2)。

  虽然太阳黑子数量是一个具有指示性的太阳活动量化指标,但这个值会出现重要偏差,因为在极小值期期间,极少有或没有太阳黑子出现。然而,在卫星监测时期,还没有出现过极小值期。因此,我们不知道本世纪内太阳辐照度的最小值及其总振幅。

1.3. 长期及千年变化:太阳活动的间接指数

  在得到太阳活动的直接记录之前,必须使用间接指标(“代用指标指数”)来重建这一过程。最可靠的方法是使用宇宙同位素碳-14和铍-10,它们在地球高空大气中的含量受太阳磁场影响而发生变化(图2)。这两种同位素的变化记录在树木年轮、极地冰盖和山地冰川中。太阳的活动变化可以用来解释两种同位素的浓度的相对变化。例如,为了获得总太阳辐照度(单位:W/m2)的绝对变化,有必要使用已知的独立变化来校准同位素浓度,要么是测量值(但仅限于相当短的、最近的时期),要么基于太阳活动的物理模型来估算[3]

  然而,无论在可靠性方面,还是时间分辨率方面,这些间接指数还是不够完善。尤其是11年太阳活动周期的问题,即使最近的研究在过去一千年中强调了这一点,这个问题仍然很难通过长期的替代指数记录来解决[4]

  这些替代指标表明,在过去的一千年里,太阳活动值不仅在蒙德极小值期间很低,在15世纪的斯波勒极小值期间,太阳活动值可能更低。20世纪末的现代极大值期数值似乎比8世纪的中世纪极大值数值稍高(图2)。

2. 11年太阳周期对地球气候的影响

  确定了太阳活动的11年周期后,有无数研究试图找到这一周期与地球气候变化或其他指数的关联[5]。但显著且经得起理论分析的关联很少[6]

2.1. 对地球表面的影响

  现在看来,就地球的热惯性而言,太阳活动的11年周期所引起的辐照度变化太小太快,无法对地球表面造成显著的温度变化。事实上,考虑到地球的几何精度衰减因子(1/4因子)、地球反照率(0.3)和大气吸收率(约20%),在一个太阳周期内,辐照度的最大振幅约为1W/m2,被地表吸收的太阳辐射通量会改变约0.14W/m2。对半球或全球表面温度平均值的影响,似乎每周期只有约0.1ºC(链接:强迫和追溯效应;气候敏感性)。

  然而,在太平洋的某些地区,太阳活动周期与地表压力和温度之间存在长期关联[7]。该太阳活动周期似乎还与气候系统内部振荡相互作用,包括相同年代际振荡、太平洋年代际振荡和北大西洋振荡[8]。在区域尺度上,太阳活动可能有利于某些天气系统,尤其是在冬季,太阳活动可以阻止极地冷空气在西欧上空停留[9]

2.2. 对平流层的影响

环境百科全书-太阳影响气候-太阳活动对北极大气压的影响
图3. 太阳活动对北极大气压的影响取决于大气准两年周期振荡(QBO)相位。1948-2015年北极30hPa位势高度(1-2月的平均值;NCEP再分析)与10.7cm处太阳辐射通量的关系,区分低平流层急流方向(大气准两年周期振荡相位)。[© G. Delaygue](北极30hPa位势高度(km);大气准两年周期振荡;太阳辐射量(SFU))

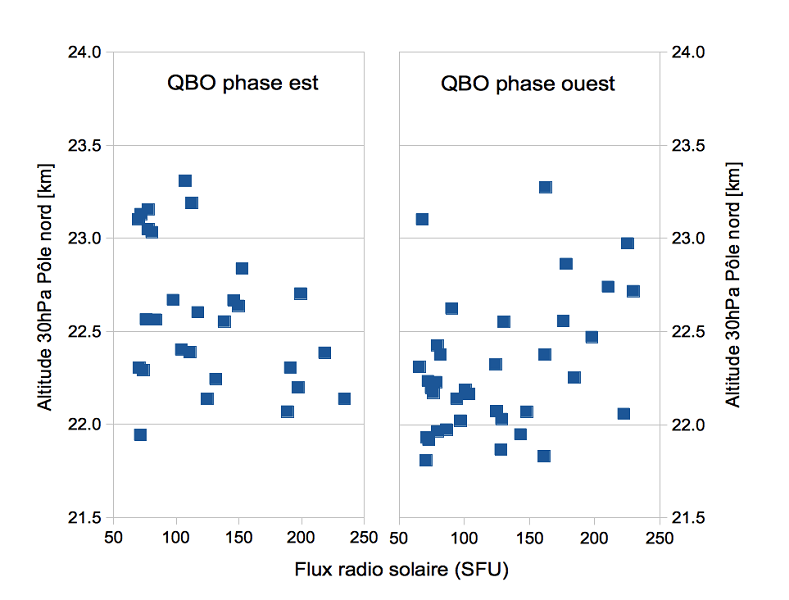
  不同于地表,11年太阳周期在平流层中作用十分明显。温度、位势和经圈环流(布鲁尔—多普森环流)的变化都有很好的记录(图3)。使用描述物理和化学过程的模型进行了测试,所涉及的机制是臭氧循环对紫外线辐射的强烈吸收,这使空气变暖并改变了子午线的温度梯度[10]。与总辐射变化(相对增大为10~100倍)相比,太阳周期中紫外线辐射的相对变化很大。太阳活动对地球平流层的作用会影响北极极地气旋强度,冬季时影响尤为明显,进而影响高纬度和中纬度的低对流层。地球平流层急流环流方向可以影响太阳周期对地球的影响,其方向大约每两年反转一次(“大气准两年周期振荡”,QBO)[11](图3)。

2.3. 太阳活动可能影响云层形成

  太阳活动不仅会影响太阳辐射,还会影响穿透地球大气层的高能粒子流。高能粒子流主要由银河系的宇宙辐射形成,受太阳磁场(随太阳活动而变化)影响发生偏转。太阳自身也会发射高能粒子,这一现象在喷发期间尤为显著。这些高能粒子与地球大气中的分子相互作用,形成离子。50多年前,人们就假定这一离子化过程会影响气候[12],但在理论层面和观测中仍然存在很大争议。最新的作用机制是,这些离子促进云层形成所需凝结核的形成。

  通过对可见和红外的辐射量以及潜热通量的影响,云层对气候系统中热量交换的作用至关重要。太阳的高能粒子流调节作用对地球气候的影响十分有限,但通过控制云层形成,其影响可以得到大幅增强。然而,关于高能粒子流和云量之间的各种相关性假设仍然存在很大争议[13]

3. 近一千年太阳活动的长期变化对气候的影响

  因太阳黑子而闻名的蒙德极小值期(1645—1715左右)发生的时期,欧洲历史学家称其为“小冰河期”[14]。然而,这段时期在时间上仍然定义不清,可能是因为与气候变化相比,十年的变异性很强,也因为其定义取决于所考虑的标准和地区。被广泛接受的观点是,小冰河期从15世纪一直持续到19世纪中叶,高山冰川的大规模消退是其结束的标志。

  根据当地气候条件(温度和/或降水)对历史和自然记录(尤其是年轮)进行的解释,证实:小冰河时期是一种可在北半球检测到的现象,但相较于区域和时间变化(例:较冷和较暖的十年)相比,其温度振幅很小(约0.2ºC)。

  气候模型用于检验引起气候变化各个因素(包括太阳活动变化)的重要性。这些因素造成了辐射的不平衡(“气候营力”,[链接:1.3])。最近的研究一致认为,太阳活动会对区域及全球地表温度变化的影响是微小且可检测。然而,在十年乃至百年时间范围内,这些研究已经向上修正了强烈火山喷发对温度变化的影响[15]

4. 结论

  因此,就当前而言,太阳活动对气候的区域性影响似乎比全球性影响更明显。为了理解它们之间的关系,需要更好地重建和模拟这些区域性气候变化以及气候影响的单独作用。这些对过去几个世纪的研究使得考虑未来几个世纪太阳对气候的影响成为可能,尤其有助于我们证实太阳对地球的影响程度将会回到非常低的水平的假说:即与人为因素(温室气体、反射率)相比,太阳活动对地球的全球性影响将会维持在较低水平。但太阳活动将继续与气候变化在一定区域内相互作用[16]


参考资料及说明

封面照片:1950年至2013年底的全球温升。[来源:NASA(公共领域)——维基共享资源]

[1] Clette, F., L. Svalgaard, J. M. Vaquero, and E. W. Cliver (2014). Revisiting the Sunspot Number. Space Science Reviews, 186, 35-103. http://dx.doi.org/10.1007/s11214-014-0074-2

[2] Ermolli, I., et al. (2013). Recent variability of the solar spectral irradiance and its impact on climate modelling. Atmospheric Chemistry and Physics, 13, 3945-3977. http://dx.doi.org/10.5194/acp-13-3945-2013

[3] Delaygue, G. and E. Bard (2011). An Antarctic view of Beryllium-10 and solar activity for the past millennium. Climate Dynamics, 36, 2201-2218. http://dx.doi.org/10.1007/s00382-010-0795-1

[4] Mélanie Baroni, CEREGE, personal communication, December 2015

[5] Herschel, W. (1801). Observations Tending to Investigate the Nature of the Sun, in Order to Find the Causes or Symptoms of Its Variable Emission of Light and Heat; With Remarks on the Use That May Possibly Be Drawn from Solar Observations. Philosophical Transactions of the Royal Society of London, 91, 265-318, http://dx.doi.org/10.1098/rstl.1801.0015

[6] Pittock, A. B. (1978). A critical look at long-term Sun-weather relationships, Review of Geophysics, 16(3), 400-420, http://dx.doi.org/10.1029/RG016i003p00400

[7] Christoforou, P. and S. Hameed (1997). Solar cycle and the Pacific’centres of action’. Geophysical Research Letters, 24, 293-296. http://dx.doi.org/10.1029/97GL00017

[8] Van Loon, H. and G. A. Meehl (2014). Interactions between externally forced climate signals from sunspot peaks and the internally generated Pacific Decadal and North Atlantic Oscillations. Geophysical Research Letters, 41, http://dx.doi.org/10.1002/2013GL058670

[9] Barriopedro, D., García-Herrera, R. and Huth, R. (2008). Solar modulation of Northern Hemisphere winter blocking. Journal of Geophysical Research, 113(D14), D14118, http://dx.doi.org/10.1029/2008JD009789.

[10] Marchand, M. et al. (2012). Dynamical amplification of the stratospheric solar response simulated with the Chemistry-Climate Model LMDz-Reprobus. Journal of Atmospheric and Solar-Terrestrial Physics, 75-76, 147-160, http://dx.doi.org/10.1016/j.jastp.2011.11.008

[11] Labitzke, K. (1987). Sunspots, the QBO, and the stratospheric temperature in the north polar region. Geophysical Research Letters, 14(5), 535-537. http://dx.doi.org/10.1029/GL014i005p00535

[12] Ney, E. P. 1959. Cosmic Radiation and the Weather. Nature, 183(4659), 451-452, http://dx.doi.org/10.1038/183451a0

[13] Calogovic, J., Albert, C., Arnold, F., Beer, J., Desorgher, L. and Flueckiger, E. O. (2010). Sudden cosmic ray decreases: No change of global cloud cover. Geophysical Research Letters, 37(3), http://dx.doi.org/10.1029/2009GL041327

[14] Eddy, J. A. (1976). The Maunder Minimum. Science, 192, 1189-1202, http://dx.doi.org/10.1126/science.192.4245.1189

[15] Schurer, A. P., Tett, S. F. B. and Hegerl, G. C. (2014). Small influence of solar variability on climate over the past millennium. Nature Geoscience, 7(2), 104-108, http://dx.doi.org/10.1038/ngeo2040

[16] Ineson, S., Maycock, A. C., Gray, L. J., Scaife, A. A. A., Dunstone, N. J., Harder, J. W., Knight, J. R., Lockwood, M., Manners, J. C. and Wood, R. A. (2015). Regional climate impacts of a possible future grand solar minimum. Nature Communications, 6, http://dx.doi.org/10.1038/ncomms8535


环境百科全书由环境和能源百科全书协会出版 (www.a3e.fr),该协会与格勒诺布尔阿尔卑斯大学和格勒诺布尔INP有合同关系,并由法国科学院赞助。

引用这篇文章: DELAYGUE Gilles (2024年3月14日), 几个世纪以来太阳活动的变化和气候影响, 环境百科全书,咨询于 2024年7月27日 [在线ISSN 2555-0950]网址: https://www.encyclopedie-environnement.org/zh/climat-zh/solar-activity-variability-and-climate-impacts-case-of-recent-centuries/.

环境百科全书中的文章是根据知识共享BY-NC-SA许可条款提供的,该许可授权复制的条件是:引用来源,不作商业使用,共享相同的初始条件,并且在每次重复使用或分发时复制知识共享BY-NC-SA许可声明。

Variability of solar activity and climate impacts over the last centuries

solar activity

The primary energy source for the Earth’s surface is the solar energy flux. While the flux received at the Earth’s surface at a given location varies considerably, especially seasonally, the flux radiated by the Sun is relatively constant. However, variations in solar activity have been known for a very long time, and the hypothesis that this solar activity can affect our climate is an old one. What do we know about this solar activity over the last millenium; what activity can influence the climate; which influences are discernible?

1. The Sun, a variable star

Insolation, the flow of solar energy received on the Earth’s surface, varies mainly because of the Earth’s movements in its orbit, which causes daytime and seasonal alternation. On the contrary, irradiance, the flow of energy radiated by the Sun, has long been considered constant, hence its name “solar constant”. It was not until the extremely accurate measurements obtained by satellite that this “constant” was shown to be variable, but these variations are very small (in the order of 0.1% on the time scales at stake here).

The main indicator of the Sun’s own activity is the sunspots, these episodic dark spots on the Sun’s surface. These spots had been known for a very long time, but it was the diffusion of the telescope at the very beginning of the 17th century that made it possible to count these spots regularly [1]. These counts gradually revealed a very marked cycle with a 11-year period as well as variations on a century scale.

More recently, other expressions of this solar activity have been highlighted, including solar flares, extremely short phenomena (a few hours at most) of radiation ejection and high-energy particles, which are responsible for the northern lights (read Solar energies).

1.1. The 11-year cycle (known as the Schwabe cycle)

The convective and magnetic activity of the outermost layers of the Sun, the photosphere, chromosphere and corona, shows marked and cyclical variations in its activity. When activity is strong, warmer and more radiant areas, the faculae, are formed on the visible ‘surface’ of the Sun (photosphere) accompanied by cooler and less radiant areas, the sunspots. These zones have an existence of the order of the week, and accompany the rotation of the Sun in 27 days. The solar atmosphere (chromosphere and corona) is also warmer and more radiant all over the Sun. Flashes are triggered more frequently from the corona.

Encyclopédie environnement - soleil impact climat - Variations activité solaire et température Terre derniers 150 ans - solar activity - surface temperature on earth - radio measures magnetic activity of sun
Figure 1. Changes in solar activity and surface temperature of the Earth over approximately the past 150 years. Radio flux measures the magnetic activity of the sun. [Sources: PMOD/WRC for irradiance; Hadley Centre/UEA CRU for temperature (HadCRUT4 version); Space Weather Centre of Canada for radio flux at 10.7 cm; Clette et al. 2014 (see ref.[1]) (WDC/SILSO) for annual sunspots]. [© G. Delaygue]
The sunspots, the most visible indication of this activity, have been counted since the beginning of the 17th century (around 1610) with the development of the astronomical telescope. An almost continuous series, annual to daily, could be reconstructed from counting archives [1]. This series of sunspot counts shows a very marked cyclicity at 11 years, with cycles varying from 9 to 13 years (Figures 1 and 2).

Satellite radiometers have been accurately measuring the variations in solar irradiance associated with this activity since about 1978. These measurements indicate a variation of 1 W/m2, or about 0.1%, between the maximum and minimum of the total solar irradiance (Figure 1). These variations are stronger, relatively, in the ultraviolet wavelengths, in the order of 1 to 10%, even if their precise values remain debated [2].

1.2. Secular variations in solar activity (“Gleißberg” variations)

Encyclopédie environnement - soleil impact climat - Activité solaire température Terre derniers 1200 ans - solar activity
Figure 2. Solar activity (sunspots and cosmogenic isotope Be-10) and surface temperature of the Earth over the last 1200 years. The solar minima, in black, correspond to periods with few spots and high concentrations of Be-10. [Sources: Hoyt & Schatten (1997) for sunspot groups (distributed by NOAA/NCDC); Mann et al (2009) for northern hemisphere temperature (anomaly); Delaygue & Bard (2011) for relative variations of the Be-10 isotope in ice (inverted scale)]. [© G. Delaygue]
Sunspot count series show that the maximums of the 11-year cycles have fluctuated over the past 4 centuries, while the minimums have remained stable, with almost no sunspots. We thus observe periods characterized by very high maxima, periods that have been called “Great maxima”. We are emerging from the “Great Modern Maximum”, which culminated in the 1960s and 1970s. Periods of very low maxima, with very few spots, have been called “Great minima”. Over the period covered by the stain count series, the most important is the Maunder Great Minimum, from about 1645 to 1715, during which very few spots were observed. These fluctuations in the secular time scale are often referred to as Gleißberg cycles (Figure 2).

While the number of sunspots is a good quantitative indicator of solar activity, it has the important bias of being levelled from below, with little or no sunspots during the Great Minima. However, the period covered by satellites does not include a Great Minimum: therefore, we do not know the minimum values of the irradiance, nor its total amplitude at this century time scale.

1.3. Secular to millennium variability: indirect indices of solar activity

Before these direct records of solar activity, indirect indices (‘proxies’) must be used to reconstruct it. The most reliable are the cosmogenic isotopes, Carbon-14 and Beryllium-10, whose production in the Earth’s upper atmosphere is modulated by the solar magnetic field (Figure 2). These isotopes are recorded in tree rings and the ice on polar ice caps and mountain glaciers. Their concentration is interpreted in terms of solar activity, but only relative variations can be reconstructed. To obtain absolute variations, for example of total solar irradiance (in W/m2), it is necessary to calibrate these concentrations with independently known variations, either measurements (but restricted to a very short and recent period) or estimations based on physical models of solar activity [3].

However, these indirect indices remain relatively imperfect, both in terms of reliability and temporal resolution. In particular, the 11-year solar cycle remains very poorly resolved in the long records of these proxies, even if recent studies have highlighted it over the last millennium [4].

Over the past millennium, these proxies show that solar activity was low not only during the Maunder Great Minimum but also, and perhaps even lower, during the Spörer Great Minimum in the 15th century. The modern Grand Maximum, at the end of the 20th century, seems a little higher than the medieval Grand Maximum of the 8th century (Figure 2).

2. Impacts of the 11-year solar cycle on the Earth’s climate

Following the identification of 11-year solar cycles, countless studies have sought to find correlations with climate variations or other parameters [5]. Few of these correlations were significant and withstood serious analysis [6].

2.1. Impacts on the Earth’s surface

It now seems clear that the variations in irradiance due to the 11-year cycles are too small and too fast to generate significant temperature variations at the Earth’s surface, given its thermal inertia. In fact, the maximum amplitude of the irradiance, of the order of 1 W/m2 during a solar cycle, modifies the solar flux absorbed by the surface by about 0.14 W/m2, taking into account the geometric dilution factor on the terrestrial sphere (factor 1/4), the global albedo (0.3), and the absorption by the atmosphere (about 20%). The impact on a hemispherical or global average of the surface temperature seems just detectable, in the order of 0.1ºC per cycle (link : Forcing and retroactive effects; climate sensitivity).

However, a persistent correlation has been shown between these solar cycles and surface pressure and temperature in some regions of the Pacific [7]. It also appears that this solar cycle interacts with oscillations within the climate system, including those of the same decadal time scale, the Pacific decadal Oscillation and the North Atlantic Oscillation [8]. At the regional scale, solar activity could favour some synoptic regimes, particularly in winter, blocking regimes that favour the advection of polar cold air over Western Europe [9].

2.2. Impacts on the stratosphere

Encyclopedie environnement - soleil impact climat - impact activite solaire pression atmospherique Pole nord QBO - impact of solar activity atmospheric pressure north pole
Figure 3. The impact of solar activity on atmospheric pressure over the North Pole depends on the QBO phase. Relationship between the altitude of the 30hPa geopotential at the North Pole (mean of January-February; NCEP reanalysis) and the solar radio flux at 10.7cm, over the period 1948-2015, with a distinction of the direction of the low stratospheric jet winds (QBO phases). [© G. Delaygue]
Unlike the surface, this 11-year-old solar signal is well marked in the stratosphere. Variations in temperature, geopotential and meridian circulation (known as Brewer-Dobson’s circulation) are well documented (Figure 3). The mechanism involved, tested using models describing physical and chemical processes [10], is the strong absorption of UV radiation by the ozone cycle, which warms the air and modifies the meridian temperature gradients. The relative variations in UV radiation during a solar cycle are large compared to the variations in total irradiance (10 to 100 times larger, relatively). These impacts on the stratosphere affect the intensity of the Arctic polar vortex, especially in winter, which in turn affects the lower troposphere at high and mid-latitudes. These impacts of the solar cycle are modulated by the direction of circulation of the stratospheric jet stream, a direction that is reversed about every two years (‘quasi-biennial oscillation’, QBO) [11] (Figure 3).

2.3. Possible impacts on cloud formation

Solar activity modulates not only the radiation of the Sun but also the flow of energy particles that penetrate the Earth’s atmosphere. This flow is primarily formed by the galactic cosmic radiation, deflected by the solar magnetic field (which varies with the activity of the Sun). Energetic particles are also emitted by the Sun itself, particularly during eruptions. These energetic particles interact with molecules in the atmosphere to form ions. The hypothesis that this ionization has a climatic impact dates back to more than 50 years [12], but remains highly debated, both theoretically and in observations. The mechanism most often advanced is that these ions would promote the formation of condensation nuclei necessary for cloud formation.

The role of clouds on heat exchange in the climate system is fundamental, via radiative fluxes, in visible and infrared wavelengths, but also latent heat fluxes. Solar modulation of the flow of energetic particles has a very limited direct climatic impact, but a very strong amplification could exist via this control on clouds. However, the various proposed correlations between energetic particle fluxes and cloud cover remain highly debated [13].

3. Impacts of secular variability on climate: the last millennium

The Maunder Great Solar Minimum (~1645-1715), well known by sunspots, took place during a period described by historians in Europe as the “Little Ice Age” [14]. However, this cool period remains poorly defined in time, probably because the decadal variability was strong compared to the climate change, and also because its definition depends on the considered criteria and regions. In its wide acceptance, the Little Ice Age extends from the 15th century to the middle of the 19th century, an end marked by the massive retreat of alpine glaciers.

Interpretation of historical and natural records (tree rings, in particular) in terms of local climatic conditions (temperature and/or precipitation) confirmed that the Little Ice Age was a detectable phenomenon on the scale of the Northern Hemisphere, but with a small amplitude (about 0.2ºC) compared to regional and temporal variability (i.e., colder and warmer decades).

Climate models are used to test the respective importance of different factors of climate change, including solar variability. These factors are taken into account by the radiative imbalance they are responsible for (‘climate forcing’,[link: point 1.3]). Recent studies agree with a small but detectable contribution of the solar activity to surface temperature variations from regional to global scales. However, the contribution of strong volcanic eruptions to these temperature variations has been revised upwards by these studies, including at decadal and even centennial scales [15].

4. Conclusion

It therefore seems likely that solar activity has had more pronounced climate impacts at the regional scale than at the global scale, at the time scales considered here. Better reconstructions and simulations of these regional climate variations, and independently of climate forcings, are needed to understand their relationships. These studies of the last few centuries make it possible to consider the climatic impact of the Sun over the next few centuries, particularly with the hypothesis of a return to a very low level: this impact should remain low on a global scale compared to those of anthropogenic forcings (greenhouse gases, albedo), but at a regional scale it will continue to interact with climate variability [16].


References and notes

Cover picture. Increase in global temperatures from 1950 to the end of 2013. [Source: NASA (Public domain), via Wikimedia Commons]

[1] Clette, F., L. Svalgaard, J. M. Vaquero, and E. W. Cliver (2014). Revisiting the Sunspot Number. Space Science Reviews, 186, 35-103. http://dx.doi.org/10.1007/s11214-014-0074-2

[2] Ermolli, I., et al. (2013). Recent variability of the solar spectral irradiance and its impact on climate modelling. Atmospheric Chemistry and Physics, 13, 3945-3977. http://dx.doi.org/10.5194/acp-13-3945-2013

[3] Delaygue, G. and E. Bard (2011). An Antarctic view of Beryllium-10 and solar activity for the past millennium. Climate Dynamics, 36, 2201-2218. http://dx.doi.org/10.1007/s00382-010-0795-1

[4] Mélanie Baroni, CEREGE, personal communication, December 2015

[5] Herschel, W. (1801). Observations Tending to Investigate the Nature of the Sun, in Order to Find the Causes or Symptoms of Its Variable Emission of Light and Heat; With Remarks on the Use That May Possibly Be Drawn from Solar Observations. Philosophical Transactions of the Royal Society of London, 91, 265-318, http://dx.doi.org/10.1098/rstl.1801.0015

[6] Pittock, A. B. (1978). A critical look at long-term Sun-weather relationships, Review of Geophysics, 16(3), 400-420, http://dx.doi.org/10.1029/RG016i003p00400

[7] Christoforou, P. and S. Hameed (1997). Solar cycle and the Pacific’centres of action’. Geophysical Research Letters, 24, 293-296. http://dx.doi.org/10.1029/97GL00017

[8] Van Loon, H. and G. A. Meehl (2014). Interactions between externally forced climate signals from sunspot peaks and the internally generated Pacific Decadal and North Atlantic Oscillations. Geophysical Research Letters, 41, http://dx.doi.org/10.1002/2013GL058670

[9] Barriopedro, D., García-Herrera, R. and Huth, R. (2008). Solar modulation of Northern Hemisphere winter blocking. Journal of Geophysical Research, 113(D14), D14118, http://dx.doi.org/10.1029/2008JD009789.

[10] Marchand, M. et al. (2012). Dynamical amplification of the stratospheric solar response simulated with the Chemistry-Climate Model LMDz-Reprobus. Journal of Atmospheric and Solar-Terrestrial Physics, 75-76, 147-160, http://dx.doi.org/10.1016/j.jastp.2011.11.008

[11] Labitzke, K. (1987). Sunspots, the QBO, and the stratospheric temperature in the north polar region. Geophysical Research Letters, 14(5), 535-537. http://dx.doi.org/10.1029/GL014i005p00535

[12] Ney, E. P. 1959. Cosmic Radiation and the Weather. Nature, 183(4659), 451-452, http://dx.doi.org/10.1038/183451a0

[13] Calogovic, J., Albert, C., Arnold, F., Beer, J., Desorgher, L. and Flueckiger, E. O. (2010). Sudden cosmic ray decreases: No change of global cloud cover. Geophysical Research Letters, 37(3), http://dx.doi.org/10.1029/2009GL041327

[14] Eddy, J. A. (1976). The Maunder Minimum. Science, 192, 1189-1202, http://dx.doi.org/10.1126/science.192.4245.1189

[15] Schurer, A. P., Tett, S. F. B. and Hegerl, G. C. (2014). Small influence of solar variability on climate over the past millennium. Nature Geoscience, 7(2), 104-108, http://dx.doi.org/10.1038/ngeo2040

[16] Ineson, S., Maycock, A. C., Gray, L. J., Scaife, A. A. A., Dunstone, N. J., Harder, J. W., Knight, J. R., Lockwood, M., Manners, J. C. and Wood, R. A. (2015). Regional climate impacts of a possible future grand solar minimum. Nature Communications, 6, http://dx.doi.org/10.1038/ncomms8535


环境百科全书由环境和能源百科全书协会出版 (www.a3e.fr),该协会与格勒诺布尔阿尔卑斯大学和格勒诺布尔INP有合同关系,并由法国科学院赞助。

引用这篇文章: DELAYGUE Gilles (2019年2月28日), Variability of solar activity and climate impacts over the last centuries, 环境百科全书,咨询于 2024年7月27日 [在线ISSN 2555-0950]网址: https://www.encyclopedie-environnement.org/en/climate/solar-activity-variability-and-climate-impacts-case-of-recent-centuries/.

环境百科全书中的文章是根据知识共享BY-NC-SA许可条款提供的,该许可授权复制的条件是:引用来源,不作商业使用,共享相同的初始条件,并且在每次重复使用或分发时复制知识共享BY-NC-SA许可声明。