


Soil biomass
PDF1. Soils are a living resource
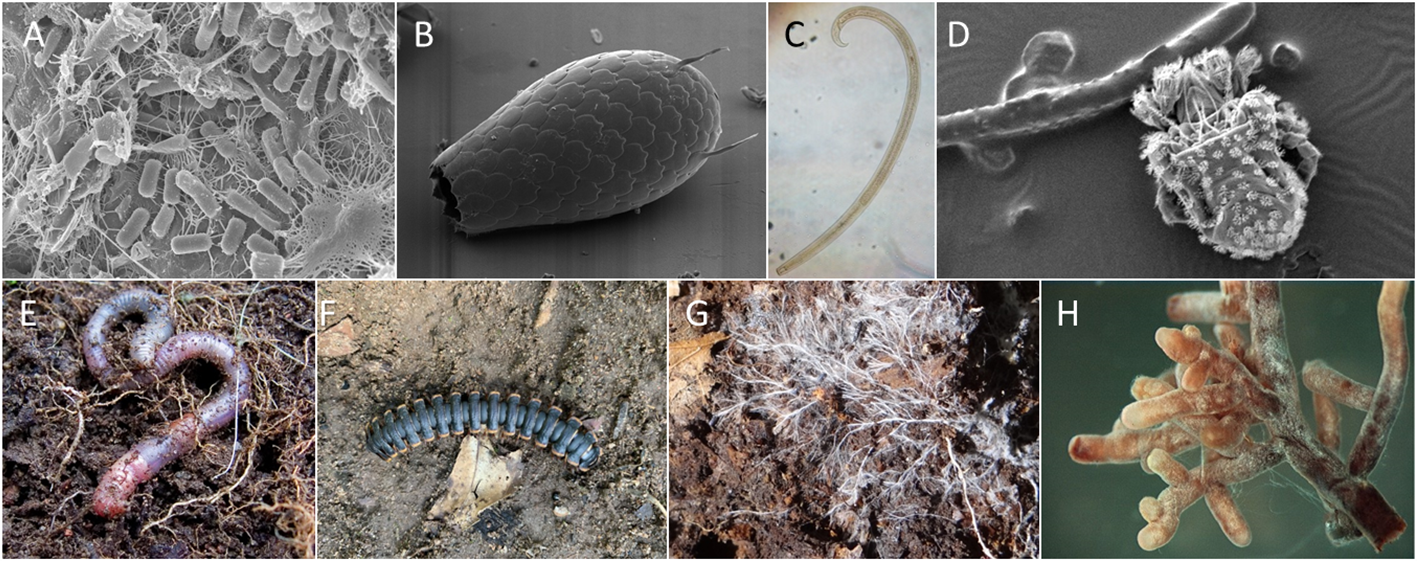
Soils are home to about 25% of the planet’s biodiversity [1],[2]. A huge proportion of living organisms spend a more or less important part of their life cycles in soils. These include a myriad of micro-organisms (e.g. bacteria, fungi, protozoa and nematodes) and mesofauna (e.g. acari and springtails), as well as the more familiar macro-fauna (e.g. earthworms and termites). They interact with one another and with the various plants, micro-organisms and animals of the ecosystem, forming a complex web of biological activity (See Soil Biodiversity & Collembola: actors of soil life).
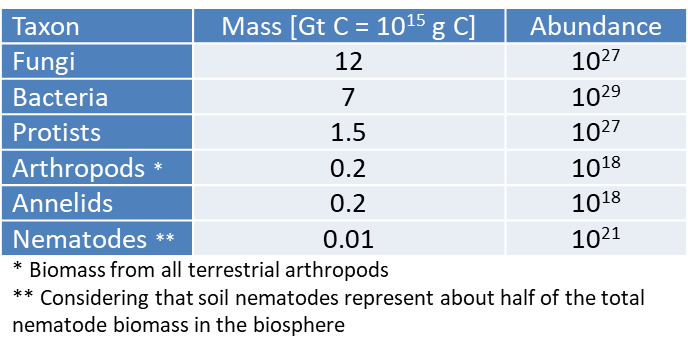
Soils are the foundation of every terrestrial ecosystems: each biomeSet of ecosystems characteristic of a biogeographical area. A biome is an expression of the ecological conditions of a place (climate, soil, etc.); it is defined by vegetation with a dominant life form (trees, shrubs, herbaceous plants) that remains stable over generations. Tropical or temperate deciduous forests (i.e. populated by very tall deciduous trees), mangroves and tundra are examples of biomes.has soils with its own characteristics. They contribute via a wide range of services to the sustainable functioning of all ecosystems. Although soil biodiversity differs in tropical forests, savannahs, pastures, tundras, etc., the overall soil biomass remains dominated by the same major taxa: fungi, bacteria and protists (Table 1). [3]
Table 1. Distribution of biomass according to groups of living things in soils. (expressed in Gt C). Of course, the carbon contained in living organisms represents only a fraction of the carbon in soil organic matter (litter, etc…). [Table based on data from Bar-On et al. ref [3]; Open access article distributed under CC BY-NC-ND 4.0 license]
2. A world dominated by Fungi and prokaryotes
The total soil microbial biomass of 20 Gt C is mostly fungal biomass (≈12 Gt C, a value to be compared with that of marine fungi ≈0.3 Gt C) [4]. The global fungal biomass estimate is based on two contributions, one from soil fungi (there are approximately ≈100 meters of fungal hyphae per gram of soil) [4], and the second from plant-associated mycorrhizal symbionts:
- Ectomycorrhizae are also fungal symbionts of plants, but they do not penetrate the cell walls of their hosts. They are found primarily in boreal forests and many temperate forests (e.g., those dominated by Pinus) [5]. The total biomass of ectomycorrhizal fungi is roughly ≈0.2 Gt C;
- Arbuscular mycorrhizae are fungal symbionts that penetrate the cell wall of their host cells. Plants associated with this type of fungi predominate in deserts, grasslands, shrublands, and tropical forest ecosystems [6]. The biomass from arbuscular mycorrhizal fungi accounts for approximately ≈0.15 Gt C.
Of the ≈8 Gt C of prokaryotic biomass in the soil, most is due to bacteria (≈7 Gt C) and only about ≈0.7% is due to archaea (≈0.5 Gt C) [4]. Interestingly, soil is one of the top 5 habitats for bacteria and archaea (3 × 1029 cells), the others being: deep oceanic subsurface (4 × 1029), upper oceanic sediments (5 × 1028), deep continental subsurface (3 × 1029), and oceans (1 × 1029) [7].
Protists are eukaryotic organisms that are neither animals, plants, nor fungi. Most of them belong to little-known groups of parasites, symbionts, and predators of all kinds; with the exception of the Metazoa group, protists are found in virtually all groups of Eukaryotes [8]. The biomass of soil protists amounts to ≈1.5 Gt C.
Earthworms are the most conspicuous soil species; their density is highly variable across biomes and depth. Biomass estimatation is ≈0.2 Gt C. About half of the biomass of nematodes, an animal phylum containing both marine and terrestrial species, is found in soil (≈0.01 Gt C).
Biomass of terrestrial arthropods (≈0.2 Gt C) is distributed in almost equal amounts in the canopy, litter, and soil stricto sensu.
3. Focus on arthropods
- The total mass of soil arthropods was estimated to be approximately 200 million metric tonnes (Mt) of dry weight (uncertainty range: 100 to 400), or 0.1 Gt of carbon. The average dry biomass density of all soil arthropods ranges from roughly 3 g/m2 in tropical and subtropical forests (dominated by termites) down to about 0.1 g/m2 in deserts and xeric shrublands.
- The total population of soil arthropods to be approximately 1 × 10¹⁹ (uncertainty range, 0.5 × 10¹⁹ to 2 × 10¹⁹) individuals. Microarthropods, mites and springtails account for more than 95% of the total soil arthropod population, with mites making up about two-thirds of this. The population density is dominated by mites and springtails and ranges from about 200,000 individuals/m2 in boreal forests down to roughly 1000 individuals/m2 in deserts and xeric shrublands.
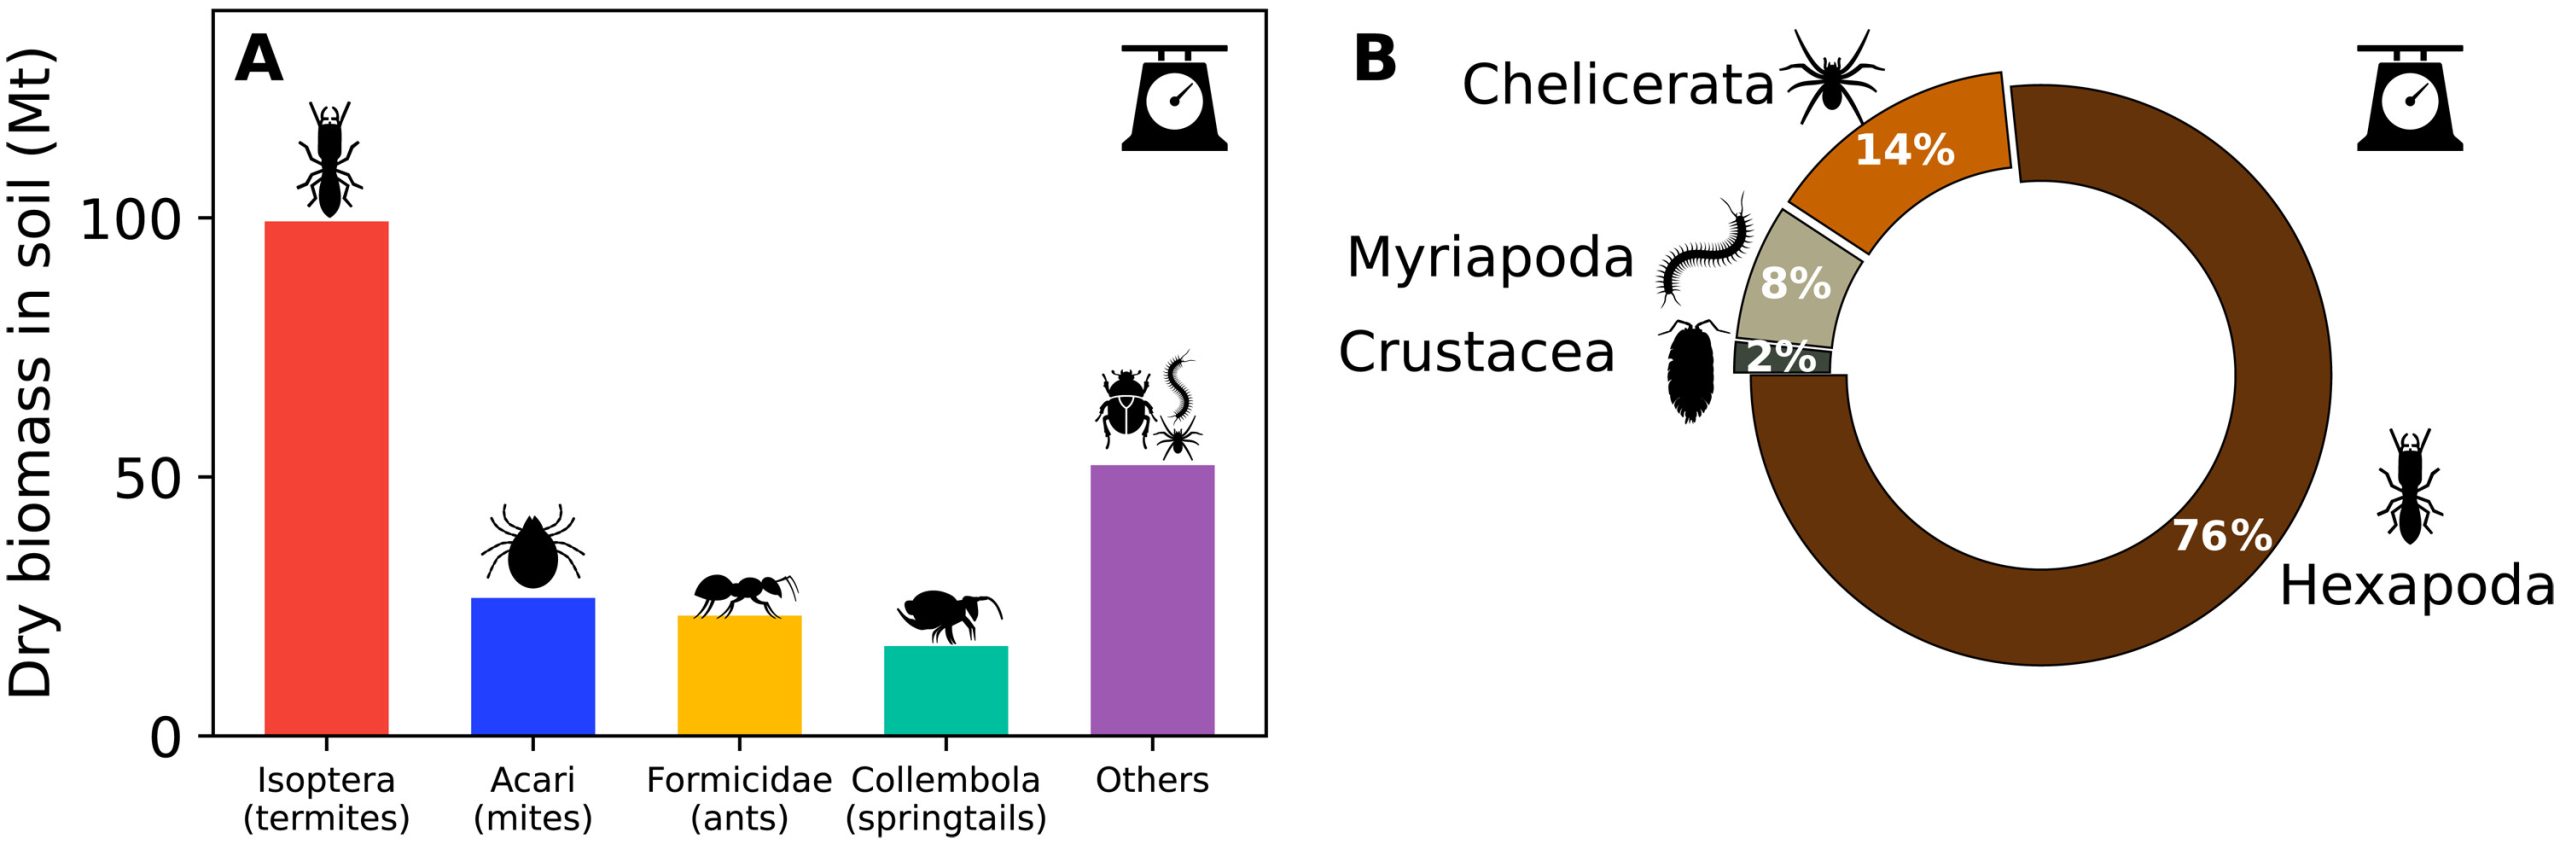
- Termites contribute about 40% of soil biomass; ants, springtails, and mites each contribute about 10%; and other soil arthropods contribute the remainder, as shown in Figure 3A.
- Hexapods contribute most to the total biomass of soil arthropods (≈77 per cent). Insects dominate the subphylum Hexapoda, with springtails accounting for only about 10% of its biomass in soils. Ants and termites alone constitute ≈55% of the total biomass of soil arthropods.
- Coming next, chelicerates (e.g., spiders and mites) and myriapods (e.g., millipedes and centipedes), each contributing about 10%. Crustacea (e.g., woodlice) account for only about 2%.
The combined dry biomass of all terrestrial arthropods is estimated at approximately 300 Mt (uncertainty range, 100 to 500) – equivalent to 0.15 Gt C. This estimate of the global biomass of terrestrial arthropods highlights a knowledge gap that future research should strive to fill.
This integrated dataset allows us to estimate that terrestrial arthropods have a biomass that is an order of magnitude greater than that of wild mammals [4]. Their biomass is similar to that of all humans and livestock combined, as well as that of earthworms, enchytraeids and nematodes combined [4]. However, the biomass of terrestrial arthropods is one order of magnitude lower than that of marine arthropods (dominated by crustaceans) and two orders of magnitude lower than that of soil microbes [4].
4. Depth distribution of soil biomass
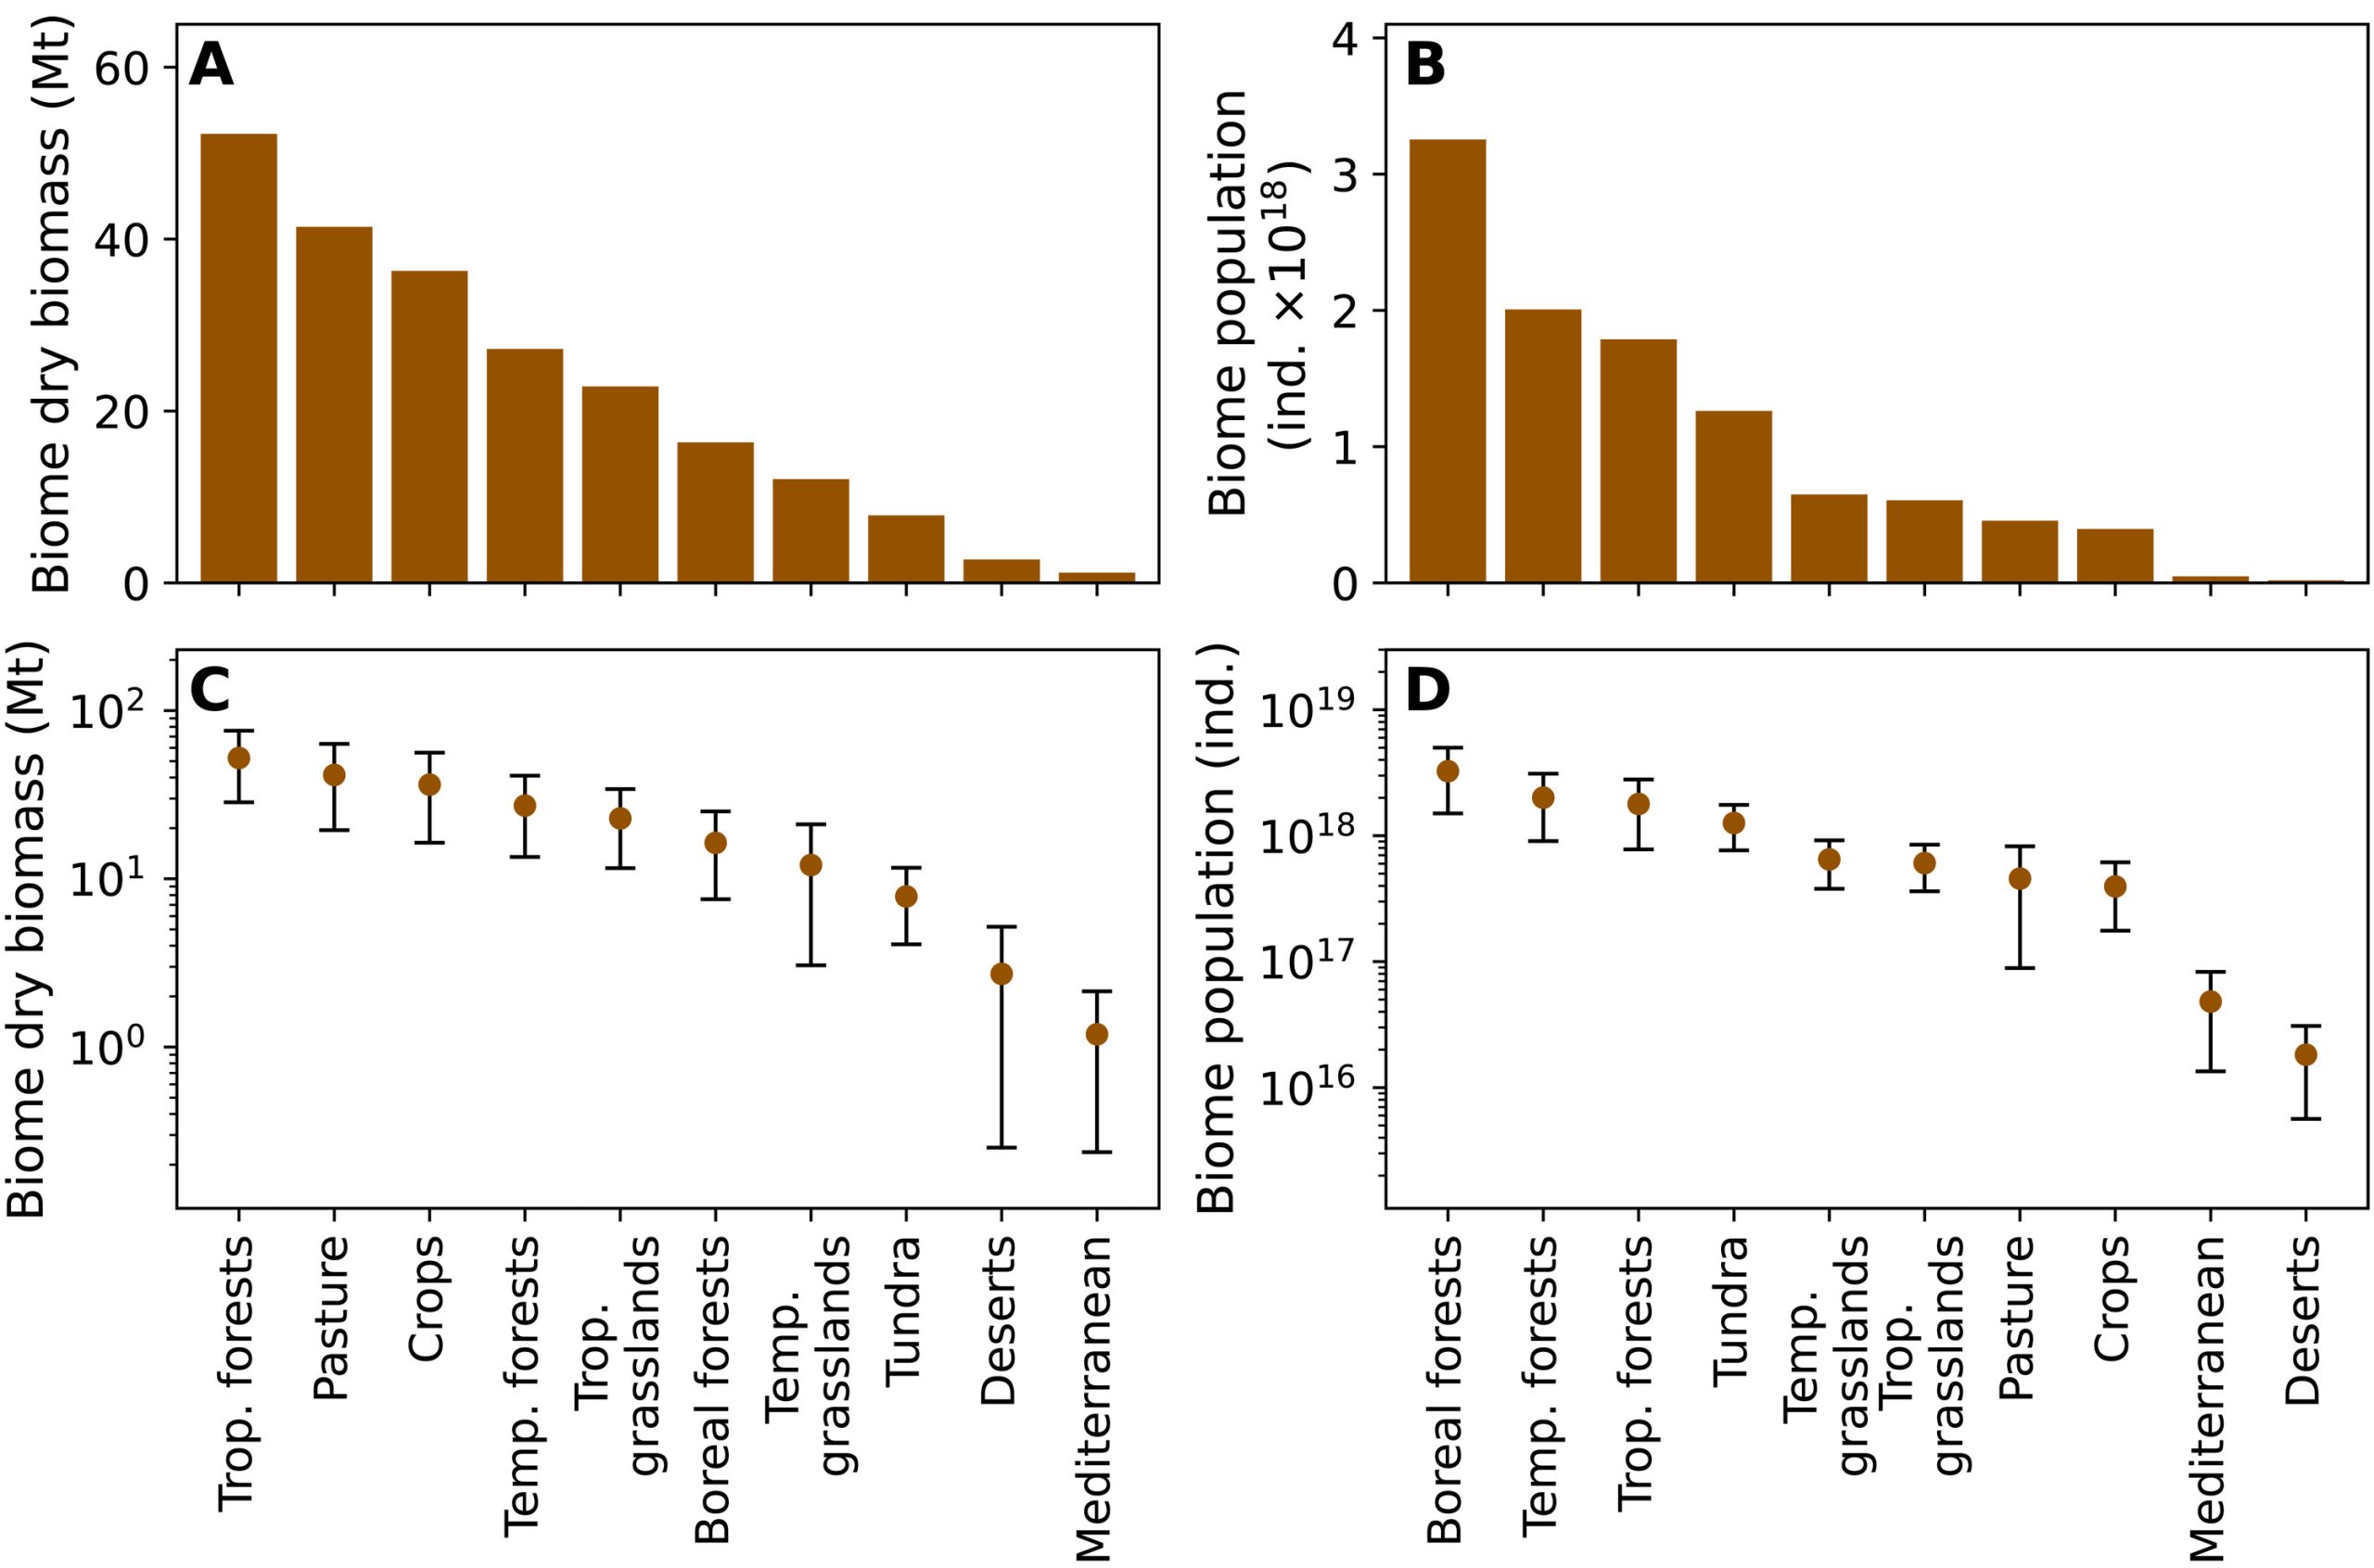
Soil biomass is distributed in the various horizons from the soil surface, where the litter is located, to several meters depth (Figure 3). Many soil faunal biomass data may contain measurements of both soil and litter communities. The total weight of soil is ≈400 times greater than the weight of litter (litter weighs ≈0.5 kg m-2, and the relevant soil section weighs ≈200 kg m-2).

- Plant litter corresponds to about ≈80 Gt C.
- Microbial biomass (bacteria, archaea, fungi, and protists) in litter is estimated to be less than 1% of the total mass of organic carbon in litter. This means that the amount of microbial biomass in the litter will not exceed 1 Gt C, which is less than 10% of the total biomass of soil microbes.
Thus, the contribution of litter microbes does not dramatically affect estimates of the total biomass of soil prokaryotes, protists, or fungi [3].
The major part of the biomass from most living organisms is found in the top ≈10-20 cm of soil. Estimates of soil biomass also include the biomass contribution of litter nematodes and annelids (See Soil biodiversity).
However, several studies have analyzed microbial biomass (which includes both fungi and other microbes such as prokaryotes) at a deeper depth in forest and other soils. Bacterial cells below 1-meter depth constitute ≈15-≈30% of the total amount of bacterial cells in soils: cell densities range from 4×10⁷ (forests) to 2×10⁹ cells per gram of soil in the top meter of soil to a density of 106 to 108 cells per gram of soil for 1-8 meters depth.
The deep continental subsurface, which includes the earth’s subsurface more than 8 meters below ground level, is dominated by bacteria and archaea. Their quantitative estimation remains very difficult.
Notes and references
Cover image. Earthworm photo © pfly via Flickr, CC BY-SA 2.0 license, Source: https://www.flickr.com/photos/24934185@N00/128621319/
[1] FAO soil portal. http://www.fao.org/soils-portal/soil-biodiversity/en/
[2] European Soil data center (ESDAC). https://esdac.jrc.ec.europa.eu/themes/soil-biodiversity
[3] Bar-On Y.M., Phillips R. & Milo R. (2018) The biomass distribution on Earth. Proc. Nat. Acad. Sci. U.S.A. 115:6506-6511; DOI: 10.1073/pnas.1711842115
[4] Bardgett R.D. & van der Putten W.H. (2014) Belowground biodiversity and ecosystem functioning. Nature 515(7528):505-511.
[5] Shi M., Fisher J.B., Brzostek E.R. & Phillips R.P. (2016) Carbon cost of plant nitrogen acquisition: global carbon cycle impact from an improved plant nitrogen cycle in the Community Land Model. Glob Chang Biol 22(3):1299-1314.
[6] Terrer C., Vicca S., Hungate B.A., Phillips R.P. & Prentice I.C. (2016) Mycorrhizal association as a primary control of the CO₂ fertilization effect. Science 353(6294):72-74.
[7] Flemming, H.-C. & Wuertz, S. (2019) Bacteria and archaea on Earth and their abundance in biofilms. Nat. Rev. Microbiol. https://doi.org/10.1038/s41579-019-0158-9
[8] Vincent F. (2019) Plankton, the new frontier, Planet Vie
[9] Rosenberg, Y., Bar-On, Y., Fromm, A., Ostikar, M., Shoshany, A., Giz, O., & Milo, R. (2023). The global biomass and number of terrestrial arthropods. In Science Advances. Zenodo. https://doi.org/10.5281/zenodo.7502034