


Impacts of agriculture on biodiversity and ecosystem functioning
PDF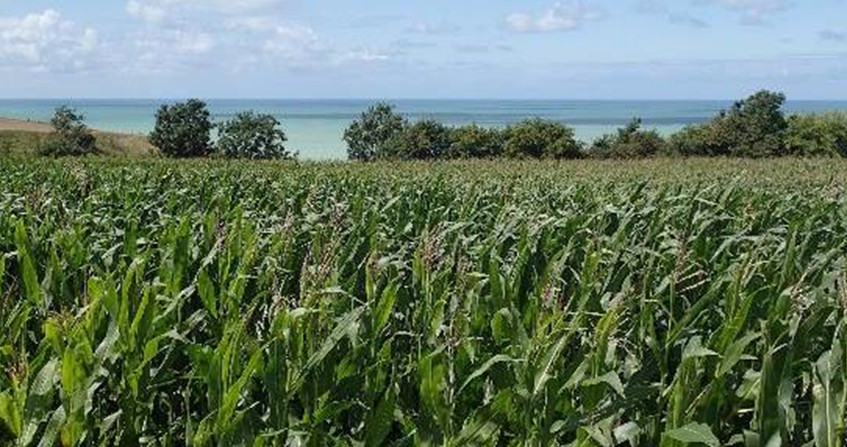
Since its beginnings in the Neolithic period, the expansion of agriculture has been accompanied by technical innovations that have progressively increased agricultural yields and enabled the growth of the world’s human population over the centuries, seemingly pushing back indefinitely the productivity limits of agrosystems and the biosphere. What is the current status of this dynamic? Can we measure the impacts of agriculture on biodiversity and the functioning of (socio-) ecosystems on a global scale? What lessons can we learn for the future?
- 1. The Ouroboros paradox
- 2. Impacts on plant biomass and the productivity of terrestrial ecosystems
- 3. Habitat carrying capacity, abundance of wildlife communities
- 4. Wildlife community composition
- 5. Impact on the number of local species
- 6. Impact on global biodiversity, in number of species
- 7. Impacts on the structure and functioning of ecological networks
- 8. Impacts on the stability of agrosystems
- 9. Impacts on ecosystem functioning
- 10. What future for Ouroboros?
- 11. Messages to remember
1. The Ouroboros paradox
In ancient Egypt, more than 3500 years ago, tombs and papyrus were often decorated with a snake biting its own tail, forming a circular loop (Figure 1).

This Ouroboros also symbolizes the idea of paradox, or impossible action, because it feeds on itself. And in the current French language, the expression “un serpent qui se mord la queue” (a snake biting its own tail) designates a vicious circle, “a succession of problems whose end cannot be seen”. This Ouroboros paradox seems to apply today to human societies confronted with agriculture, both nourishing and destructive.
To the three factors of agricultural development: (i) spatial expansion, (ii) technical progress in agricultural practices and (iii) selection-domestication of more productive animal and plant populations, has been added (iv) the transformation and then globalization of agri-food systems, and of the market chains associated with agriculture.
However, these factors of development and evolution of agriculture are all pressures – or impact factors – on dynamic socio-ecosystems, made up of multiple species (including humans) interacting in their living environment (See focus on What are the major agricultural impact factors?), which interact in a ‘ouroborian’ dynamic/spiral.
2. Impacts on plant biomass and the productivity of terrestrial ecosystems

The annual primary production of an ecosystem is the biomass of autotrophic organisms produced each year by that ecosystem. Its productivity is equal to the rate of biomass production, per unit area and time. Located at the base of food webs, or ‘food chains’, this primary production conditions the global production and functioning of ecosystems.
With the exception of the Nile Valley and a few other small desert regions, the conversion of “natural” or “semi-natural” terrestrial habitats such as forests and marshes into pastures and cultivated fields results in a net reduction in the biomass and plant productivity of the ecosystems concerned.
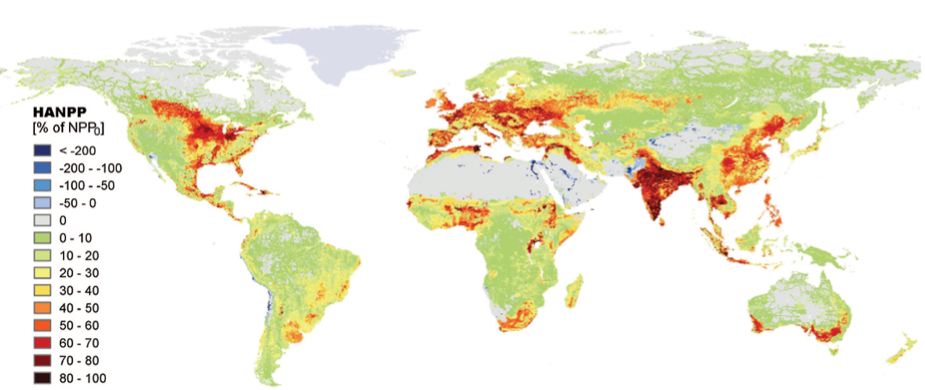
The annual plant production of terrestrial habitats has been reduced by about 10% globally [2] since the beginning of agriculture, due to land use changes. Moreover, about 20% of this terrestrial plant production is taken up annually by humans through agriculture, with large variations between regions (Figure 3).
3. Habitat carrying capacity, abundance of wildlife communities
While forests and other natural habitats support complex and diverse species networks, agrosystems dedicated to the cultivation of a small number of domesticated species inherently contain fewer wildlife individuals than the surrounding natural habitats. Intensive agriculture moreover reduces the carrying capacity of cultivated plots for wild species in many ways: through the physical removal of trees and hedges, soil erosion, elimination of messicolous plants, insecticide, antibiotic or antifungal treatments, surface water drainage, pollution or possible salinization of the soil, etc. Thus, the conversion of (semi-)natural habitats into intensive agricultural systems considerably reduces the biotic capacity of these habitats for wildlife communities, in terms of numbers of individuals.
On a global scale, based on 1990 estimates of the area of major terrestrial biome types by Klein-Goldjewijk [4], Gaston et al. [3] estimated the reduction in global ‘terrestrial’ avifauna (excluding seabirds) due to the expansion and intensification of agriculture from the Neolithic period to 1990 to be about 30 billion birds, or 20-25% of pre-agricultural numbers.
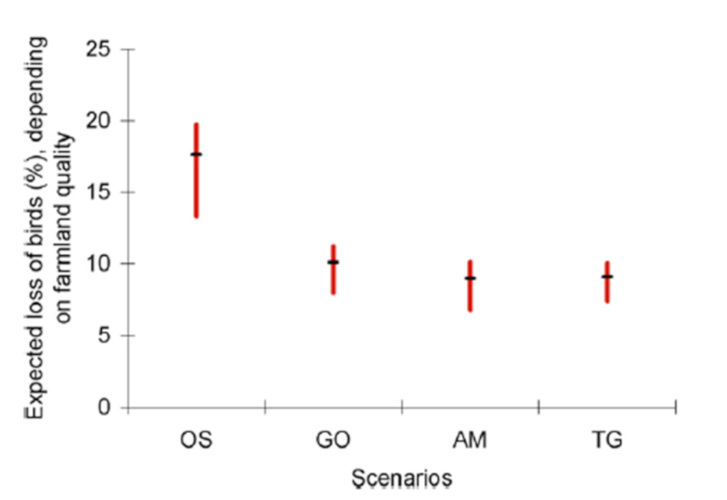
Applying these estimates of bird density per habitat to the four land-use change scenarios developed for 2050 at the global scale by the Millennium Ecosystem Assessment (MEA) [5], Teyssèdre and Couvet [6] estimated the loss of global terrestrial avifauna due to agricultural expansion and intensification expected in 2050 to be between 10 and 25% of 1990 numbers, depending on the land-use scenario considered (Figure 5). Unsurprisingly, the worst scenario for biodiversity is the so-called ‘Order from strength‘ scenario of reactive and regionalized ecosystem management, without anticipation or interregional collaboration.
This amounts to a reduction of 27 to 45% in the number of breeding birds, from the beginning of agriculture to 2050, depending on the scenario considered. A rather bleak outlook, considering that current socio-economic development trajectories are similar to the worst-case scenario of the MEA! (see IPCC [7]).
As a result, birds are a good indicator of terrestrial biodiversity, recognized internationally by the Convention for Biological Diversity (CBD) since 2004 [8] (see Figure 7 below). Although in a less systematic, collaborative and standardized way, variations in abundance of other groups of organisms have been monitored at the local scale by many researchers (see below), in many geographical locations, which confirm and reinforce the results obtained on avifauna.
Like all ecosystems, agrosystems are open systems, interacting with their environment and the surrounding landscape. While the direct impacts of ‘extensive’ agriculture on biodiversity are essentially local, i.e. restricted to ecosystems converted for agriculture, those of intensive agriculture go far beyond the boundaries of cultivated fields, via the dispersion of pollutants. Transported by air, surface water or mobile animals (insects, vertebrates…), locally applied chemical compounds reach and affect adjacent or even distant ecosystems. Thus, fertilizers and pesticides spilled on fields and washed off during rainfall, or reaching the water table, are harmful to ecosystems of all types downstream.
Pollution of the coastline by nitrogenous fertilizers used massively in certain regions is well known, which is expressed by recurrent algal blooms (known as ‘green tides’), deleterious for biodiversity, and can transform certain wetlands, estuaries and coastal ecosystems into ‘dead’ zones deprived of aerobic species (Figure 6).

On a global scale, compiling data from 166 insect abundance monitors on all continents (1676 sites), van Klink et al. [13] estimated a less severe average decline in terrestrial insect abundance (of about 1% per year), largely attributed to agricultural intensification.
4. Wildlife community composition
Species occupy ecological niches* of varying sizes. Equipped to exploit certain resources, specialist species are more competitive than generalists in their preferred habitat(s); generalist species, on the other hand, thrive in variable habitats or in a mosaic of different habitats, and are more tolerant of unexpected changes in their living conditions.
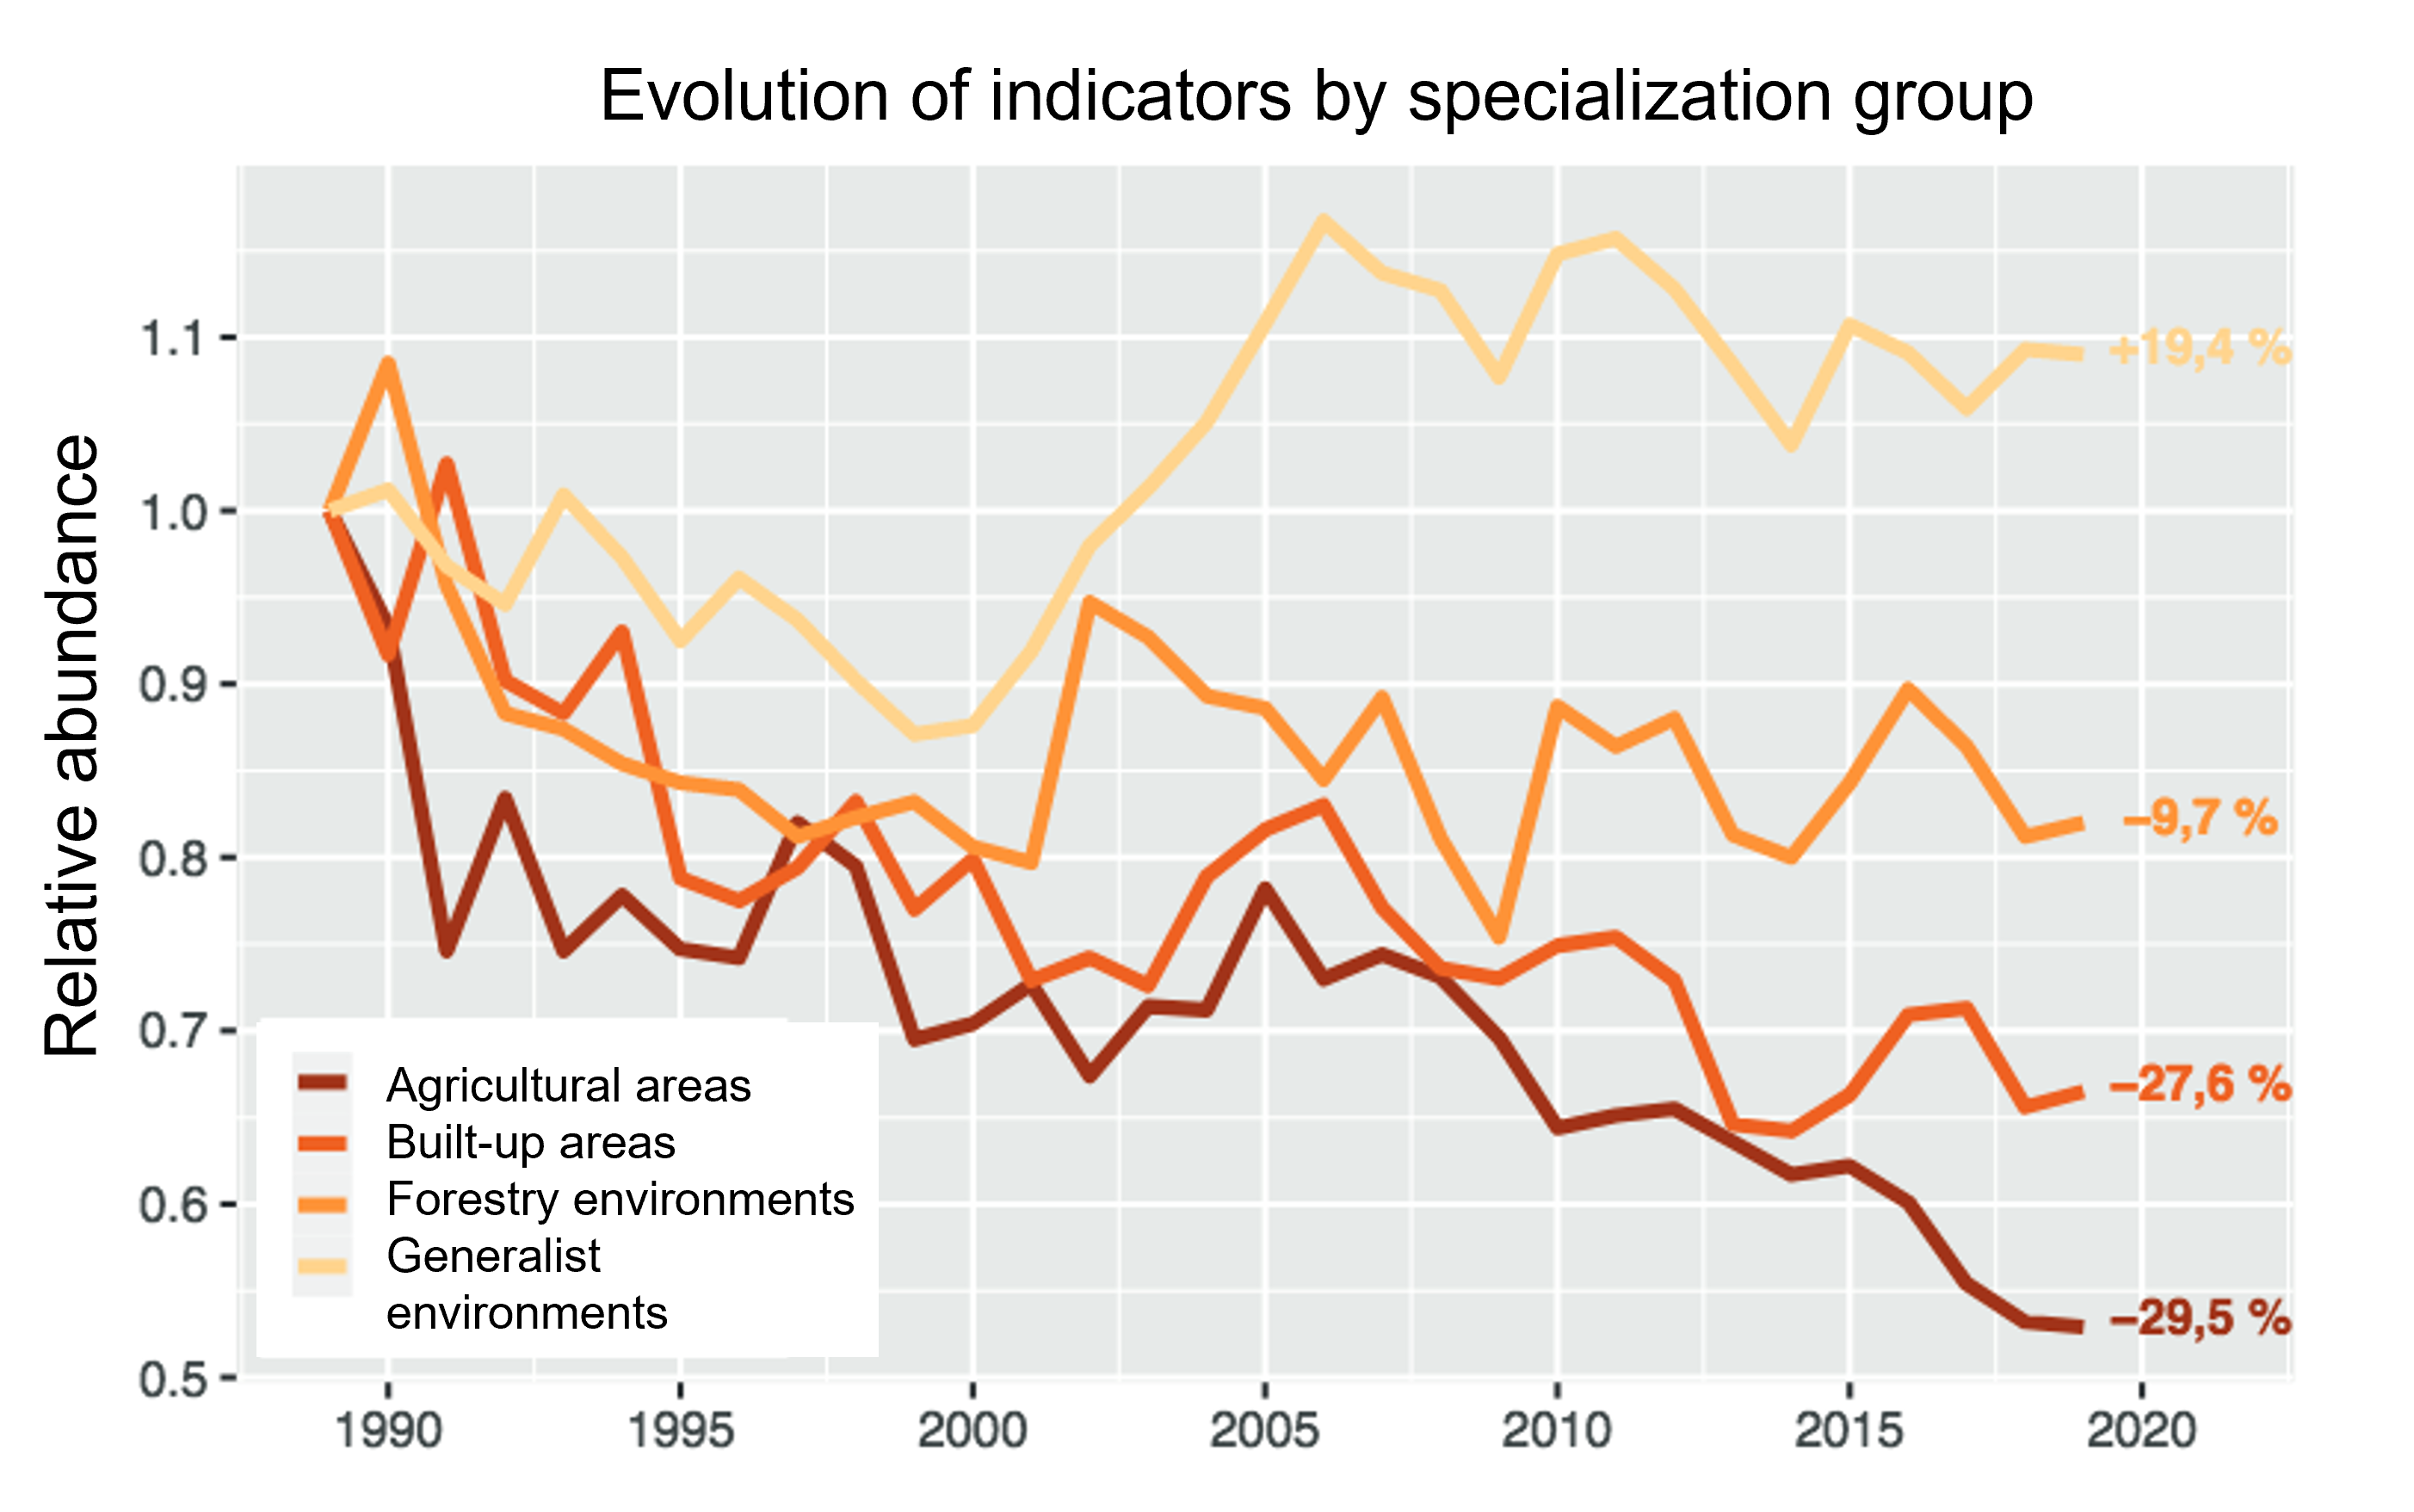
Therefore, conversion of habitats to agriculture not only generally reduces the abundance of local biotic communities, but also affects their composition. For example, conversion of forests to fields and pastures replaces the original forest communities, dominated by forest specialists, with ‘agricultural’ communities dominated by grassland (and other open habitats) specialists. The intensification of agriculture, as well as the fragmentation of (semi)natural habitats for agriculture, disadvantages specialist species and increases the proportion of generalists.

Whether for birds, insects (Figure 8) or other taxa, numerous biodiversity monitoring studies highlight the depletion of specialist species in the sites studied, attributed mainly to agricultural intensification, pollution and global warming (e.g. [15] and [10]).
At the scale of landscapes and regions, the expansion of generalist species (possibly originating from other regions of the globe) or/and commensals of humans, associated with the decline of specialist species, results in an increasing resemblance of ecological communities, known as ‘functional homogenization‘, current in regions of intensive agriculture ([15], [16]).
5. Impact on the number of local species
If we assume that the number of species – or ‘species richness‘ – of a biotic community increases with its abundance in number of individuals [17], we can expect that the expansion and intensification of agriculture, by reducing the abundance of local communities of wild species, will also reduce their (local, so-called ‘alpha’) diversity in number of species.
This can be explained simply by considering that the decline of specialist species, in number of individuals, does not mean their immediate local disappearance. On the contrary, the colonization of a transformed habitat by new generalist species implies both an increase in the number of species and individuals (generalists). Schematically, the total number of local species increases with habitat disturbance as long as colonization by new generalist species exceeds the local loss of specialist species; then it decreases when the latter exceeds the contribution of generalist species.
In short, unlike their specialization index, the species richness of local communities cannot be a good indicator of the stability or ‘quality’ of habitats, especially agricultural ones, since it increases or decreases with the degree of disturbance. This theoretical prediction is confirmed by avifauna monitoring [16] and by other biodiversity monitoring, in terrestrial or aquatic environments. A meta-analysis of biodiversity monitoring conducted at local or regional scales for more than 30 years [19] shows a change in community composition over time and confirms the erosion of biodiversity at the global scale, but does not observe any general decreasing trend in the number of local species (see also Teyssèdre and Robert [20]).
6. Impact on global biodiversity, in number of species
Given the lack of knowledge about the global diversity of bacteria, archaea, protists, ‘algae’ and fungi, it is difficult to estimate the impact of agriculture on the total number of species in these vast kingdoms of Life. The same is true for most of the major animal groups, with the exception of three more widely studied groups, insects, mammals and birds.

For vertebrates, the IUCN [22] estimates that 26% of mammal species, 14% of bird species and 41% of amphibian species are currently threatened with extinction, under pressure from the same anthropogenic factors identified above for insects.
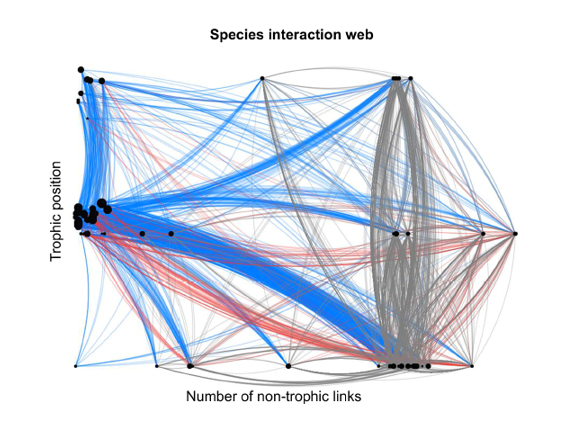
7. Impacts on the structure and functioning of ecological networks
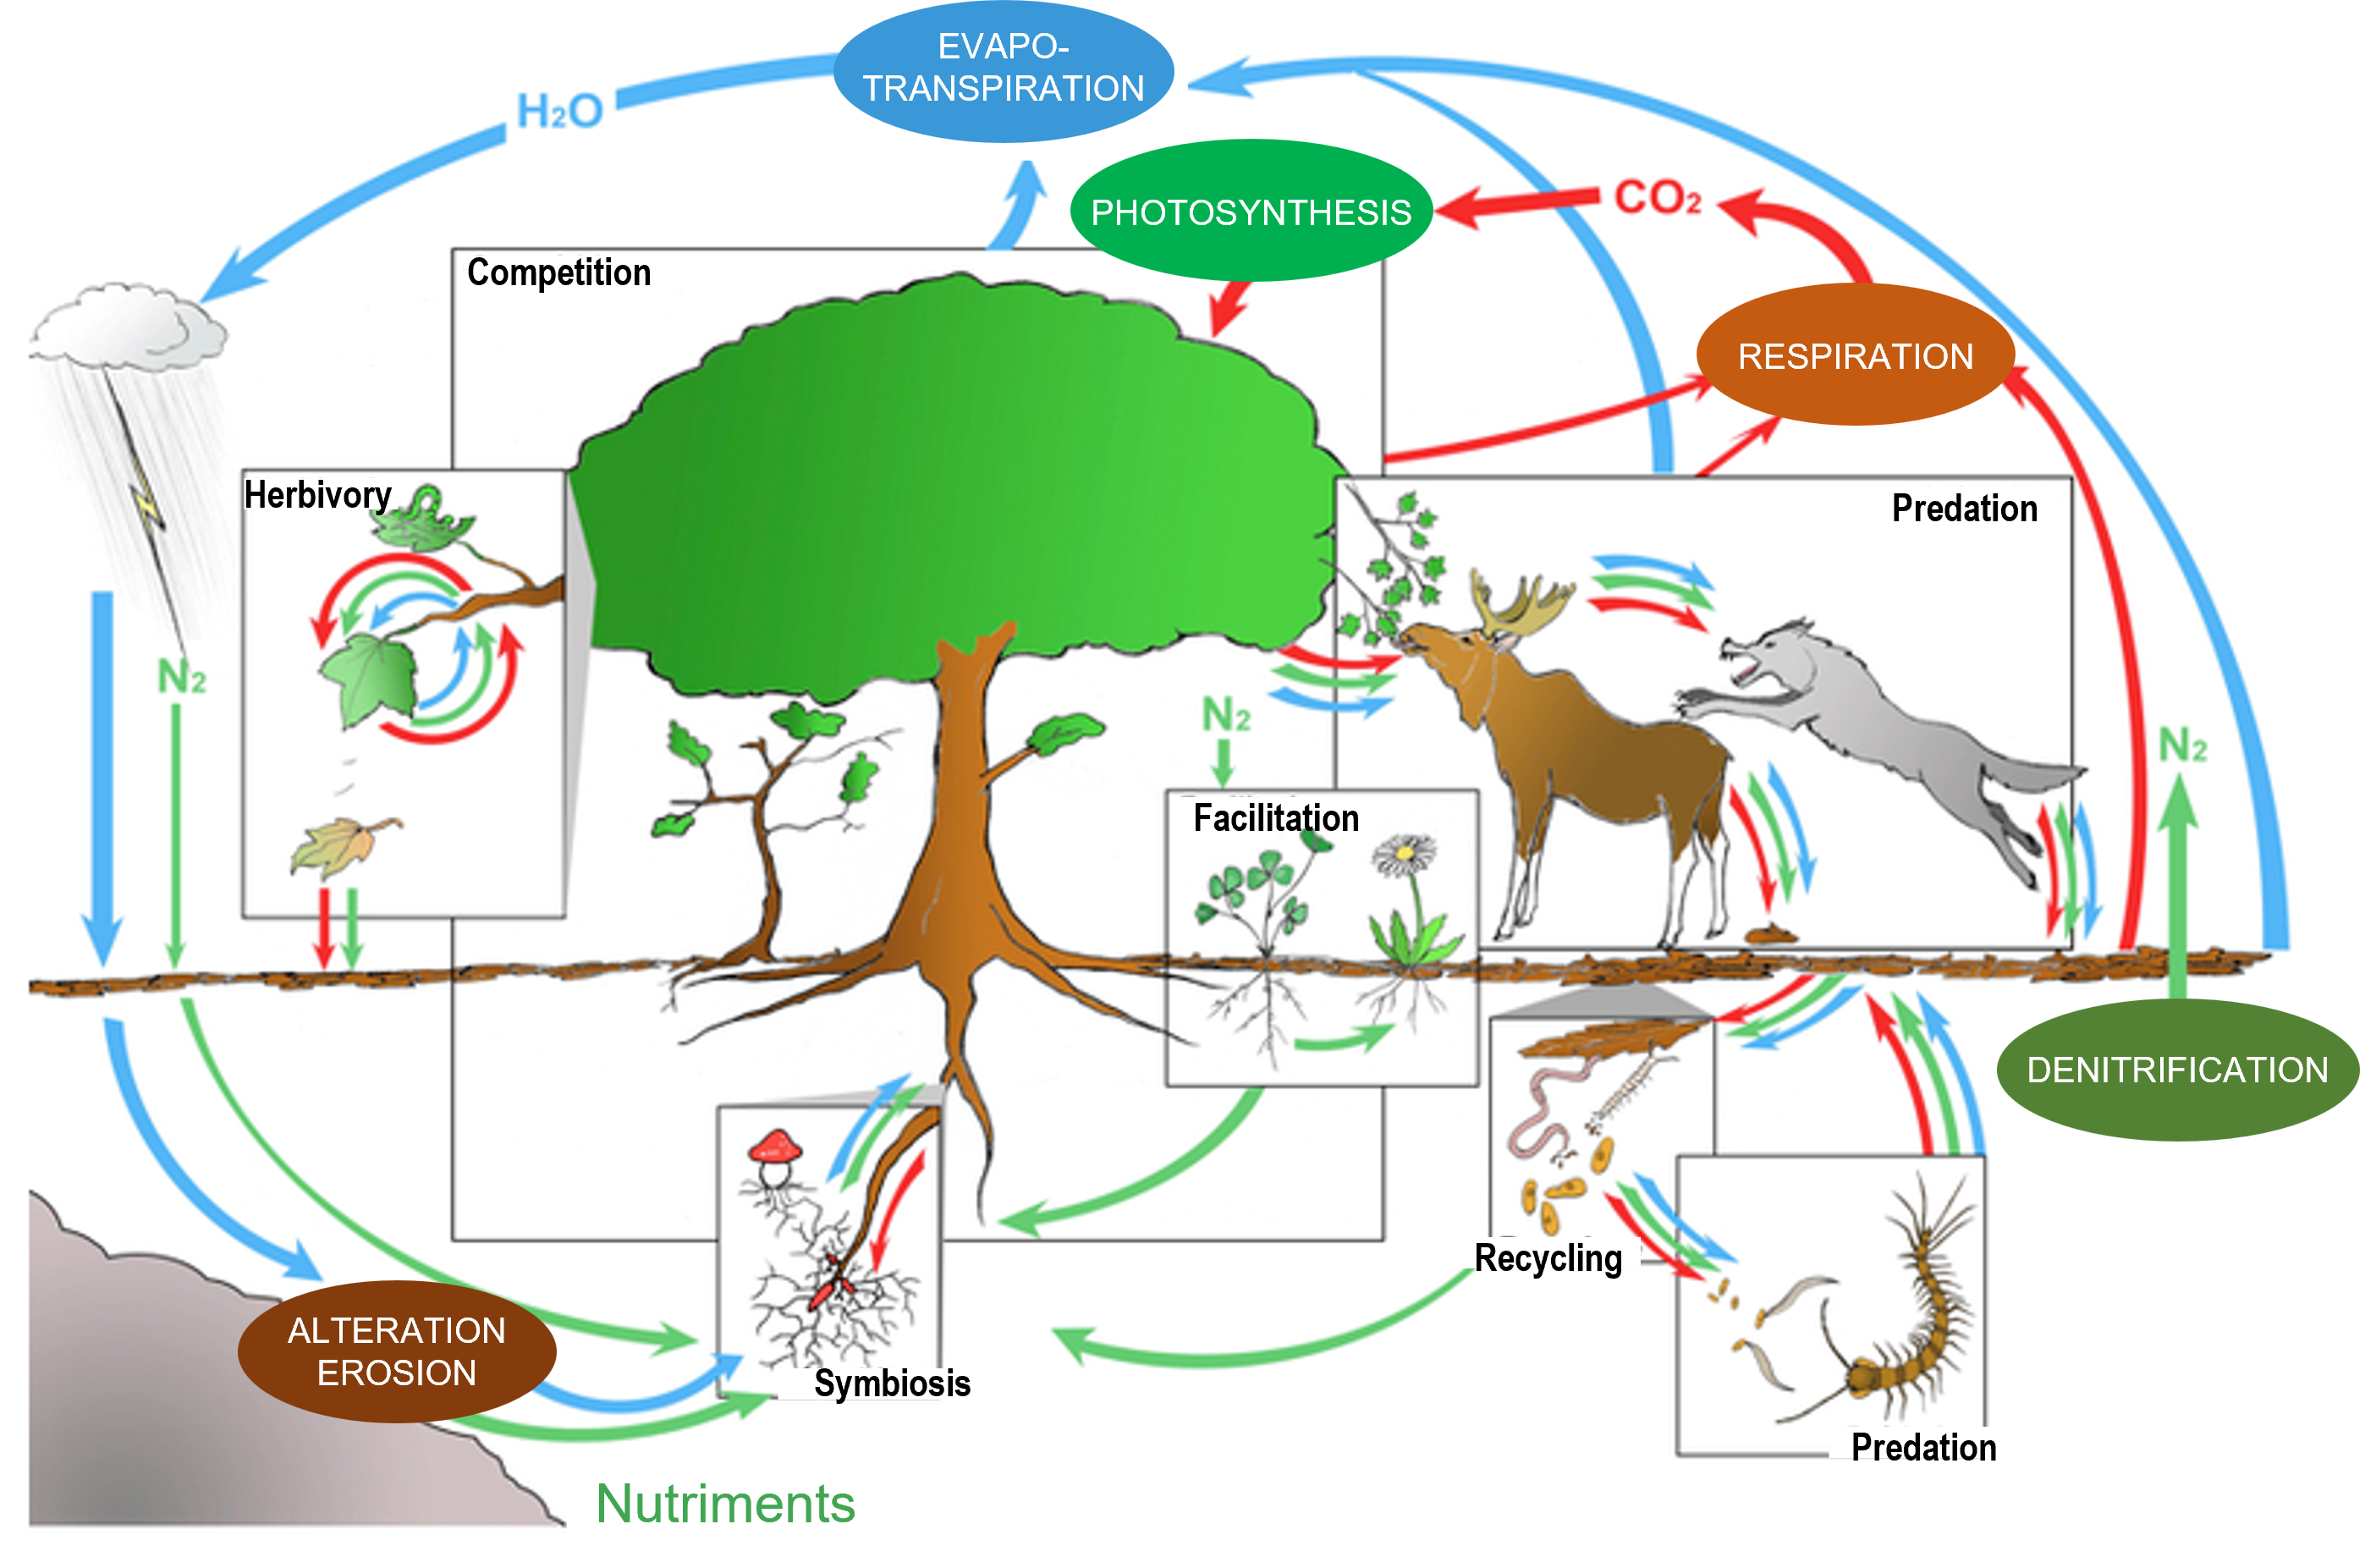
In a minimally anthropized ecosystem, the interactions between species are usually multiple, ancient and diversified: trophic relations, of course, between predators and prey or between host species and parasites (or parasitoids), from the base to the top of the ‘food chains’; but also relations of competition for resources, of facilitation (to the installation of other species) or of mutual aid, between species of varied trophic levels (e.g. Couvet and Teyssèdre [23], and Figure 12).
Among the cooperative relationships, or mutual aid, we can cite the nutritional associations between plants and bacteria (Rhizobium in the roots) or between plants and fungi (e.g. mycorrhizae), the services exchanged between flowering plants and pollinating insects (feeding vs. reproduction), between parasitized species and predators of parasites (feeding or sheltering vs. protection), the dispersal of seeds by insects, birds and mammals (granivores or frugivores), etc. The repetitiveness of interactions contributes over time to the co-adaptation (and synchronization) of species sharing the same habitats, while their diversity contributes to the stability of ecological networks [24] (Figure 13).[25]
The diversity of detritivorous, coprophagous, saprophytic and recycling organisms is in turn reduced and largely relocated outside the fields, in the slurry of livestock buildings, sewers, wastewater treatment plants and downstream water bodies or coastlines.
8. Impacts on the stability of agrosystems
Research over the past 50 years has verified that, at least on a local scale, the functioning and stability of terrestrial ecosystems increases with the diversity of plants they harbor [26].
- Genetic diversity of cultivated species (e.g. [27]),
- Specific and functional diversity of cultivated (polyculture vs. monoculture) and non-cultivated species (e.g. [27] and [28]),
- Abundance of pollinators (e.g. [29]),
- Diversity of trophic levels, including the local presence of natural enemies (predators, parasitoids, etc.) of pests and other crop ‘pests’, possibly from other habitats in the area (e.g. [30]),
- Diversity of non-trophic interactions (including facilitation, e.g. [30], [31]),
- Age of interactions (coadaptation, e.g. [31]),
- Local versus regional diversity, and crop diversity at the national scale (e.g. [29]),
- Diversity of farmer-crop variety networks (e.g. [32]).
In a vicious cycle, the vulnerability of large fields of intensive monoculture to pathogen invasions motivates increased pesticide use by farmers, which further reduces species diversity and their interactions…
9. Impacts on ecosystem functioning
Among the multiple ecosystem functions hindered by the expansion and intensification of agriculture are:
- Air purification by forests and other terrestrial (semi-)natural ecosystems
- Carbon capture and sequestration by these same ecosystems, and thus regulation of the global climate,
- Regulation of local climate by forests and wetlands,
- The moderation of floods and droughts,
- The renewal of water tables,
- Freshwater purification, with an impact downstream on the entire watershed,
- The maintenance and productivity of soils now reduced by erosion, pollution, salinization, …,
- The pollination of wild and cultivated plants by bees and other pollinating insects in decline,
- The resistance of wild and cultivated communities to invasions of parasites and other pathogens,
- The carrying capacity of ecosystems for wild species, especially specialists,
- Their physical and psychological capacity to accommodate domestic and farm animals (confined in large numbers in farm buildings),
- Their capacity to recycle waste, food (including feces) and agro-industrial (including plastics, metals …),
- Their capacity to accommodate humans.
Without exploring here the impacts of technical progress, production and consumption patterns, taxation/subsidy systems or international trade on the evolution of agri-food systems, let us emphasize that the multiple impacts on ecosystem functioning outlined above affect not only non-human biodiversity, but also human populations to a very large extent.
10. What future for Ouroboros?
Thus, it seems that the “Uroborian” dynamic of expansion-intensification of agriculture has reached its limits. To summarize, it can be described as an increasing diversion of the primary productivity (i.e. vegetal) of terrestrial ecosystems – and thus their massive transformation – by certain human societies, to the “benefit” of little diversified plant, animal (including human) and microbial communities, whose fragility increases with that of the impoverished and polluted ecosystems that host them… thus threatening the collapse of the societies that depend on them!
To survive, our old Ouroboros must imperatively review its diet and reduce its appetite (for animal meat and agrofuels, noteworthily). Faced with the multiple impacts of this agricultural dynamic, our societies must question the dominant agricultural systems and develop alternative, sustainable policies and practices that are likely to get them out of this destructive loop for ecosystems and biodiversity. New agricultural policies [34] that, in order to be approved and implemented in a coherent manner, must be part of a general change in the conception, objectives and organization of societies within socio-ecosystems, valuing ecological diversity (regulating), sobriety (sustainable) and environmental equity, rather than the intensive – and unsustainable – production and consumption of agricultural “resources”.
11. Messages to remember
- Since the Neolithic period, the expansion and intensification of agriculture has reduced the plant biomass of terrestrial habitats by about a third. Moreover, nowadays, about 20% of their primary productivity (plant biomass produced per unit area and time) is annually diverted by human societies (for food and other uses), with large variations between regions.
- The transformation of habitats for agriculture reduces the abundance and changes the composition of wildlife communities: the proportion of generalist species increases with habitat disturbance.
- Through its direct and indirect effects, livestock farming has a strong impact on biodiversity and ecosystems. Thus, only 3% of the biomass of mammals is wild today.
- In an agrosystem, the diversity of interactions between species decreases with the increasing intensity of agricultural practices (chemical inputs, mechanisation).
- The resistance of agrosystems to disturbances increases with the diversity and age of interactions between species and decreases with the intensity of agricultural practices.
- The massive disruption of ecosystems by and for agriculture hinders their functioning and productivity in the medium term, to the detriment of human societies and many species.
- The agricultural challenge of the 21st century is huge: to achieve sustainable agriculture, with sufficient production, while preserving biodiversity and mitigating climate change.
—-
This article is a slightly modified version of the author’s “A look at biodiversity” (R103), published in June 2022 by the French Society of Ecology and Evolution (SFE2).
Notes and references
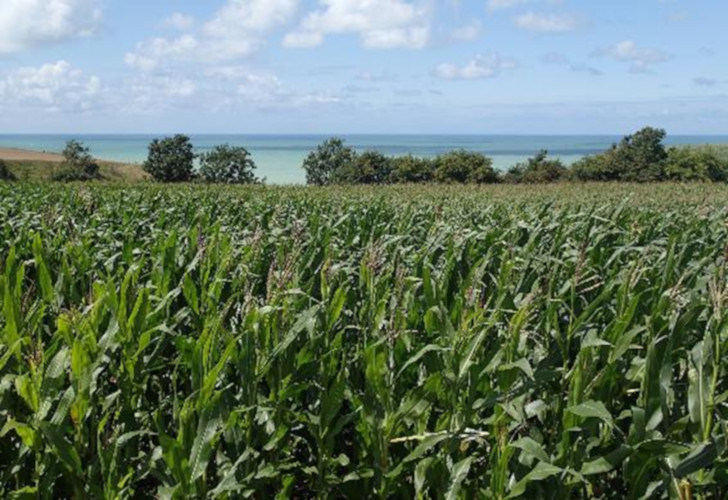
Cover image. Corn field. [Source: Photo © A. Teyssèdre]
[1] Erb K-H et al. 2017. Unexpectedly large impact of forest management and grazing on global vegetation biomass. Nature 553:73-76.
[2] Haberl H., K.H. Erb et al., 2007. Quantifying and mapping the human appropriation of net primary production in earth’s terrestrial ecosystems. Proc. Natl. Acad. Sci. 104(31): 12942-12947.
[3] Gaston K.J., Tim M. Blackburn & Kees Klein Goldewijk, 2003. Habitat conversion and global avian biodiversity loss. Proc. R. Soc. Lond. B 270, 1293-1300. DOI 10.1098/rspb.2002.2303
[4] Klein Goldewijk, K. 2001 Estimating global land use change over the past 300 years: the HYDE database. Global Biogeochem. Cycles 15, 417-433.
[5] Millennium Ecosystem Assessment (MEA), 2005. Ecosystems and Human Well-being: Synthesis, Island Press, Washington DC.
[6] Teyssèdre A. & D. Couvet, 2007. Expected impact of agriculture expansion on the world avifauna. C. R. Acad. Sci. Biology 330: 247-254.
[7] IPCC 2019. Climate and land use changes Report.
[8] Couvet D. et al. 2008. Enhancing citizen contributions to biodiversity science and public policy. Interdisciplinary Science Reviews 33 (1) 95-103.
[9] Ellis E.C., 2011. Anthropogenic transformation of the terrestrial biosphere. Phil. Trans. R. Soc. A 369, 1010-1035. doi:10.1098/rsta.2010.0331
[10] Sánchez-Bayo F. & Wyckhuys K.A.G., 2019. Worldwide decline of the entomofauna: A review of its drivers. Biol. Cons. 232: 8-27.
[11] Hallman et al. 2017. More than 75 percent decline over 27 years in total flying insect biomass in protected areas. Plos One 12, e0185809, Oct.2017.
[12] Seibold et al., 2019. Arthropod decline in grasslands and forests is associated with landscape-level drivers. Nature 574: 671-674.
[13] van Klink et al. , 2020. Meta-analysis reveals declines in terrestrial but increases in freshwater insect abundances. Science 368: 417-420.
[14] Devictor V. et al., 2008. Functional biotic homogenisation of bird communities in disturbed landscapes. Global Ecol. Biogeogr. 17, 252-261.
[15] Clavel J., R. Julliard & V. Devictor, 2011. Worldwide decline of specialist species: toward a global functional homogenization? Front. Ecol. Environ. 9(4): 222-228, doi:10.1890/080216
[16] Le Viol, I. et al. 2012. More and more generalists: two decades of changes in the European avifauna. – Biol. Lett. 8: 780-782.
[17] Hubbell S.P., 2001. The Unified Theory of Biodiversity and Biogeography. Princeton Univ. Press.
[18] Teyssèdre A. & A. Robert, 2014. Contrasted effects of habitat reduction, conversion, and alteration on neutral and non-neutral biological communities. Oikos 123: 857-865.
[19] Dornelas M. et al. 2014. Assemblage time series reveal biodiversity change but not systematic loss. Science 344:296-299.
[20] Teyssèdre A. & A. Robert, 2015. Biodiversity trends are as bad as expected. Biodiversity and Conservation 24 (3): 705-706. DOI 10.1007/s10531-014-0839-7
[21] Bar-On Y.M., R. Phillips & R. Milo, 2018. The biomass distribution on Earth. Proc. Natl. Acad. Sci. 115: 6506-6511.
[22] IUCN, 2020. Global list of threatened species
[23] Couvet D. & A. Teyssèdre, 2010. Ecology and biodiversity, from populations to socioecosystems. Belin, Paris, 340 pp
[24] Hooper D.U. et al., 2005. Effects of biodiversity on ecosystem functioning: A consensus of current knowledge. Ecol. Monogr. Ecological Soc. Am. 75, 3-35; Tilman D., F. Isbell, J. M. Cowles, 2014. Biodiversity and ecosystem functioning. Annu. Rev. Ecol. Evol. Syst. 45: 471-493.
[25] Kéfi S., V. Miele, et al. 2016. How structured is the entangled bank? The surprisingly simple organization of multiplex ecological networks leads to increased persistence and resilience. Plos Biology, August 3, 2016. (DOI:10.1371/journal.pbio.1002527)
[26] Cardinale B.J. et al. 2007. Impacts of plant biodiversity on biomass production increase through time because of species complementarity. Proc. Natl. Acad. Sci. 183: 18123-28.
[27] Zhu Y. et al., 2000. Genetic diversity and disease control in rice. Nature 406, 718-722.
[28] Renard D. & D. Tilman, 2019. National food production stabilized by crop diversity. Nature 571, 257-260.
[29] Deguines N., Jono C. et al., 2014. Large-scale trade-off between agricultural intensification and pollination services. Frontiers in Ecology and the Environment, 12, 212-217.
[30] Paredes D., D.S. Karp et al., 2019. Natural habitat increases natural pest control in olive groves: economic implications. Journal of Pest Science
[31] Aubree F., P. David et al., 2020. How community adaptation affects biodiversity-ecosystem functioning relationships. Ecology Letters 23(8): 1263-1275.
[32] Labeyrie V., Antona M. et al., 2021. Networking agrobiodiversity management to foster biodiversity-based agriculture. A review. Agronomy for Sustainable Development, 41, 4.
[33] Steffen W., K. Richardson et al. 2015. Planetary boundaries: Guiding human development on a changing planet. Science 347 (6223): 736-748.
[34] See, for example, Regards R68, R79, RO6, and other SFE2 Regards on agriculture.
The Encyclopedia of the Environment by the Association des Encyclopédies de l'Environnement et de l'Énergie (www.a3e.fr), contractually linked to the University of Grenoble Alpes and Grenoble INP, and sponsored by the French Academy of Sciences.
To cite this article: TEYSSEDRE Anne (January 5, 2025), Impacts of agriculture on biodiversity and ecosystem functioning, Encyclopedia of the Environment, Accessed May 27, 2026 [online ISSN 2555-0950] url : https://www.encyclopedie-environnement.org/en/life/impacts-agriculture-biodiversity-ecosystem/.
The articles in the Encyclopedia of the Environment are made available under the terms of the Creative Commons BY-NC-SA license, which authorizes reproduction subject to: citing the source, not making commercial use of them, sharing identical initial conditions, reproducing at each reuse or distribution the mention of this Creative Commons BY-NC-SA license.