From the discovery of the greenhouse effect to the IPCC
PDF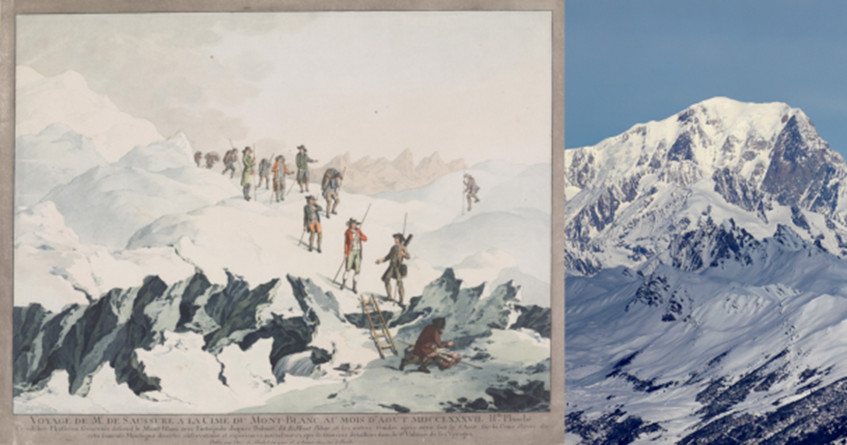
When and how the principle of greenhouse effect appeared? When and how a Swedish scientist found that the mean temperature of the Earth was sensitive to a doubling of atmospheric CO2 concentrations? How the slow awareness of the impact of human activities developed with time? What is the purpose of IPCC [1]? These are questions, among others, at the origin of the present contribution.
- 1. Climate has always impacted human societies
- 2. Discovery of the greenhouse effect
- 3. The famous Mauna Loa curve of Charles David Keeling
- 4. Wallace Broecker’s prediction (1975) and the term “global warming“
- 5. From Charney Report (1979) to the origin of IPCC (1988)
- 6. IPCC (Intergovernmental Panel on Climate Change)
- 7. Some key IPCC conclusions
- 8. Some personal thoughts
1. Climate has always impacted human societies

Closer to us the Little Ice Age, extending from about the 14th to the 19th centuries, may have affected other societies such as the Viking settlement in Greenland established by Erik the Red around the year 1000 (Figure 1), or the Khmer civilization in Cambodia and its majestic Angkor temples. Both populations declined and left these places, probably in response to environmental changes related to colder conditions in Greenland and drier conditions in South-East Asia, at periods roughly corresponding to the Little Ice Age (See Climate Change and Ancient Civilizations).
Those variations in the past illustrate the connection between the history of human settlements and the evolution of climatic conditions over the last few millennia, without the possibility to question a decisive action of human activities on the climate. But it can provide information on the capacity of mankind to adapt to environmental changes.
By contrast, the story, starting in the 19th century that follows, cannot be told without taking into account the impact of human societies on the climate. It has been characterized by a number of scientific and technological discoveries, and a slow awareness of the scientific world, decision-makers (politicians but not only) and civil society. This story and this awareness of the impact of human activities on the environment have led today to one of the major challenges facing our societies in the 21st century.
I will unfold this story from historical milestones that are as follows:
- early 19th century: Joseph Fourier discovers the greenhouse effect;
- end of the 19th century: first calculation by Svante Arrhenius on the relationship between the carbon dioxide (CO2) in the atmosphere and the temperature of the earth’s surface;
- 1958: Charles Keeling signs the birth certificate for the monitoring of carbon dioxide (CO2) in the atmosphere at the Mauna Loa station [2], which will provide a lasting proof of the influence of human activities on the composition of the atmosphere;
- 1979: The Charney Report in the United States, the first official document by scientists addressed to the political world;
- 1988: birth certificate of the IPCC.
2. Discovery of the greenhouse effect
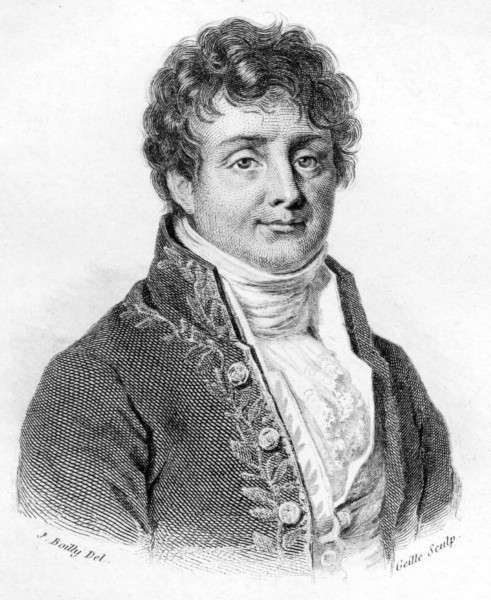
He explained that energy, in the form of visible light from the sun, can easily penetrate the atmosphere and heat the Earth’s surface, which in turn absorbs some of the sun’s radiation. Doing so the Earth’s surface gains energy that it loses by emitting some “dark radiant heat” (“chaleur rayonnante obscure” in the original French text of Joseph Fourier), now called infrared radiation by scientists. The atmosphere, in return, absorbs this dark heat and reflects some of it to the surface, reducing thus energy loss to space.
As a result of Joseph Fourier’s work, much was written about the absorption of dark radiant heat by gases in the atmosphere and its potential influence on climate. Physicists soon became interested in the average temperature at the earth’s surface: is it affected by the presence of heat-absorbing gases in the atmosphere [5]? It became clear that without such gases in the atmosphere, the surface temperature of our planet would be much colder, probably making life impossible.
Shortly after Fourier discovered the greenhouse effect, John Tyndall (1820-1893), an Irish autodidact, investigated whether the air could absorb the famous dark radiant heat emitted from the Earth’s surface.
But Svante Arrhenius was the first, in 1896, to calculate the impact of a variation in the CO2 content of the atmosphere on ground temperature.
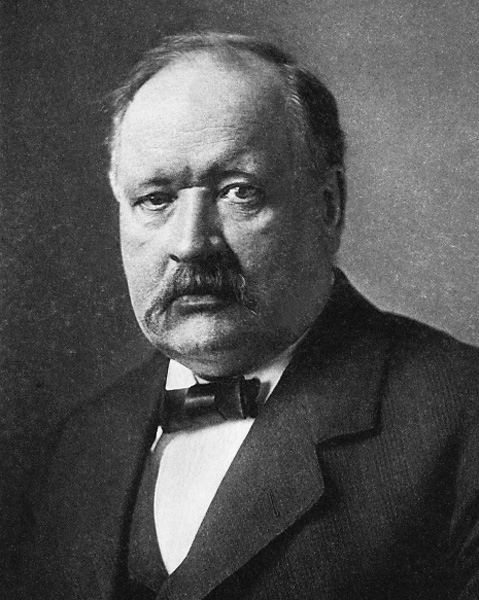
One of the great debates in the scientific world of the 19th century is to understand why, in the distant past, the Earth’s surface experienced Ice Ages – now known as glaciations. Different theories are being proposed – astronomical, physical or geographical. Arrhenius is fascinated by this question and he has the intuition that CO2 in the atmosphere can be a key factor in the existence of glacial cycles. First, he will collect all the existing and necessary data known at the time to estimate the effect of the CO2 content of the atmosphere on the Earth’s temperature. In 1896, after some particularly “tedious calculations” – by his own admission [6] – he proposed the first estimate of the impact of the CO2 level in the atmosphere on the planet’s temperatures. His calculations suggest that, if the amount of CO2 in the atmosphere were reduced by about half, this could lead to a drop in average temperatures in Europe of about 4 to 5°C, which corresponds to the conditions of an Ice Age [7].
This theory of CO2 playing a major role in regulating the Earth’s temperature was an alternative to the astronomical hypothesis backed by James Croll (1821-1890). This hypothesis develops the idea that climate change on a geological scale is due to the precession of the equinoxes and the variations in the Earth’s orbit [8].
The astronomical theory of climate has long been refuted. Then it became more precise and observations made on marine recordings promoted it until today as a pacemaker of the glacial cycles, i.e. establishing their chronology, but not their amplitude (See Les théories astronomiques du climat: une longue histoire, by Berger et Yin to be published in this encyclopedia).

Today, the glacial cycles can be seen lying between the initial suggestions of Arrhenius and Croll, as the combined effects of astronomical and greenhouse gas variations, all amplified by a series of natural feedbacks.
Arrhenius also calculated, in the case of doubling atmospheric CO2, that the future global warming would be about 5 to 6°C, a prediction close to the maximum value of the current estimate range (between 1.5 and 4.5°C). However, contrary to current awareness of global warming, which predicts major risks for humanity in the future, he will estimate in an astonishing book intended to share with the public his vision of the evolution of the universe, that a warming of the Earth (linked to an increase in the level of CO2 in the atmosphere) would be an opportunity for humanity. He noted in particular that cold regions of the world could take advantage of improved climatic conditions and higher agricultural yields for the benefit of a fast-growing population [10].
3. The famous Mauna Loa curve of Charles David Keeling
In the 1950s, partial and local measurements of CO2 concentrations in the atmosphere have been available for decades. However, nothing allowed observing an increase in the CO2 level since the beginning of the industrial era, when it was known that CO2 emissions into the atmosphere (even as early as the time of Arrhenius) were steadily increasing due to the combustion of fossil fuels. And yet this was crucial information for understanding the possible effect on the climate of increasing CO2 production by industry.
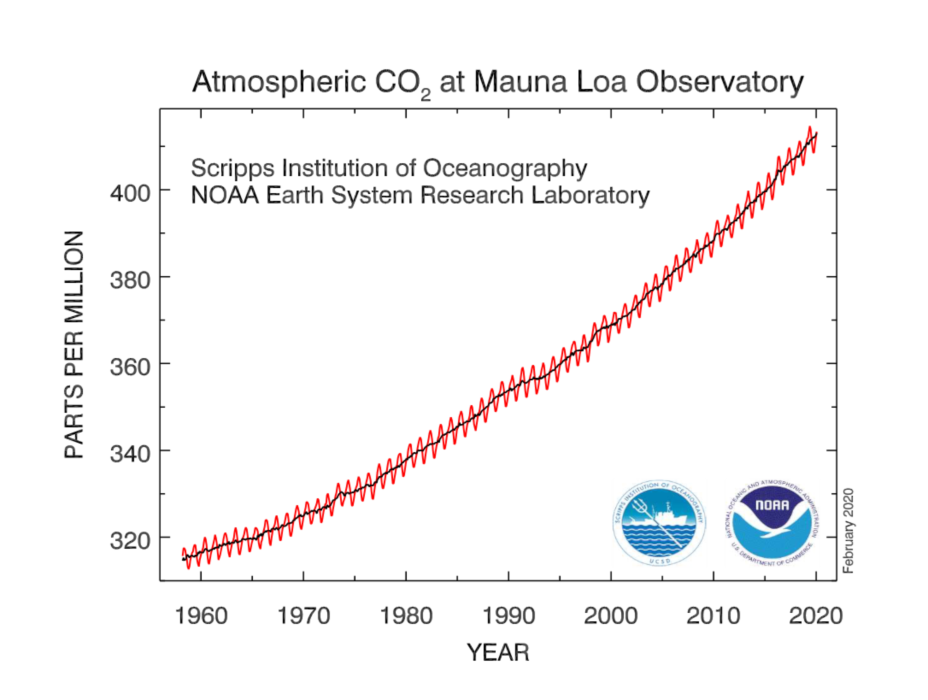
During his postdoc [11], Charles David Keeling, a young American geochemist (1928-2005), developed the first accurate technique for measuring CO2 concentrations in the atmosphere. In 1958, he initiated a series of samples at the observatory located at the summit of Mauna Loa, Hawaii. In the middle of the Pacific Ocean, at an altitude of 3,400 m, the site is far from anthropogenic sources of pollution and chosen for the purity of its air. From the first years of recording, the Keeling curve appeared perfectly jagged and increasing: jagged because the vegetation in the northern hemisphere, where Mauna Loa is located, absorbs CO2 from the atmosphere during its growth in spring and summer, then releases it during autumn and winter.
Thus was born the famous Mauna Loa curve, which was initiated by Keeling and continues inexorably today (Figure 5). It is widely cited by committees of scientific journals and science journalists. It has become a kind of icon of the anthropogenic greenhouse effect.
4. Wallace Broecker’s prediction (1975) and the term “global warming“
In the 1970s scientists really start to be concerned about the potential impact of human activities on climate.
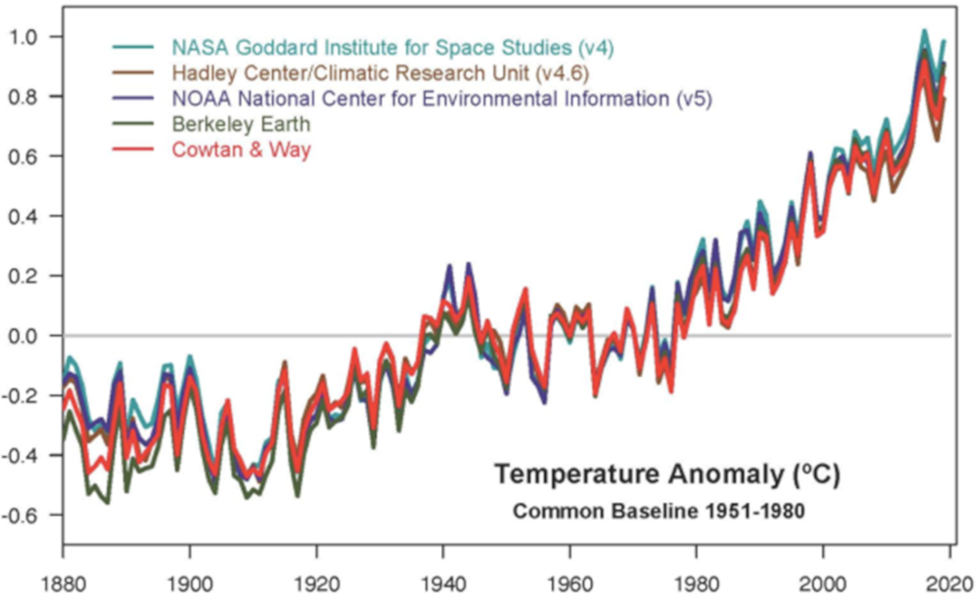
Between 1940 and 1975, the average surface temperature of the Earth, also known as global temperature, first decreased until about 1950 and then stabilized (Figure 6).
Wallace Broecker (Wally to his friends), who died in 2019 and who was one of the great geochemists of the second half of the 20th century, published in 1975 in Science, a leading scientific journal, an article entitled “Climatic Change: Are we on the brink of a pronounced global warming?” [12] In this article, which popularized the expression “Global Warming”, he explains [13] how natural cooling could have masked, as early as 1940, the warming effect of the CO2 emitted by burning fossil fuels. He also predicts that 1975 is the dawn of a long period of rapid warming, which could lead, towards the beginning of the 21st century (i.e. now!), to a global temperature never reached during the last 1,000 years, compared to the ice core record at Camp Century (Greenland).
5. From Charney Report (1979) to the origin of IPCC (1988)
A decisive step was the Charney Report [14], prepared for the National Academy of Sciences at the request of the American government and submitted to President Carter in 1979.
This report examines the results of climate models at the time simulating the climate response to an increase in atmospheric CO2. These models already predicted that a doubling of CO2 in the atmosphere would result in significant global warming between 1.5 and 4.5°C. This estimate, made 40 years ago, has hardly changed today!
An important part of the scientific community working on climate is then convinced of the importance of the issue and the need to deepen knowledge in the field of the climate response to an increase in the greenhouse gas concentrations of the atmosphere. In 1980, the World Climate Research Programme (WCRP) was set up [15]. The alert to decision-makers and civil society materialized in 1988 with the creation of the IPCC [1], whose the first chairman was Bert Bolin, one of the authors of the Charney Report.
The creation of the IPCC was decided jointly by two organizations under the United Nations (UN): the United Nations Environment Programme (UNEP) and the World Meteorological Organization (WMO).
6. IPCC (Intergovernmental Panel on Climate Change)
 The reader will find a detailed description of the IPCC’s thirty-year history in number 100 of the journal La Météorologie published in 2018 [16] : the reasons behind its creation, its missions, its operation, its challenges and its successive reports.
IPCC’s mission is to periodically review the state of knowledge in three areas:
- evaluation of the scientific aspects of how the climate machine works and of climate changes ;
- vulnerability of social, economic and natural systems to climate change and the possibilities for adaptation ;
- solutions to limit greenhouse gas emissions and mitigate the negative effects of climate change.
IPCC assessments are mostly based on internationally available peer-reviewed scientific, technical and socio-economic literature. IPCC experts work to identify the elements that are the subject of a consensus in the scientific community.
IPCC, which is responsible for feeding the political thinking facing a major civilization challenge, brings together 195 countries, i.e. almost all of the states of the world. It represents a unique institutional experience [17], which is a model today in the field of biodiversity and will no doubt be a model in other fields in the future.
Hundreds of eminent experts, specialists in the fields covered by the IPCC reports, spend time as authors to prepare assessments. Hundreds of other experts make ad hoc contributions as contributing authors and provide comments as reviewers.
The IPCC has neither mandate to carry out original research, nor to make recommendations to decision-makers. Its reports (Figure 7) are intended to be “policy-relevant” (decision help), but in no way “policy-prescriptive”. There is therefore an essential synergy between the scientific diagnosis synthesized by the IPCC reports and the political decisions taken within the Climate Convention [18] during its annual meetings: the Conferences of the Parties.
Finally, as regarding the IPCC budget – a question that the public may ask – it is supplied on the basis of voluntary contributions from the Member States and is around EUR 6 million. We can, therefore, speak of a cost at the best value for money for a humanitarian cause on a global scale!
7. Some key IPCC conclusions
7.1. To the question: Are human activities responsible for global warming?
Since the first IPCC report in 1990, the answer has evolved with advances in the knowledge of observations and models:
- In 1990, experts admitted their difficulty in deciding between the share of observed climate change due to human activities and that resulting from natural climate variability.
- In 1995, the second IPCC report cautiously stated: “The balance of evidence suggests a discernible human influence on global climate“.
- Then, in 2007, the IPCC concluded that very likely, i.e. with more than 9 chances out of 10, most of the warming observed since the middle of the 20th century is linked to human activities. The diagnosis has clearly strengthened.
- In the last report of 2014, this diagnosis is even better established.
7.2. About impacts
The consequences of climate change, both present and future, vary according to region, type of activity, economic sector, etc. Simulations indicate that in the event of average global warming of more than 4°C compared to pre-industrial levels (today this warming is of the order of 1°C) – which is likely to occur towards the end of this century if no action is taken to fight against global warming – the probable consequences will be as follows (this list is not exhaustive):
- The Arctic summer ice pack and coral reefs threatened with extinction ;
- Extreme weather phenomena (heat waves, tornadoes, floods, etc.) are likely to become more frequent and intense, with a higher risk for the most disadvantaged countries and populations;
- The biodiversity will be increasingly at risk;
- Phenomena may occur or even manifest themselves in the form of sudden and sometime irreversible changes, such as the acidification of the ocean, the reduction of permafrost (permanently frozen soils in polar regions or in the mountains at high altitude), the rise in sea levels with, on a millennium scale, the risk of the entire melting of Greenland (i.e. a 7 m rise in sea levels).
7.3. Limiting the adverse effects of warming (mitigation and adaptation)
For mitigation, the emphasis is obviously on the target of staying below a 2°C warming compared to pre-industrial levels (the major objective of the Paris agreement at COP 21). This possibility requires significant reductions in global greenhouse gas emissions by 2050.
8. Some personal thoughts
In the 80s, I gave public lectures on climate change and global warming. The people were generally interested but for a large part of the audience the fact that human activities could affect the climate and produce a global warming was something they heard about for the first time. Over time, the audience became more knowledgeable and critical – with the press often highlighting the controversies of the climatosceptics [19] who, while initially denying the reality of global warming, now recognize its reality, but by attributing it to natural climate variability such as the cycles of sunlight activity or the effect of volcanic eruptions.
Criticism focused violently on calling into question IPCC and on marginal errors found into its reports.
Obviously, these criticisms have profoundly influenced public opinion in several countries, including in France at the time when Claude Allègre was at the forefront. That has always questioned me. Indeed, among climatosceptics of all kinds can be scientists – physicists or others. However, very few are experts in climate science. In contrast, IPCC scientists are experts in the scientific and technological fields concerned. They must be independent of any power or lobby and are able to reach a general consensus, a particularly difficult task.
In any case, it appears at the beginning of 2020 that more and more world leaders are recognizing global warming as one of the major challenges facing our societies in the 21st century. Also, a growing mass of public opinion wants the problem to be tackled as a matter of urgency. The IPCC’s message is clear: do everything possible to try to keep global warming below 2°C below pre-industrial levels (1850-1900) by the end of the century. This is still possible; however, drastic measures must be taken now. If nothing is done in the coming decade, then it will be too late.
What more can we say, except that it is a choice that affects the lives of our children?
This contribution to the Encyclopedia of the Environment is essentially based on a text to be published in the Mémoires de l’Académie Nationale de Metz.
References and Notes
Cover image. Left: M. de Saussure’s trip to the Cime du Mont-Blanc in August 1787, Copperplate engraving by Christian von Mechel, collection of Teylers Museum [Source: Christian von Mechel / Public domain] / Right: Mont Blanc by Matthieu Riegler [Source: Matthieu Riegler, CC-by]
[1] Intergovernmental Panel on Climate Change
[2] A Hawaiian term literally meaning “long mountain” and referring to an active red volcano located in the Hawaiian archipelago in the United States.
[3] Jean-Baptiste-Joseph or simply Joseph Fourier.
[4] Fourier (J.-B.-J.), “Mémoire sur les températures du globe terrestre et des espaces planétaire”, Mémoires de l’Académie Royale des Sciences de l’Institut de France, vol. VII-1827, pp. 570-604.
[5] Arrhenius (S.), “On the Influence of Carbonic Acid in the Air Upon the Temperature of the Ground,” The London, Edinburgh and Dublin Philosophical Magazine and Journal of Science, 1896, 41: 237-76. French translation in: Sur les origines de l’effet de serre et du changement climatique, Montreuil, Éd. la ville brûle, 2010, p.197-243.
[6] Arrhenius’ “tedious” calculations are in the order of 10,000 to 100,000 calculations by hand, see Uppenbrick (Julia), “Arrhenius and Global Warming”, Science, No. 272-1996, p. 1122 (references included).
[7] Arrhenius (S.), article quoted.
[8] Croll (James), “On the Physical Cause of the Change of Climate During Geological Epochs”, The London, Edinburgh and Dublin Philosophical Magazine and Journal of Science, 1864, vol. 28. French translation in: Sur la cause physique des changements du climat au cours des époques géologiques, Montreuil, Éd. La ville brûle, 2010, p. 174-194.
[9] Delmas (Robert J.), Ascencio (Jean-Marc), Legrand (Michel), “Polar ice evidence that atmospheric CO2 20,000 yr BP was 50 % of present”, Nature, N° 284-1980, p. 155-157.
[10] Arrhenius (S.), Worlds in the Making, chapter 2, New York, Harper & Brothers, 1908.
[11] Period following the completion of a PhD..
[12] Broecker (W.S.), “Climatic Change: Are we on the brink of a global warming?”, Science, Vol. 189, No. 4201, pp. 460-463
[13] His demonstration is based on the analogy with similar climatic events in the past as recorded in glacial archives in Greenland.
[14] Charney (J.G.) et al., 1979, “Carbon Dioxide and Climate: A Scientific Assessment”, Report of an Ad Hoc Study Group on Carbon Dioxide and Climate, National Academy of Sciences, Washington, D.C., 22 pages.
[15] The World Climate Research Programme (WCRP) is part of the World Meteorological Organization, which is part of the United Nations.
[16] Jouzel (Jean), Petit (Michel), and Masson-Delmotte (Valérie), “Trente ans d’histoire du GIEC”, La Météorologie , N° 100-2018, p. 117-124.
[17] Raynaud (D.) “Au commencement étaient les bulles d’air de l’Antarctique”, Le Monde Diplomatique, November 2015, Climate Report.
[18] Following the first IPCC report (1990) the United Nations Framework Convention on Climate Change (UNFCCC), also known as Climate Convention, was organized. It was signed at the first Earth Summit in Rio de Janeiro in 1992. This Convention annually organizes the now famous COPs: Conferences of the Parties (COP) or Conferences of the 195 signatory States. The best known COP in France is the COP 21, held in Paris in 2015. Its objective is the stabilization of atmospheric concentrations of greenhouse gases at levels that prevents any dangerous human disturbance of the climate system (see Conference of the Parties – Wikipedia).
[19] The term climatosceptic refers to a person who denies or minimizes the anthropogenic origin of global warming, or even the warming itself.
The Encyclopedia of the Environment by the Association des Encyclopédies de l'Environnement et de l'Énergie (www.a3e.fr), contractually linked to the University of Grenoble Alpes and Grenoble INP, and sponsored by the French Academy of Sciences.
To cite this article: RAYNAUD Dominique (January 5, 2025), From the discovery of the greenhouse effect to the IPCC, Encyclopedia of the Environment, Accessed July 22, 2026 [online ISSN 2555-0950] url : https://www.encyclopedie-environnement.org/en/climate/discovery-greenhouse-effect-to-ipcc-2/.
The articles in the Encyclopedia of the Environment are made available under the terms of the Creative Commons BY-NC-SA license, which authorizes reproduction subject to: citing the source, not making commercial use of them, sharing identical initial conditions, reproducing at each reuse or distribution the mention of this Creative Commons BY-NC-SA license.