气候机器

Encyclopédie environnement - machine climatique - climate machine

  这篇概论介绍了一些基本概念,使读者了解气候机器的概况。例如,气候系统是如何工作的,以及为什么它如此复杂。首先,我们将定义“气候”的含义(将其与气象学明确区分),然后提出气候系统基本组成部分的综合愿景。外力胁迫和反馈的概念使我们能够清楚地区分引起气候变化的外部和内部影响机制。之后我们讨论了不同时间尺度下的气候可预测性问题。最后,我们简要介绍了气候学和许多相关学科(物理、地质、化学、生物学等)中使用的工作方法。

1.什么是气候?

  气候通常由一个地区大气的多年平均状况(主要的气候要素包括气温、降水和风力等)来定义,或者更确切地说,是对一个月以上时间段的“时间”的平均数和变异性(波动、趋势、极端事件的频率和强度)的统计描述。一个标准气候计算时间为30年。气象学则是一门与气候学相近的学科,它关注的是较短期限内(不到一个月)的天气预报。这门学科需要考虑的物理量除了温度之外,还有降水、云层、风速和风向等(参见:天气预报介绍)。

环境百科全是-气候-气候变化的独立指标
图1.气候变化的独立指标
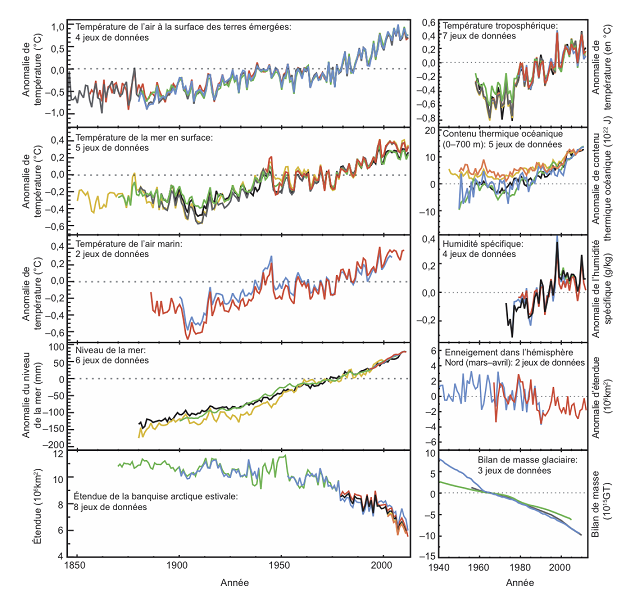
(每个数字代表对气候系统中有关部分变化的独立估计。在每个图中,数据集都限于一个共同的时间段。勘误:冰质量平衡为103 GT(而不是1015)。)
[来源:斯托克(Stocker)等,2013]

  由于气候系统的巨大变异性几十年的持续统计数据是必不可少的。从图中可以看出,全球平均温度的年变化量通常在0.2°C左右(图1,[1]);但在某些特定区域,这种年际变化的幅度可能会超过几度(图2)。有一些典型的空间或时间变异结构(称为“模式”),如澳大利亚-厄尔尼诺与南方涛动(ENSO)或太平洋十年涛动。这里的“涛动”一词表示这些是重复的现象(但实际上没有明确定义的频率);顾名思义,这些变化模式通常集中在地球上某个特定的区域。

  在全球范围内,气候在所有的时间尺度上都在发生变化,并且将持续变化。全球平均地表温度和全球冰川含冰量(通过其对海平面的影响:大陆上以冰帽的形式存在的冰越多,例如目前格陵兰岛或南极洲的冰帽,全球海平面就越低)是描述气候及其变化的首选指标。

环境百科全是-气候-日内瓦(瑞士)6月平均日最高气温
图2. 从1901年开始,日内瓦(瑞士)6月平均日最高气温。左边是时间序列;右边柱状图显示测量平均值的变化。从这两张图中可以看出,2003年显然是一个极端事件。
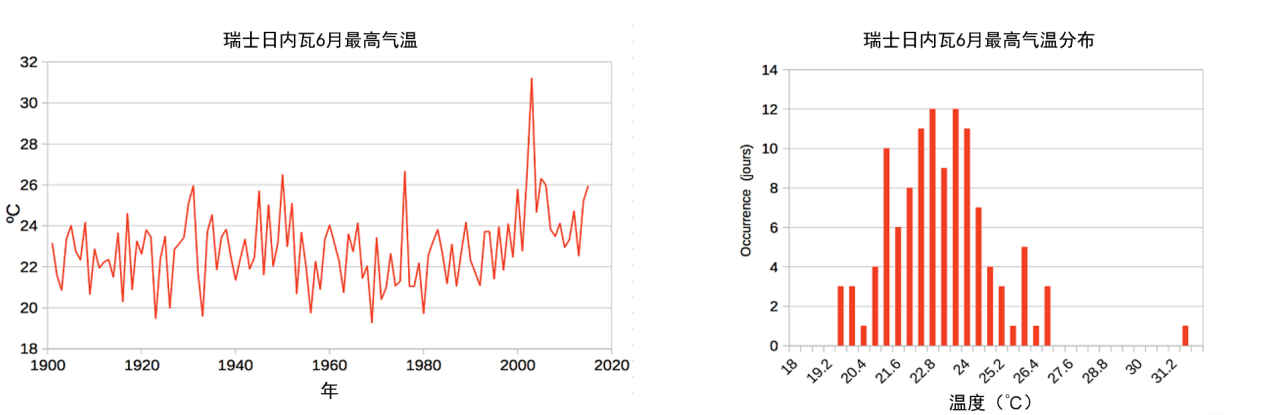
[来源:数据来自欧洲气候评估数据集项目(http://eca.knmi.nl)]

  在更局部的范围内,所有受气候影响的环境特征(山地冰川、植被、湖泊等)都可以用作气候指标(图1)。这些自然元素过去状态的痕迹被我们用来“重建”没有天气记录的历史时期的气候。

2.为什么是“气候机器”

  太阳是气候系统必需的能量来源。大约一半的太阳辐射被地球表面吸收,另一半被反射回太空(约30%)或直接被大气吸收(剩余的 20%)。吸收的太阳辐射加热了地球表面。然而,任何物体都会发出所谓的“热”辐射,这取决于它的温度:温度越高,热辐射越高。在典型气候系统的温度下,这种热辐射是不可见的红外线。地球表面和大气层发出的热辐射构成了一个向外的能量流。从长期来看,地球吸收的太阳能量流与地球以热辐射形式发射的能量流接近。输入和输出能量流之间的差导致了气候系统能量的变化——换句话说,就是全球变暖或变冷。

  气候系统的核心大气层和海洋通过风和洋流,将多余的太阳能从低纬度地区分配到南极和北极。正因如此我们可以把它称为一台“机器”:这台机器将温差转化为运动,又将运动的动能转化为热量。

  尽管气候系统实际上是一个非常平坦的系统,大气和海洋的运动是水平和垂直的:尽管80%的大气质量都集中在地表以上10公里处,但大气覆盖了整个地球表面,因此在水平方向以数万公里为单位进行测量。这同样适用于平均深度为3800米的海洋。然而,海洋和大气环流的重要元素包括垂直运动,主要是由水或气团之间的密度差异引起的。在大气中,这些密度差异主要是由温度(和水蒸气含量)的差异引起的;在海洋中,温度和盐度是导致向上和向下运动的密度差异的主要决定因素。

  比如说哈德莱(低纬度)环流(参见:“大气环流:它的组织”)主要源于赤道近地面空气的受热上升。这些气团在上升时会(通过减压))冷却下来,从而在这些地区形成暴雨。当这些气团到达大约10公里的高度时,它们就会从赤道向南北两方移动。由于动能矩和科里奥利力的守恒,地球的自转使这种水平运动向东偏移。在广阔的亚热带沙漠地区,这些气团下降并升温,从而近一步降低了空气的相对湿度,因此,低云覆盖是这些沙漠形成的源头。在近地面形成了与高空相反的水平运动,这些流向赤道的近地面风被地转偏向力转向西偏移,被称为信风(参见:“信风的关键作用”)。

  除了这些大型的大气环流模式(比如哈德莱环流模式)之外,许多瞬变模式也是大气和海洋环流的特征。因此,从高压系统到低压系统的更替是中纬度地区众所周知的“时间”要素。这些瞬变模式和稳定循环模式一样,是由低纬度和高纬度之间的太阳辐射差异造成的,并向两极输送能量。有趣的是,海洋和大气从赤道向两极输送的能量大致相同。

3.复杂系统

  气候系统的其它组成部分包括:冰(海冰和大陆冰)组成的“冰冻圈”;生物(包括植物)构成的“生物圈”;以及陆地表面。系统各组成部分通过能量(主要是热量,但也有动能)、水和碳的交换相互作用。显然,这些能量、水分和碳的流动也发生在气候系统的每个组成部分中(参见:“天气预报模型”)。

  碳循环可能会让人感到惊讶,而能量和水分的流动并不会让新的读者感到惊讶:事实上,我们每天都能看到和感受到它们,我们可以很容易的想象出整个水循环过程,水分在海洋上蒸发,在大气中运输,形成云、降雨、河流中的水流,最后返回海洋。碳循环同样必不可少,因为它决定了大气中持续存在的两种主要温室气体的浓度,即CO2(二氧化碳)和CH4(甲烷)。水蒸气和其他温室气体能够吸收地球表面和大气本身发出的热(红外)辐射。然后,部分辐射返回地球表面被再次吸收,加热了地球表面。因此,大气中温室气体浓度的增加导致更有效地吸收这种热辐射,从而导致地球表面变暖。

  因此,除了能量和水循环之外,了解碳循环对理解气候系统的运作方式至关重要。像其他循环一样,它实际上非常复杂:大气中的碳,本质上是以CO2的形式存在,被植被和海洋浮游植物通过光合作用捕获并转化为有机物:比如木材、树叶等。当这些有机物分解时,碳再次以CO2的形式重新排放到大气中。海洋中被浮游植物吸收的一部分碳最终会成为海洋沉积物,然后又“快速”地进入新的碳循环中。在很长一段时间内(超过一百万年),这种通量和火山排放的CO2之间存在着平衡——或不平衡,尽管CO2排放量很低,对气候动力学来说至关重要。

  气候系统非常复杂的原因是:在每个组成部分内部及其界面上都发生了大量的过程。这种复杂性使人们难以理解气候系统,并对气候学家试图预测其演变构成了相当大的挑战。这也是在不同时间尺度上气候变化的来源之一。为了克服这种复杂性,需要了解两个基本概念:胁迫和气候反馈

4.胁迫和气候反馈

  众所周知,天气预报的结果一般超过一周就会变得非常不确定。这表明气候系统在长时间尺度上具有更大的不可预测性。因此,气候学家经常被问到这样一个问题:他们如何理解和预测十年后气候系统在时间尺度上的演变?气候学家给出的答案是:气候是一组统计量,这些统计量在一定范围内是可以预测的。因此,读者也会觉得,除非发生一场大灾难,否则法国大城市7月的下个月肯定会比12月的下个月暖和。原因是7月的平均太阳辐射比12月强。用专业术语来讲,这是一种胁迫;大气层顶部的入射太阳辐射是由气候系统之外的一个因素决定的——地球轨道的结构及其自转轴的位置决定了入射辐射的季节性变化,并迫使大气层在夏季和冬季之间进入一种非常不同的平均状态。

  因此,在气候的时间尺度上(超过几个月),就可以预测界定气候的统计量是如何对其控制因素(例如辐射通量)的变化作出反应。因此,如第3段所述,温室气体CO2浓度的增加(由于大量消耗化石燃料)改变了辐射通量。用专业术语来讲,这是一种胁迫,气候系统对此作出了反应。其他作用力也决定了过去不同时间尺度上的气候演变:例如,缓慢的大陆漂移导致海洋和大气流发生了变化;强烈的火山活动期会导致大气对太阳辐射的反射更强,从而导致气候变冷,但长期来看会导致大气中CO2浓度的增加,从而导致气候变暖。

环境百科全是-气候-当前气候变化的主要驱动力
图3. 当前气候变化的主要驱动力。入射太阳辐射(SWR)和向外热辐射(OLR)之间的辐射平衡受到自然(例如太阳辐射的变化)和人为(例如气溶胶和温室气体)胁迫的影响。
[来源:Cubasch等人,2013年]

  在地球的气候历史上,气候系统对各种作用力的反应例子数不胜数;人类对大气组成和地球表面状态的改变只是气候系统以一种可预测的先验方式作出反应的强迫的最新案例(图3, [2])。

  然而,构成气候系统的大量过程和成分,导致气候系统对胁迫响应的放大和衰减现象。一个众所周知的放大效应与雪有关。随着气候变暖,积雪会逐渐减少。之前被雪覆盖的白色表面颜色会变暗。深色的积雪表面反射太阳辐射的效果较差,反而吸收太阳辐射的能力更强,地表变暖,从而导致雪覆盖面积减少。因此,这是气候系统内部对气候变化的放大效应,称之为正反馈。反之,被称为负反馈。这里需要注意的是,正反馈通常不会导致气候系统“失控”。

环境百科全是-气候-气候反馈及它们的时间尺度
图4. 气候反馈及其时间尺度。气候反馈包括正反馈(如雪和冰反照率),负反馈(-)或暂不确定的反馈(+/-),如云的影响。左下方插图显示了这些气候反馈时间尺度的差异。
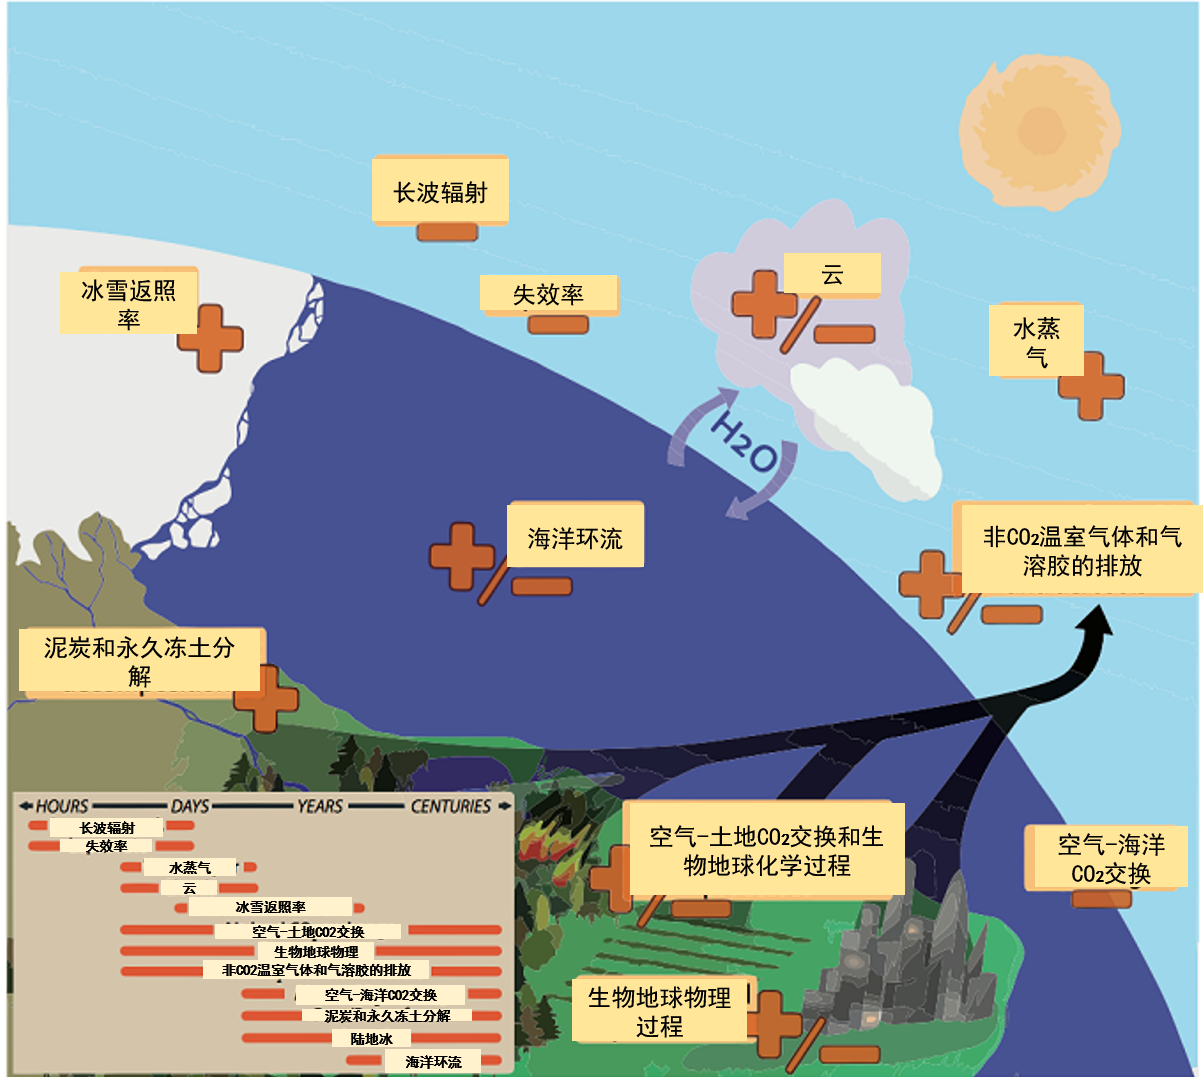
[来源:Cubasch et al.,2013]

  地球气候系统让生命延续了数十亿年,这一事实证明反馈机制将气候系统反应放大了1倍,而不是10倍。然而,应该注意的是,当前气候变化反馈的综合效应是正反馈主要与云层、水蒸汽、大气的垂直结构和冰雪的变化幅度有关(图4,[2])。尤其是水蒸汽的反馈非常强烈,因为其浓度对大气温度变化的调整非常快(约10天)。

5.突变和不可逆变化

  有时候气候系统的组成部分或气候本身对缓慢变化的外部胁迫响应会突然加速,这种现象我们称之为突变。这种突然变化通常(但不总是)与正反馈有关。突变也可以用一种非常简单的方式表示为超过物理或生物阈值。例如,当温度达到0摄氏度时,冰就会融化,或者当超过耐受阈值(如干旱)时,生态系统就会消失。相关子系统的快速演变反过来也会导致快速的气候变化。

  气候变化的不可逆性问题与突变问题有关。如果在取消最初的强迫因素后,系统在与取消强迫因素相同数量级的持续时间内未恢复到其初始状态,那么这种变化就被定义为不可逆。例如,目前估计格陵兰冰盖长期暴露在比19世纪初(“工业化前”)气候温暖2°C的气候下(距今已有几百年时间),极有可能导致该冰盖在几千年内几乎完全融化。一旦冰盖的融化过程顺利进行,全球气候将恢复到19世纪初的原始状态,冰盖也不会再恢复到原来的形状:这是因为,在部分冰盖融化后,冰盖表面将处于较低的海拔高度,并因此暴露在更温暖的气候下(格陵兰冰盖下的广阔大陆架目前处于超过3000米的海拔高度)。

  识别气候系统中可能发生突然和/或不可逆转地反应的要素,量化所涉及的变化阈值,是当前气候研究的一个热点。

6.气候学,一门多学科交叉的科学

  在本文的开头,描述了气象学和气候学之间的区别就在于时间尺度,气象学研究的时间尺度短(一般为一周左右),而气候学研究的时间尺度长(超过一个月,甚至几十年)。我们还可以用更多数学术语将气象学视为研究一个初始条件下的问题(“考虑到今天的大气状况,三天之后会是什么状态?”),而气候学是研究在边界条件下的问题(“如果我改变大气中二氧化碳的浓度,50年后的平均天气会是怎样的?”)。在最后一个问题中,我们可以清楚地看到气候系统胁迫的概念又出现了。也就是说,气候学在某种意义上与气象学是一脉相承,它们共享许多工具和方法(参见:“天气预报概论”)。

  气候学是一门多学科科学,因此它必须比气象学考虑更多的物理和生物现象:气候系统的组成部分——生物圈、大气、海洋、冰、陆地表面——是通过生物学、化学、物理学、地质学、水文学和其他科学来理解的。气候工具,包括气候模型,广泛使用了应用数学(参见:“生物圈、水圈和冰冻圈模型”)。

  显而易见,气候学迫切需要长期观测和良好的空间覆盖。公众并不十分清楚收集气候数据、并对其进行处理(均质化等)和分析的工作量是巨大的。长期时间系列的温度、降水量和冰川观测数据,几乎是所有气候科学的起点。一方面,与其他学科不同的是,气候学开展的实验很少,这是因为我们只有一个气候系统,一个地球,我们无法对它进行控制实验。这就是说,实际上人类正在进行一项巨大的实验,人为地增加大气中主要的长寿命温室气体的浓度!然而,气候系统的一些细节是可以用实验量化:例如,通过FACE实验(Free-Air CO2 Enrichment,在自由空气中增加CO2浓度),可以分析树木对大气二氧化碳浓度局部和持续增加的响应。

  由于气候系统本身无法进行实验,因此详细预测其演变的唯一方法是根据我们目前的知识进行建模。鉴于系统的复杂性,不可能以分析的方式进行详细的数学建模。由于针对气候系统建模过程中涉及的过程数量巨大,因此有必要转向数值模拟,以尽可能详细的方式表示所涉及的物理、化学和生物过程,将方程式转换为计算机代码,以便使用功能强大的计算机计算系统的演化过程。通常用于世纪尺度气候预测的最全面的工具是耦合地球系统模式。它们代表了气候系统基本子系统各自的功能和系统间的耦合功能。为了做到这一点,以大气为例,用水平方向约100公里,垂直方向50层的网格大小来表示大气层。然后,从一个给定的初始状态开始,用几分钟的时间步长计算几十年来大气状态的演变。计算机从而能够一步一步地模拟世界上所有地区的天气(分辨率约为100公里)。所以实际上,天气就是“阴和晴(雨和太阳)”,而天气背后所代表的是地球流体动力学,它控制着气团的运动、辐射传输、小尺度湍流过程、云的形成、降水等。计算机以同样的方式计算在同一时间内海洋和气候系统其他组成部分的演变以及它们之间水、能量和碳等的交换。由于气候系统的复杂性,这些地球系统的耦合模型是世界上计算能力的最大消耗者之一。

  表征历史气候指标(海洋沉积物、冰芯等)的收集和解释是气候学的一个特殊分支,即古气候学。对历史气候变化的了解为当前气候变化提供了极其宝贵的视角。它还允许我们在与当前不同的背景下测试我们对气候系统和气候模型的理解,从而评估我们理解和模型的鲁棒性和有效性。


参考资料和注释

[1] Store, T.F., D. Qin, G.-K. Plattner, L.V. Alexander, et al., 2013. Technical summary. In: Climate Change 2013: The Science. Contribution of Working Group I to the Fifth Assessment Report of the Intergovernmental Panel on Climate Change[Stocker, T.F., D. Qin, G.-K. Plattner, M. Tignor, S.K. Allen, J. Boschung, A. Nauels, Y. Xia, V. Bex and P.M. Midgley (eds.)]. Cambridge University Press, Cambridge, United Kingdom and New York (NY), United States of America. https://www.ipcc.ch/pdf/assessment-report/ar5/wg1/WG1AR5_SPM_brochure_fr.pdf

[2] Cubasch, U., D. Wuebbles, D. Chen, M.C. Facchini, D. Frame, N. Mahowald and J.-G. Winther, 2013. Introduction. In: Climate Change 2013: The Physical Science Basis. Contribution of Working Group I to the Fifth Assessment Report of the Intergovernmental Panel on Climate Change[Stocker, T.F., D. Qin, G.-K. Plattner, M. Tignor, S.K. Allen, J. Boschung, A. Nauels, Y. Xia, V. Bex and P.M. Midgley (eds.)]. Cambridge University Press, Cambridge, United Kingdom and New York, NY, USA, pp. 119-158, doi:10.1017/CBO9781107415324.007. https://www.ipcc.ch/pdf/assessment-report/ar5/wg1/WG1AR5_Chapter01_FINAL.pdf


环境百科全书由环境和能源百科全书协会出版 (www.a3e.fr),该协会与格勒诺布尔阿尔卑斯大学和格勒诺布尔INP有合同关系,并由法国科学院赞助。

引用这篇文章: KRINNER Gerhard (2024年3月13日), 气候机器, 环境百科全书,咨询于 2024年7月27日 [在线ISSN 2555-0950]网址: https://www.encyclopedie-environnement.org/zh/climat-zh/the-climate-machine/.

环境百科全书中的文章是根据知识共享BY-NC-SA许可条款提供的,该许可授权复制的条件是:引用来源,不作商业使用,共享相同的初始条件,并且在每次重复使用或分发时复制知识共享BY-NC-SA许可声明。

The climate machine

Encyclopédie environnement - machine climatique - climate machine

This general introduction presents some basic concepts that will allow the reader to gain an overview of the climate machine, i.e. how the climate system works and why it is so complex. First, we will define what the word “climate” means (clearly distinguishing it from meteorology) and then we will present a synthetic vision of the essential components of the climate system. The concepts of forcing and feedback make it possible to clearly distinguish external and internal effects and mechanisms that cause climate change. The issue of climate predictability at different time scales is then discussed. Finally, there is a brief introduction to the working methods used in climatology and the many related disciplines (physics, geology, chemistry, biology,…).

1. What is climate?

Climate is often defined by average weather conditions (temperature, rain, wind, etc.), or rather as a statistical description of “time” in terms of means and variability (fluctuations, trends, frequencies and intensity of extremes), for time periods beyond the month. Typically these statistics are calculated over a period of 30 years. Meteorology, a scientific discipline close to climatology, concerns the forecasting of weather with shorter deadlines, below the month. The physical quantities taken into account are of course temperature, but also precipitation, cloud cover, wind speed and direction, etc. (read Introduction to weather forecasting).

Encyclopedia environment - climate machine - independent indicators climate in evolution
Figure 1. Many independent indicators of a changing climate. Each figure represents an independent estimate of change for the part of the climate system in question. In each of the figures, the data sets were limited to a common time period. Errata: Ice mass balance in 103 GT (instead of 1015). [Source: Stocker et al, 2013]
The need to consider durations of several decades comes from the large variability of the climate system. Thus, the global average temperature can typically vary by 0.2°C from one year to the next (Figure 1, [1] ); at a given location, the amplitude of this interannual variability can exceed several degrees (Figure 2). There are typical structures (called “modes”) of spatial or temporal variability such as the Austral-El Niño Oscillation (ENSO) or the Decadal Pacific Oscillation. The term “oscillation” here indicates that these are repetitive phenomena (but in reality without a well-defined frequency); often these modes of variability are centred on a particular place on the globe, as their name suggests.

Globally, the Earth’s climate has varied, varies and will vary at all scales of time, from the hundred million years to the decade. The global average surface temperature and the global volume of ice (through its effect on sea level: the more ice is placed on the continents in the form of ice caps such as those of Greenland or Antarctica at present, the lower the global sea level) are naturally the preferred indicators for characterizing climate and its variability.

Encyclopedie environnement - machine climatique - Moyenne mois de juin température Geneve - maximum daytime temperature geneva
Figure 2. June average of the maximum daytime temperature in Geneva (Switzerland), from 1901. On the left, time series; on the right, histogram indicating the occurrence of measured averages. The year 2003 is clearly visible as an extreme event in both figures. [Source: Data from European Climate Assessment, Dataset project (http://eca.knmi.nl). G. Delaygue]
At a more local scale, all climate-influenced environmental characteristics (mountain glaciers, vegetation, lakes, etc.) can be used as climate indicators (Figure 1). Traces of the past state of these natural elements are used to “reconstruct” climates from past periods for which we do not have weather records.

2. Why “climate machine”?

The sun is the source of energy essential for the climate system. About half of the sun’s radiation is absorbed by the Earth’s surface, the other half being either reflected back into space (about 30%) or absorbed directly into the atmosphere (the remaining 20%). The absorbed radiation heats the Earth’s surface. However, any body emits so-called “thermal” radiation, depending on its temperature: the hotter it is, the higher its thermal radiation is. At the temperatures typical of the climate system, this thermal radiation is infra-red, invisible. The Earth’s surface and atmosphere therefore emit a thermal radiation which constitutes an outgoing energy flow. In the long term, the solar energy flux absorbed by the Earth is close to the energy flux emitted by the Earth in the form of thermal radiation. A difference between incoming and outgoing energy flows leads to a variation in the energy content of the climate system – in other words, global warming or cooling.

At the heart of the climate system, the atmosphere and oceans, through their winds and currents, distribute excess solar energy from low latitudes towards the poles, which are in deficit. It is in this sense that we can speak of a “machine”: temperature differences are converted into motion, whose kinetic energy is, of course, dissipated into heat.

Atmospheric and oceanic movements are both horizontal and vertical, although the climate system is actually a very flat system: while 80% of the mass of the atmosphere is concentrated in the first 10 kilometres above the surface, the atmosphere covers the entire surface of the Earth and is therefore measured horizontally in tens of thousands of kilometres. The same applies to the ocean, which is an average depth of 3800 m. However, the significant elements of the general circulation of the ocean and atmosphere include vertical movements, caused mainly by differences in density between water or air masses. In the atmosphere, these density differences are mainly caused by differences in temperature (and water vapour content); in the ocean, temperature and salinity are the main determinants of density differences leading to upward and downward movements.

Thus, for example, Hadley’s circulation of the atmosphere at low latitudes (read The atmospheric circulation: its organization) is characterized by an upward movement of superheated air masses from the equatorial region. These air masses cool down as they rise (by decompression), causing heavy rainfall in these areas. When they reach an altitude of about ten kilometres, these air masses move away from the equator to the north and south. The Earth’s rotation induces an eastward deviation of this horizontal movement due to the conservation of the kinetic moment and the Coriolis force. Plumbing the large subtropical desert areas, these air masses descend and warm up: this warming further reduces the relative humidity of the air, hence the low cloud cover at the origin of the formation of these deserts. At the surface, a horizontal movement opposite to that of altitude is set up and these surface winds towards the equator, diverted westward by the Coriolis force, are called trade winds (read The key role of trade winds).

Beyond these large general circulation systems, of which Hadley circulation is an iconic example, many transient systems characterize atmospheric and oceanic circulation. Thus, the succession of high and low pressure systems is a well-known element of “time” at mid-latitudes. These transient systems are, in the same way as stable circulation systems, ultimately caused by the difference in sunlight between low and high latitudes, and perform transport of energy to the poles. It is interesting to note that the ocean and atmosphere carry about the same amount of energy from the equator to the poles.

3. A complex system

Other components complete this climate system: ice (sea ice and continental ice), often referred to as “cryosphere“; living beings, including vegetation, which constitute the “biosphere“; the continental surface. The components of the system interact with each other via exchanges of energy (mainly heat, but also kinetic energy), water and carbon. Obviously, these energy, water and carbon flows also occur within each component of the climate system (read Weather forecasting models).

The reference to the carbon cycle may come as a surprise here, while the reference to energy and water flows is unlikely to surprise the novice reader: indeed, we see and feel them every day, and we easily visualize the water cycle, from its evaporation over the ocean, its transport in the atmosphere, cloud formation, rain, water flow in a river and its return to the ocean. However, the carbon cycle is essential because it determines the concentration of two main greenhouse gases persistent in the atmosphere, namely CO2 (carbon dioxide) and CH4 (methane). Water vapour and other greenhouse gases have the ability to absorb thermal (infrared) radiation emitted by the Earth’s surface and the atmosphere itself. This radiation is then partially returned to the Earth’s surface, where it is again absorbed: this energy heats the Earth’s surface. The increase in the concentration of greenhouse gases in the atmosphere thus leads to a more efficient absorption of this thermal radiation, and therefore to a warming of the Earth’s surface.

Understanding the carbon cycle, in addition to the energy and water cycles, is therefore essential for understanding how the climate system works. Like the other cycles mentioned, it is actually very complex: carbon in the atmosphere, essentially in the form of CO2, is captured by vegetation and ocean phytoplankton through photosynthesis and transformed into organic matter: wood, leaves, etc. When this organic matter decomposes, this carbon can be re-emitted into the atmosphere, again essentially in the form of CO2. Some of the carbon absorbed by phytoplankton in the ocean will end up as ocean sediments, essentially removed from the “fast” carbon cycle. In the very long term (over a million years), balance – or imbalance! – between this flux and volcanic emissions of CO2, despite their low magnitude, becomes essential for climate dynamics.

We can see here the reason for the great complexity of the climate system: the large number of processes occurring both within each of the individual components and at the interface of these components. This complexity makes understanding the climate system difficult and poses a considerable challenge for climatologists seeking to predict its evolution. It is also one of the sources of climate variability at very different time scales. To tame this complexity, two fundamental concepts are necessary: forcing and climatic feedback.

4. Forcing and feedback

It is well known that weather forecasting becomes very uncertain typically beyond one week. This suggests an even greater unpredictability of the climate system at long time scales. The question is therefore often asked of climatologists: how can they understand and predict the evolution of the climate system on time scales beyond the decade? The answer is this: climate is a set of statistical quantities and these statistical quantities are, within certain limits, predictable. Thus, the reader will agree that the next month of July in metropolitan France will, except for a major cataclysm, certainly be warmer than the next month of December. The reason is obviously the fact that the average solar radiation in July is stronger than in December. In technical terms, this is a forcing: incident solar radiation at the top of the atmosphere is determined by a factor outside the climate system – it is the configuration of the Earth’s orbit and the position of its axis of rotation that determines these seasonal variations in incident radiation and forces the atmosphere into a very different average state between the summer and winter months.

At climatic time scales (beyond a few months), it therefore becomes possible to predict how statistical quantities that define climate react to variations in the factors that determine them (e.g. radiative fluxes). Thus, the increase in the concentration of greenhouse gas CO2 (due to the massive consumption of fossil fuels) modifies radiative fluxes, as described in paragraph 3. this is, in technical terms, a forcing, to which the climate system responds. Other forcings have determined climate evolution at all time scales in the past: for example, slow continental drift imposes changes in oceanic and atmospheric currents; periods of intense volcanism can lead to stronger reflection of solar radiation by the atmosphere and thus to a cooling of the climate, and in the long term can cause an increase in atmospheric CO2 concentration and thus induce warming.

Encyclopedia environment - climate machine - main forces of climate change
Figure 3. The main forcings of current climate change. The radiation balance between incident solar radiation (SWR) and outgoing thermal radiation (OLR) is influenced by natural (e.g. a variation in radiation emitted by the sun) and man-made (e. g. aerosols and greenhouse gases) forcings. [Source: Cubasch et al, 2013]
The climate history of our planet is full of examples of how our climate system responds to various forcings; human modification of the atmospheric composition and surface state of the Earth is only the latest example of a forcing to which the climate system responds in a predictable way a priori (Figure 3, [2]).

However, the multitude of processes and components that together form the climate system results in phenomena of amplification and damping of the climate system’s response to forcings. A well-known example of amplification is related to the presence of snow. As the climate warms, the snow cover recedes. Previously snow-covered and white surfaces become darker. A dark surface reflects solar radiation less well and absorbs it more. This increased absorption of solar radiation warms the surface, which will lead to an increased reduction in snow cover. This is therefore an amplification of climate variation by a process internal to the climate system: it is called a positive reaction. In the case of amortization, this is called negative feedback. It is important to note here that positive feedback does not generally lead to a “runaway” system.

Encyclopedie environnement - machine climatique - Retroactions climatiques et leurs echelles de temps - climate machine - climate feedbacks
Figure 4. Climate feedbacks and their time scales. The various feedbacks can be positive (such as those related to snow and ice albedo), negative (-) or, at present, uncertain (+/-) such as the effect of clouds. The insert shows the significant difference in time scales associated with these different feedbacks. [Source: Cubasch et al., 2013]
The fact that our climate system has allowed life to develop for billions of years proves that they are generally feedback that amplifies the system’s response by a factor much closer to 1 than 10. However, it should be noted that the combined effect of the main climate feedbacks involved in current climate change is positive. These main feedbacks are related to cloud cover, water vapour, the vertical structure of the atmosphere, and the extent of ice and snow (Figure 4, [2]). The feedback from water vapour is very strong because its concentration adjusts very quickly (~10 days) to atmospheric temperature.

5. Abrupt and irreversible changes

Sometimes, the response of a component of the climate system or the climate itself to a slowly changing external forcing accelerates abruptly: we speak of abrupt changes. The existence of such abrupt changes is often, but not always, linked to positive feedback. It can also mean, in a very simple way, exceeding a physical or biological threshold, for example, melting ice from the moment the temperature reaches 0°C, or the disappearance of an ecosystem when a tolerance threshold (e. g. drought) is exceeded. The rapid evolution of the subsystem concerned can in turn lead to rapid climate change.

The issue of the irreversibility of climate change is linked to the issue of abrupt changes. A change is defined as irreversible if, after cancellation of the initial forcing, the system does not return to its initial state within a period of time of the same order of magnitude as the duration of the cancellation of the forcing. For example, it is currently estimated that prolonged exposure (a few hundred years) of the Greenland ice cap to a climate 2°C warmer than the climate of the early 19e century (“pre-industrial”) would most likely lead to the near-total melting of this ice cap in a few thousand years. If, once the melting process of the ice cap is well under way, the global climate returns to its original state at the beginning of the 19th century, the ice cap will no longer return to its former configuration: indeed, following a partial melting, the surface of the ice cap will be at a lower altitude and therefore exposed to a warmer climate (it is recalled that the vast land shelf below the Greenland ice cap is currently at an altitude of over 3000 m).

The identification of elements of the climate system that may react abruptly and/or irreversibly and the quantification of the thresholds of change involved are aspects of current climate research.

6. Climatology, a multidisciplinary science

At the beginning of this article, the difference between meteorology and climatology was described as related to time scales, short (on the order of a week) for meteorology and long (beyond the month, with integration periods of several decades) for climatology. We can also see, in more mathematical terms, meteorology as a problem under initial conditions (“Given the state of the atmosphere today, what will be its state in three days? “), while climatology is a problem at boundary conditions (“What will be the average weather in 50 years if I change the concentration of CO2 in the atmosphere? “»). We can clearly see in this last question the concept of climate system forcings coming back. That being said, climatology is in a sense a daughter of meteorology, and it shares many tools and methods with meteorology (read Introduction to weather forecasting).

Nevertheless, climatology, because it necessarily has to take into account more physical and biological phenomena than meteorology, is a multidisciplinary science: the components of the climate system – biosphere, atmosphere, ocean, ice, continental surfaces – are understood through biology, chemistry, physics, geology, hydrology, and other sciences. Climatological tools, including climate models, make extensive use of applied mathematics (read Biosphere, hydrosphere and cryosphere models).

For obvious reasons, climatology has a crucial need for long-term observations and with good spatial coverage . The work of collecting these data, their processing (homogenization, etc.) and their analysis is colossal, and not very visible to the general public. These are the long series of temperature and precipitation readings, the long series of glacier observations, which are the starting point for almost all climate science. Unlike other sciences, experimentation, on the other hand, is less present, simply because we have only one climate system, one planet, with which we cannot conduct a controlled experiment. That being said, humanity is carrying out a gigantic experiment to artificially increase the concentration of the main long-life greenhouse gases in the atmosphere! However, some details of the climate system may be accessible for experimental quantification: for example, it is possible to experimentally analyze the response of trees to a local and persistent increase in CO2 concentration in the ambient atmosphere, as was done in the FACE experiments (Free-Air Carbon dioxide Enrichment).

Since the climate system as such is inaccessible to experimentation, the only way to predict its evolution in detail is by modelling based on our current understanding. Given the complexity of the system, detailed mathematical modelling is not possible in an analytical way. The number of processes involved is far too large, so it is necessary to switch to numerical modelling. This involves representing the physical, chemical and biological processes involved in as detailed a manner as possible, in the form of equations transformed into computer code in order to calculate the evolution of the system using powerful computers. The most comprehensive tools often used for century scale climate projections are the Coupled Earth System Models. They represent the detailed and coupled functioning of the essential subsystems of the climate system. To do this, the atmosphere is represented, for example, by a mesh size of about 100 km horizontally and about 50 vertical levels. The evolution of the state of the atmosphere is then calculated over several decades with a time step of a few minutes from a given initial state. The computer thus simulates the weather in all parts of the world (with a resolution of about 100 kilometres), step by step. So it is literally “the rain and the sun”. The processes represented are terrestrial fluid dynamics, which governs the movement of air masses, radiative transfer, small-scale turbulence processes, cloud formation, precipitation, etc. The computer calculates in the same way the evolution of the ocean and the other components of the climate system as well as their exchanges of water, energy, carbon, etc., in essentially the same time step. Because of the complexity of the climate system, these coupled models of the Earth system are among the largest consumers of computing power in the world.

The collection and interpretation of past climate indicators (ocean sediments, ice cores, etc.) is a particular branch of climatology, namely palaeoclimatology. Knowledge of past climate change provides an extremely valuable perspective on current climate change. It also allows us to test our understanding of the climate system and our climate models in a different context than the current one, and thus to assess the robustness and validity of our understanding and models.


References and notes

[1] Store, T.F., D. Qin, G.-K. Plattner, L.V. Alexander, et al., 2013. Technical summary. In: Climate Change 2013: The Science. Contribution of Working Group I to the Fifth Assessment Report of the Intergovernmental Panel on Climate Change[Stocker, T.F., D. Qin, G.-K. Plattner, M. Tignor, S.K. Allen, J. Boschung, A. Nauels, Y. Xia, V. Bex and P.M. Midgley (eds.)]. Cambridge University Press, Cambridge, United Kingdom and New York (NY), United States of America. https://www.ipcc.ch/pdf/assessment-report/ar5/wg1/WG1AR5_SPM_brochure_fr.pdf

[2] Cubasch, U., D. Wuebbles, D. Chen, M.C. Facchini, D. Frame, N. Mahowald and J.-G. Winther, 2013. Introduction. In: Climate Change 2013: The Physical Science Basis. Contribution of Working Group I to the Fifth Assessment Report of the Intergovernmental Panel on Climate Change[Stocker, T.F., D. Qin, G.-K. Plattner, M. Tignor, S.K. Allen, J. Boschung, A. Nauels, Y. Xia, V. Bex and P.M. Midgley (eds.)]. Cambridge University Press, Cambridge, United Kingdom and New York, NY, USA, pp. 119-158, doi:10.1017/CBO9781107415324.007. https://www.ipcc.ch/pdf/assessment-report/ar5/wg1/WG1AR5_Chapter01_FINAL.pdf


环境百科全书由环境和能源百科全书协会出版 (www.a3e.fr),该协会与格勒诺布尔阿尔卑斯大学和格勒诺布尔INP有合同关系,并由法国科学院赞助。

引用这篇文章: KRINNER Gerhard (2019年2月8日), The climate machine, 环境百科全书,咨询于 2024年7月27日 [在线ISSN 2555-0950]网址: https://www.encyclopedie-environnement.org/en/climate/the-climate-machine/.

环境百科全书中的文章是根据知识共享BY-NC-SA许可条款提供的,该许可授权复制的条件是:引用来源,不作商业使用,共享相同的初始条件,并且在每次重复使用或分发时复制知识共享BY-NC-SA许可声明。