Glaciers in the high mountains of Asia in the face of climate change
PDF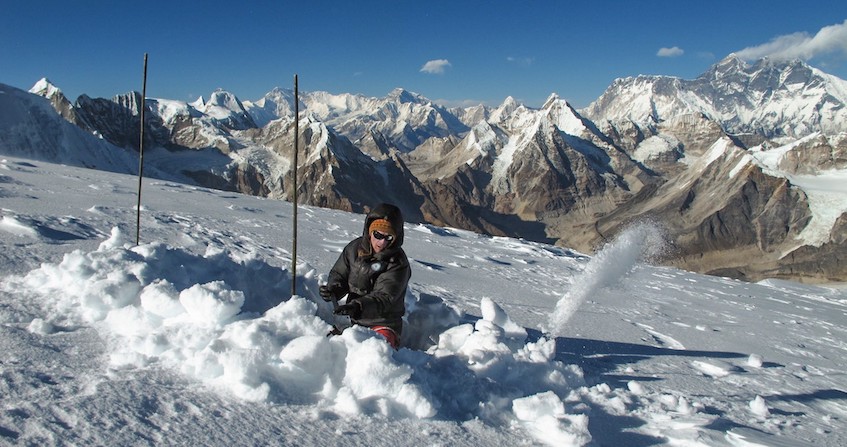
With an average altitude of more than 4000 m, the Tibetan Plateau is the highest and also the largest in the world, with an area almost 5 times that of France. Surrounded by the highest mountains on the planet, this immense natural barrier has a significant influence on the climate. Vulnerable, it is also sensitive to the climate change we are experiencing. What is the current evolution of the region’s climate? Will this evolution accelerate in the future? With what repercussions on the region’s glaciers, now and in the decades to come? What impacts would this have on the populations living downstream? These are some of the questions we try to answer in this article.
- 1. Geography of the High Mountains of Asia
- 2. Past and future climate of the high mountains of Asia
- 3. Glaciers and climate in Asia
- 3.1 Geographical distribution and morphological characteristics of high mountain glaciers in Asia
- 3.2. Contrasting evolution of glaciers according to regions
- 3.3. A different sensitivity of the mass balance to climate depending on the region
- 3.4. What is the future for glaciers in the high mountains of Asia?
- 3.5. Impacts on populations
- 4. Messages to remember
1. Geography of the High Mountains of Asia
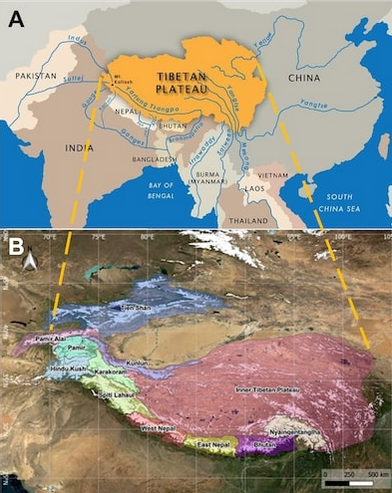
The combination of the Tibetan plateau and the high mountains of Asia is often referred to as the “water towers” of Asia or the “third pole” [1]:
- It is home to the largest ice-covered area outside the polar regions, and the presence of these mountains, some of which exceed 8000 m in altitude, induces heavy precipitation due to the relief.
- It is home to 95,536 glaciers on an area of ~97,605 ± 7,935 km2 (Figure 2) [2].
The melting of glaciers and snow cover supports the flows of major Asian rivers, such as the Brahmaputra, Ganges, Indus, Yangtze, Yellow River, Salween or Mekong, contributing to the water supply of more than 1.4 billion people living downstream [3]. This population is also growing rapidly, associated with a marked development of industrial and agricultural activities.
2. Past and future climate of the high mountains of Asia
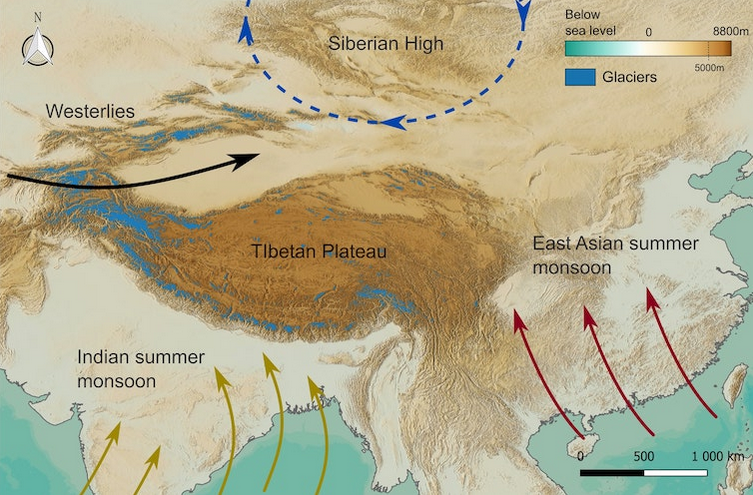
2.1. Mid-latitude atmospheric circulation and monsoons
The location of the Asian highlands at the crossroads of mid-latitude atmospheric circulation, Asian monsoons and the Tibetan continental climate (Figure 3), explains the difficulty in implementing reliable weather forecasting in this region. It also explains the difficulty in quantifying the regional and local consequences of ongoing climate change.
The animation A1 in Figure 3 shows the daily evolution of the water equivalent of the snow cover over the same region and for the period October 2010-September 2011. [Source: © Jean Baptiste Barré]
- This chaotic nature explains the difficulty to produce quality weather forecasts beyond a few days.
- Atmospheric forecasts in these regions are also difficult on seasonal scales because of very high variability, which is less marked in tropical areas on these time scales.
- In order to highlight climate trends in mid-latitudes, it is necessary to consider long periods to show significant signals with regard to the high natural variability
Westerlies transport moisture from the Atlantic Ocean, the Mediterranean and the Caspian Sea. This generates large amounts of precipitation in the north-western high mountain ranges of Asia, especially in the Karakoram and Hindu Kush, regions that are characteristic of a mid-latitude climate. In the southeast, in the central and eastern parts of the Himalayas, three quarters of the annual precipitation is generated in summer by the Asian monsoons [4]. There are two groups of Asian monsoons: the South Asian monsoon (Indian monsoon) and the East Asian monsoon (Figure 3). These monsoons affect the Indian subcontinent as well as Southeast Asia in summer, with an influence evolving from the south to the north of these regions during an extended period from June to September.
Due to its topography, the Asian Highlands region plays a key role in atmospheric circulation on global and regional scales. It impacts the atmospheric waves at the scale of the whole Northern Hemisphere, affecting the position of jet streams, strong upper air currents located at the troposphere [5]-stratosphere interface [6] (see Jet Streams & The Earth’s Atmosphere and Gas Envelope) as well as the position of the rails of lows propagating from west to east (see Figure 3).
Asian monsoons are mainly triggered by temperature contrasts between the oceans and the continents (see Monsoons). The high mountain region of Asia also plays a role in triggering these monsoons, by promoting the transfer of warm and humid air from oceanic regions to monsoon-affected areas, via two types of mechanisms:
- Thermodynamic effects: with the intensification of solar radiation in summer, the Tibetan Plateau absorbs excess energy which causes it to rise in temperature and warms the atmosphere at high altitudes, initiating a pump that draws air from the tropical regions located further south (see the monsoon flows in Figure 3);
- Mechanical effects: the topography of the high mountainous region of Asia and the Tibetan Plateau deflects the westerly currents, which is likely to favour the formation of cyclones and anticyclones, in connection with the generation of Rossby waves [7]. These circulations are then themselves likely to trigger the suction of warm and humid air from regions located further south. The vertical deviation of atmospheric currents induced by the presence of mountains also favors convective processes that can reinforce the mechanisms of the monsoon and accentuate the formation of precipitation on the southern flanks of the Himalayas, while the Tibetan Plateau, being protected from humid air flows by the Himalayan orographic barrier, remains dry throughout the year.
2.2. Climate trends and warming
In the same way as in the global atmosphere, a warming trend has been observed in the atmosphere of the high mountains of Asia since pre-industrial times (~1850) and has intensified in recent decades. This warming is both spatially and seasonally contrasted. However, it is difficult to quantify because of the limited number of observations available in the region, a problem that also affects the study of precipitation and the monitoring of glaciers and snow cover. The use of general circulation models (GCMs, see Climate models and the focus “Global models for regional studies“) allows the estimation of changes both in the past, for periods where no observations are available, and in future projections. It also makes it possible to simulate the evolution of the climate and its response to greenhouse gas emissions and particles emitted by human activities.
It is thus estimated that the warming observed in the high mountains of Asia is the result of different forcings [8] (i) that of greenhouse gases, which warm the atmosphere in a relatively homogeneous way at the level of the whole planet, and (ii) that of aerosols, linked to particulate pollution, which affect the climate rather at the regional scale. There are different types of aerosols:
- Absorbing aerosols, such as black carbon, which warm the atmosphere and accelerate melting by reducing the surface albedo when deposited on snow and glaciers;
- Solar scattering particles, such as sulfates, which tend to cool the climate by blocking solar radiation.
Although these forcings do not all act in the same direction, the sum of all their effects leads to a warming, with regional modulations that are partly linked to aerosols.
Figure 4 illustrates the temperature change in the high mountain region of Asia and on the Tibetan Plateau [9], [10], [11], [12]. It is estimated from observational products and GCMs, for (i) the winter period (December-January-February-March-April: DJFMA) and (ii) the monsoon period (June-July-August-September: JJAS).
- Over the period 1979-2014, moderate warming is observed, on the order of 0.1°C per decade in the plains of the Indian subcontinent, and more pronounced in the northern and highland regions, with values sometimes exceeding 0.5°C per decade (Figure 4).
- Snow cover shows contrasting spatial trends in winter and a generalized decline in summer (Figure 4 eg), trends that are less pronounced in the multi-model mean (Figure 4 fh) than in the observations.
- There is an increase in precipitation totals in the west of the region and a drying out in the east, a feature that is more pronounced in summer than in winter (Figure 4 ik) and is much more moderate in the models (Figure 4 jl).
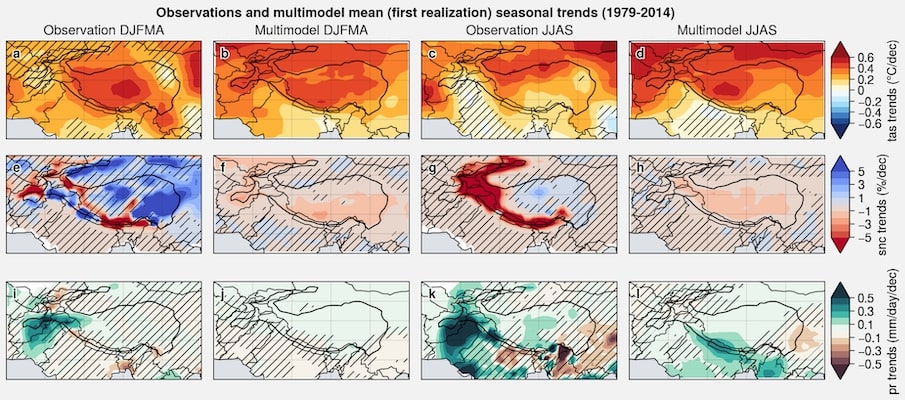
While the temperature increase is both generalized and marked in this region, the changes in precipitation and snow cover are more contrasted because they depend on complex processes. For example, melting snow cover may be offset by increased winter precipitation that generates more surface snow accumulation.
In addition, the increase in temperature generally leads to an intensification of the hydrological cycle and therefore to greater precipitation. However, this can be modulated by changes in atmospheric circulation, which are themselves linked to a response of the climate to anthropogenic forcings or to natural variability.
Climate change in the high mountains of Asia is also resulting in more frequent and intense extreme events, such as extreme rainfall intensities or heat waves. It also induces melting of permafrost and retreat of glaciers (see section 3).
2.3. Future projections

Among these scenarios, Figure 6 shows for the SSP2-4.5 (reduced emissions) and SSP3-7.0 (high emissions) scenarios the differences in model medians [13] between 2081-2100 and 1995-2014 for temperature, precipitation and snow cover.
The models suggest some similarity between past and future trends (Figures 4 and 5), but with more pronounced local changes in the projections, which can locally reach (i) more than 6°C for temperature, (ii) -15% for snow cover area decrease, and (iii) +1.2 mm per day for precipitation.
At the scale of the entire Asian Highlands region, the simulated median warming in 2081-2100 relative to 1995-2014 is estimated to be:
- +1.9 [+1.2 to +2.7] °C in the SSP1-2.6 scenario ;
- +6.5 [+4.9 to +9.0] °C in the SSP5-8.5 scenario.
- A relative decrease in snow cover extent from -9.4 [-16.4 to -5.0] % to -32.2 [-49.1 to -25.0] %
- A relative increase in precipitation from +8.5 [+4.8 to +18.2] % to +24.9 [+14.4 to +48.1] % by the end of the century in these respective scenarios.
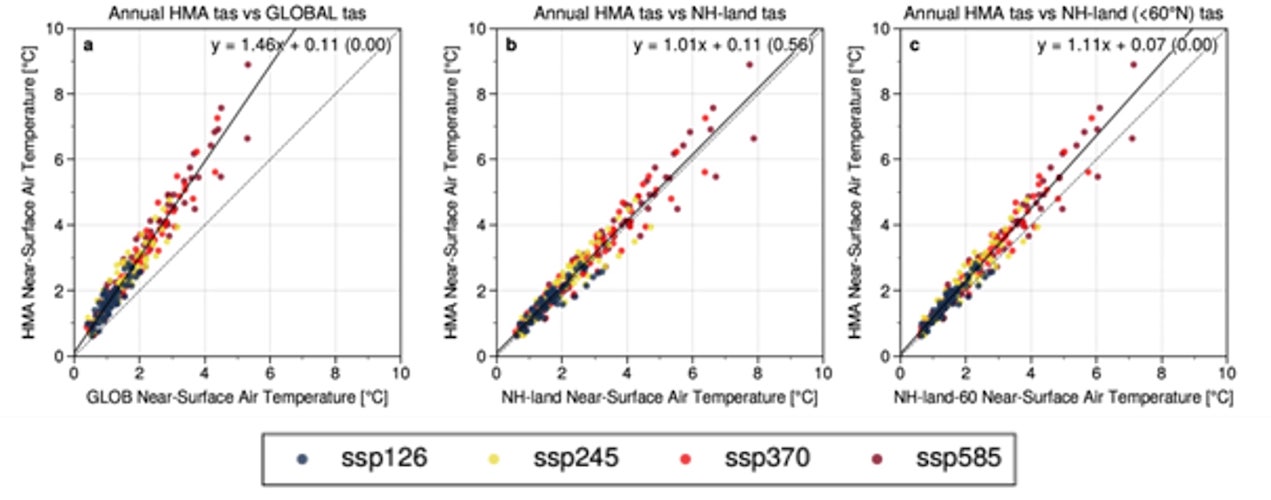
These simulations show that the rate of warming in the high mountains of Asia is 46% higher than the global warming rate (Figure 6a). This amplification is mainly explained by the contrast in warming between continental surfaces and the oceans, with the latter warming less rapidly due to their high thermal inertia. However, the warming of the high mountains of Asia remains 11% higher than over the other continental surfaces of the Northern Hemisphere excluding the Arctic region (Figure 6c). This regional amplification is partly related to the retreat of the cryosphere, which gives way to darker surfaces absorbing excess solar energy due to their low albedo [14]. The models also demonstrate a quasi-linear relationship between global average warming and that simulated in the high mountains of Asia (Figure 6).
This result, which is robust and verified with both observations and models, suggests that the future evolution of the climate of the high mountains of Asia over the next century depends very strongly on the global mean temperature, and thus on policy decisions that could limit greenhouse gas emissions on a global scale.
3. Glaciers and climate in Asia
3.1 Geographical distribution and morphological characteristics of high mountain glaciers in Asia
The distribution of glaciers and their morphological characteristics are strongly conditioned by both the topography and the prevailing climatic regimes. If the topography sets an absolute constraint on the maximum altitude at which glaciers form, the climate exerts a very strong control on the minimum altitude that glaciers can reach. Indeed, there is competition:
- between processes that contribute to accumulation (precipitation in the form of snow) ;
- and the ablation processes (mainly melting, but also sublimation or calving in case of lake-terminating glaciers)
The balance between these two types of processes is controlled by the climate.
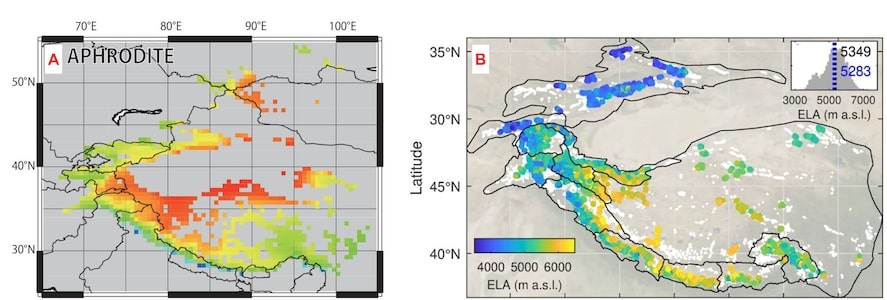
To understand the geographical distribution of glaciers in the high mountains of Asia, we can look at a variable that is the equilibrium line altitude (ELA in English). It represents the altitude at which the accumulation and ablation are exactly compensated. This altitude varies every year: if ablation processes dominate, the altitude of the equilibrium line rises, and if not, it falls. Empirical studies show that the altitude of the equilibrium line that corresponds to a steady state of a glacier is approximately equal to its median altitude [15].
A mapping of equilibrium line altitudes of glaciers in the high mountains of Asia shows that glaciers occur at very different elevations depending on their location (Figure 7) [16]:
- Glaciers located in the west and north-west (Tien Shan, Pamir, Hindu Kush, Karakoram) have low equilibrium line altitudes, between 4000 and 5000 m above mean sea level (a.s.l.)[17].
- Glaciers located further south (Central Himalaya, Nyainquentanglha) or in the inner part of the Tibetan Plateau and in the Kunlun Shan range have equilibrium line altitudes above 5000 m or even 6000 m a.s.l..
Apart from climate, other morphological factors can influence the distribution of glaciers. This is the case of the slope which, if it is strong, can favour avalanches and thus modify the accumulation, or of the debris cover.
This last characteristic has been widely studied in recent years, as many glaciers in the high mountains of Asia are partially covered with rocky debris of varying granulometry, ranging from sub-millimeter to several meters. Using satellite measurements, maps of debris-covered ice surfaces have been produced for all of the high mountains of Asia. Herreid and Pellicciotti [18] estimate 14% and 19% of these glaciers to be covered by debris, depending on whether they are located to the west or east of the range, respectively.
The more debris-covered glaciers are, the more their tongues extend to lower elevations, probably due to the insulating effect of rock debris that limits ablation processes [19]. The presence of rock debris thus modulates locally and regionally the distribution of glaciers. This is also the case for other morphological factors such as slope, aspect…
3.2. Contrasting evolution of glaciers according to regions

- The most recent study [24] shows that glaciers in the high mountains of Asia lost -0.22 ± 0.05 m water equivalent (w.e.)/year between 2000 and 2019, which is about 2 times less than the global average over the same period for glaciers outside of polar regions.
- In the South Asian zone, there are disparities between region-wide mass balances, less negative in the western part (-0.14 ± 0.05 m w.e./yr) than in the eastern part (-0.47 ± 0.05 m w.e./yr).
- In the rest of the high mountains of Asia, the balances are -0.20 ± 0.05 m e.e./year, but this value hides a strong heterogeneity of the balances within this region.
- Moreover, for these regions, the mass loss seems to have intensified between the beginning and the end of the last 2 decades with about a double loss in 2015-2019 compared to 2000-2004.
- Systematic processing of satellite imagery has allowed the mass balance to be quantified with very precise spatial resolution over the entire Asian highlands between 2000 and 2018 [25], with values for 12 sub-regions (Figure 10).
- Glacial mass losses are strong throughout the Himalayas and maximum in the southeastern part (-0.55 ± 0.13 m w.e./year between 2000 and 2018).
- In the Karakoram, on the contrary, glaciers are almost stable (-0.04 ± 0.04 m w.e./year between 2000 and 2018). This stability of the Karakoram glaciers, unique on our planet, has been known for 15 years under the term “Karakoram anomaly” [26]. This anomaly is in fact centered on the region immediately north-east of the Karakoram, the Western Kunlun, where the glaciers are gaining some mass (+0.04 ± 0.04 m e./year between 2000 and 2018).
We do not yet know all the explanatory elements for this singular behavior of the Karakoram glaciers, but certain possible explanations are beginning to emerge:
- On the one hand, these glaciers have a particular morphology linked to the extreme topography of the region, with often significant debris cover and major avalanche activity, factors conducive to limiting melting.
- On the other hand, there is an increase in annual winter and summer precipitation combined with a decrease in average and minimum temperatures during the summer.
Different hypotheses have been put forward to explain these climatic trends, ranging from a change in the general westerly circulations that carry precipitation [27], which are more centered on the Karakoram than they were a few decades ago, to an intensification of the water cycle on a regional scale, due to the development of irrigation in the Tarim Basin to the north-east of the Karakoram [28]. The Karakoram anomaly has existed at least since the 1970s [10], but it would tend to disappear now [11].
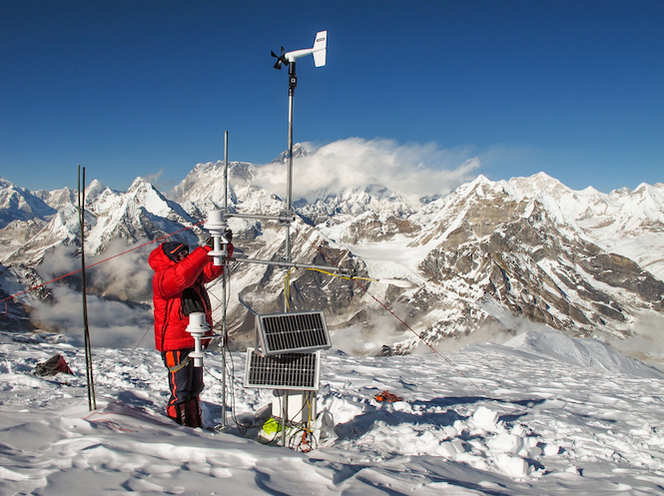
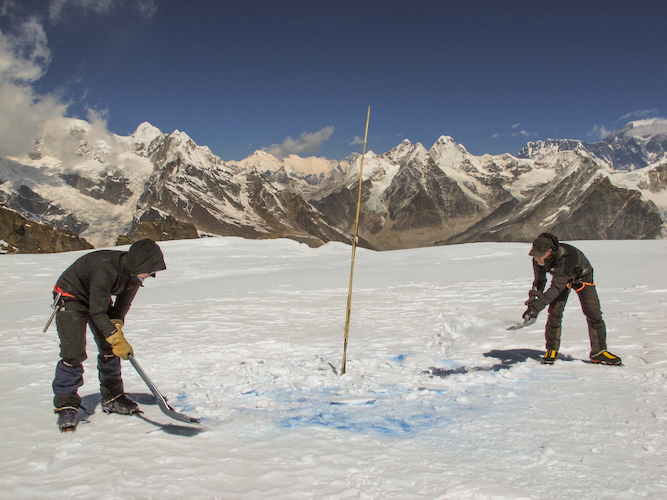
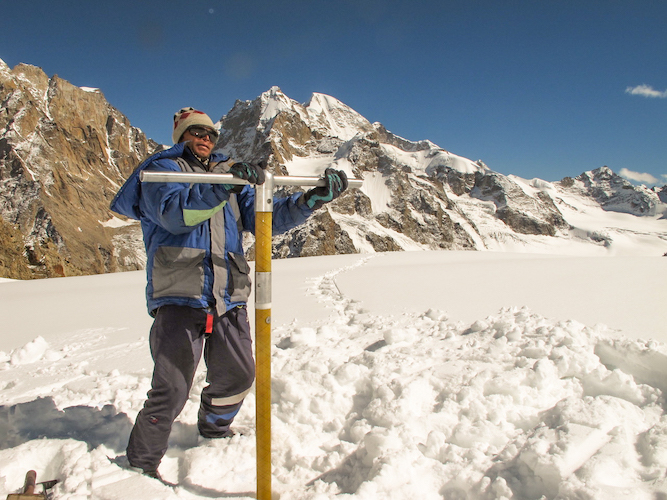
This is for example the case of the Chhota Shigri glacier (Figure 10) located in northern India in Himachal Pradesh or the Mera glacier (Figure 11), not far from Mount Everest, whose series of mass balances initiated in 2002 and 2007 are respectively the longest in the Himalayas or Nepal. Some glaciers are monitored in Central Asia and in the Tien Shan in Kazakhstan and in China where the Tuyuksu and Urumqi N°1 glaciers have been monitored since 1957 and 1959, respectively. Chinese teams are also carrying out long-term quality monitoring of mass and surface energy balances of several glaciers in Tibet such as Zhadang, Parlung or 24K glaciers. To date, no glacier monitoring exists in the Karakoram. This kind of monitoring requires a long term investment, both human and financial, especially in these remote and high altitude regions where the glaciers are difficult to access, or too steep to walk on easily.
3.3. A different sensitivity of the mass balance to climate depending on the region

This study shows that the most continental glaciers, such as those in the interior of the Tibetan Plateau and especially in the Kunlun Shan Range, are the least sensitive to a temperature increase. On the other hand, one of the limitations of this approach is that it cannot explain the mass gains associated with an increase in precipitation. The most maritime glaciers, such as those in the Nyainquentanglha, are the most sensitive to an increase in temperature, and mass losses are also greatest in this region.
3.4. What is the future for glaciers in the high mountains of Asia?
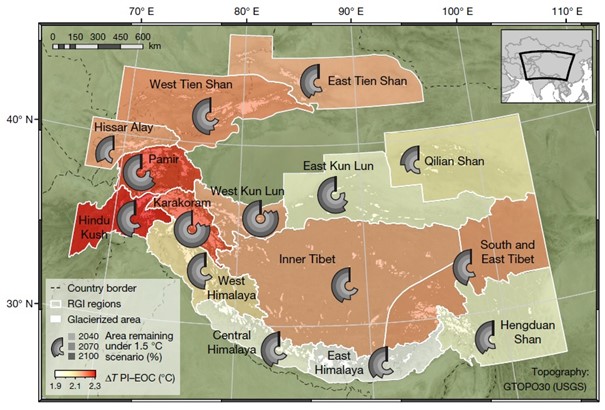
By 2100, depending on the climate scenario, between one third and two thirds of current ice volumes will have disappeared, with strong disparities between regions. Figure 13 illustrates the evolution of glaciers in the high mountains of Asia in the case where global warming is contained at 1.5°C by 2100, as advocated by the 2015 Paris agreements. The warming is amplified because this region is a continental surface located at higher elevations, from 1.9 to 2.3°C depending on the sub-region, and thus the effect on glaciers is different:
- In the central and eastern Himalayas, a loss of two-thirds of the glacierized area is expected by 2100.
- This would only be half for the Western Himalayas.
- As expected, the Karakoram, with the largest and thickest glaciers, is the least impacted region, but a loss of a quarter of the glacier area is still expected if global warming does not exceed 1.5°C.
Given the trajectories of greenhouse gas emissions, however, this 1.5°C warming is likely to be exceeded by a wide margin, and with it glacial losses in Asia at global scale.
3.5. Impacts on populations
3.5.1. On water resources
Immerzeel et al [31] have established an index called the Water Tower Index (WTI) which crosses the importance of mountains in terms of water supply and the dependence or vulnerability of the populations and ecosystems present downstream. Among all the mountain ranges in the world, the watersheds of the large rivers located in the north-west of the high mountains of Asia (Indus, Amu Darya, Tarim) are the most vulnerable. These rivers are largely fed by glaciers, especially during the summer, and they irrigate densely populated areas, with strong demographic and economic growth.
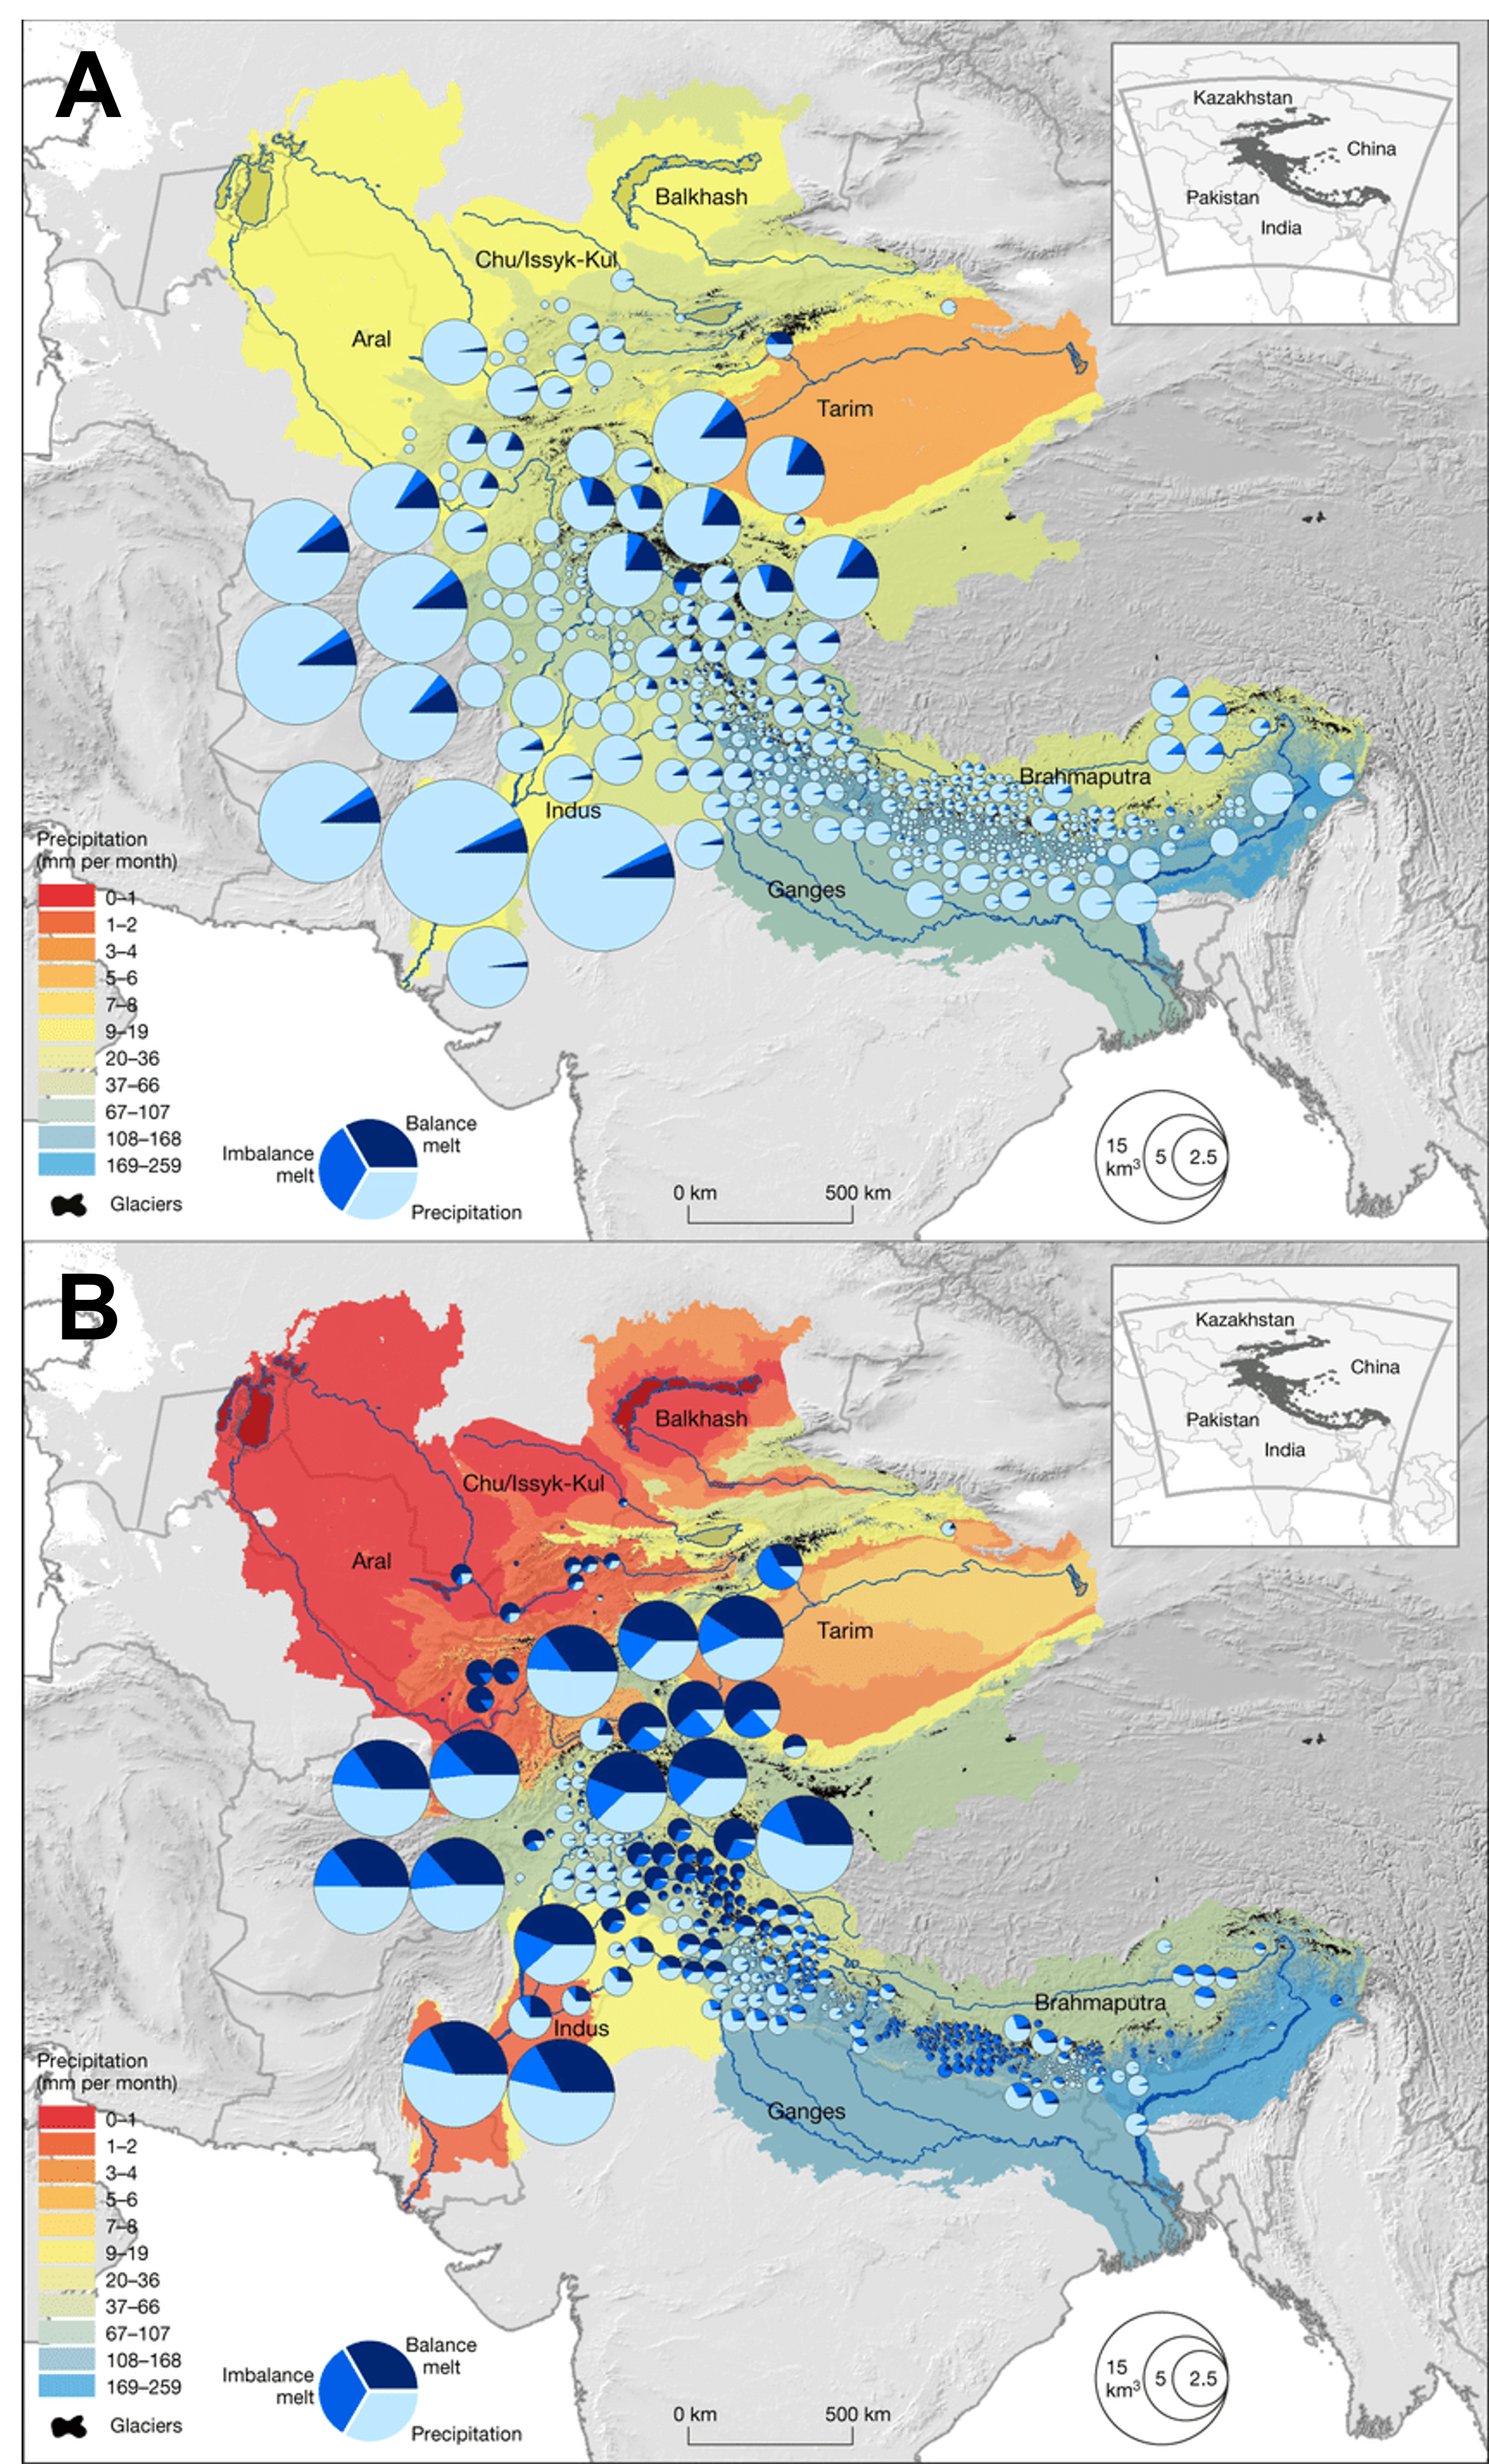
Pritchard [3] was specifically interested in the role of glaciers in the high mountains of Asia during periods of drought, considered to be the most damaging natural disasters in this region during the last century:
- Glaciers store water in solid form over long periods of time, typically several decades or more, and support river flows in summer. This is especially true in the high mountain regions of Asia where summers are dry, much less so for those subject to the Asian monsoons, which provide significant amounts of precipitation, mostly in the form of rain, between June and September, when the glaciers melt.
- In normal periods, depending on the watersheds of the major rivers, the contribution of glacial melt to the flow of rivers is limited, from less than 1% for those subject to monsoons, to a few % for arid regions. But this percentage increases drastically during droughts, because on the one hand the precipitation is lower than average (drought) and on the other hand the melting is generally accentuated (hot summers).
Figure 14 shows that the total contribution of glacial melt – that is, the loss of mass due to the negative balance of the glaciers plus the annual melting of solid precipitation accumulated on the glaciers – can exceed 50% in the driest regions of the north-western part of the chain. In a context of reduced glaciers, increased water demand, and an increase in the frequency of droughts, water pressure is likely to increase alarmingly, with a drastic reduction in available meltwater especially during the months of September and October.
3.5.2. Natural risks of glacial origin
Glacier lake outburst floods (GLOFs), usually concerning pro-glacial lakes located at the front of glaciers and generally contained by the most recent moraines, are spectacular and sometimes very deadly phenomena. Since 1936, 46 catastrophic outbursts have been reported, and 15 additional events, occurring since 1988 and detected by satellite, have been added to this catalog [33]. These catastrophic outbursts occurred most frequently east of the high mountains of Asia and there are only 5 west of 85° East latitude.
This distribution is partly explained by the fact that the glaciers to the west, especially in the Karakoram, have retreated little in recent years, in contrast to the glaciers to the east. Surprisingly, the frequency of catastrophic outflows of pro-glacial lakes has not increased over the past thirty years, while pro-glacial lakes have largely expanded over the same period. This shows that the relationship between the formation and growth of proglacial lakes and their potential catastrophic discharge is not necessarily immediate. However, this study lacks temporal depth, as these catastrophic outbursts remain rare events, and thus must be documented over long periods of time. As the melting of glaciers in the high mountains of Asia will continue, many pro-glacial lakes will continue to develop, thus increasing the risk of catastrophic outburst especially in regions where they are not currently observed, such as the Karakoram [34].
4. Messages to remember
- The high mountains of Asia are exposed to mid-latitude low pressure systems on their western flank and to monsoonal flows on their southern flank. These high mountains surround the Tibetan Plateau which is a very dry region.
- The warming observed in the high mountains of Asia during the last decades is spatially contrasted with values reaching 0.1°C/decade in the western and southern parts and exceeding 0.5°C/decade over Tibet.
- Warming in the high mountains of Asia is about 11% faster than on continental surfaces at the same latitudes. The average warming expected at the end of the 21st century in this region ranges from +1.9°C to +6.5°C relative to 1995-2014 depending on greenhouse gas emission scenarios. It is estimated that these levels of warming will be associated with a relative decrease in snow cover extent from -9.4% to -32.2% and a relative increase in precipitation from +8.5% to +24.9%.
- The high mountains of Asia are home to the largest ice-covered areas outside of the ice caps, with a current total area of about 100,000 km2.
- Thanks to satellite observations, we have a precise knowledge of the evolution of the mass balance of glaciers in the high mountains of Asia, since 2000. On average between 2000 and 2019, these glaciers are losing half the mass of the world average, with an average mass balance of -0.22 ± 0.05 mm w.e./year
- This average hides a strong regional disparity, with strong mass losses in the south-eastern part of the chain (-0.55 ± 13 m w.e./year between 2000 and 2018) and a slight gain in the north-western part (+0.04 ± 0.04 m w.e./year), which is explained by a change in climatic variables (mainly temperature and precipitation) and a spatially heterogeneous sensitivity to these variables.
- If global warming is contained at +1.5°C by 2100, between one third and two thirds of glaciers will have disappeared by the end of the century, depending on the greenhouse gas emission scenarios. But regional disparities will be strong, with the glaciers in the southeastern part of the chain being the most vulnerable.
- The consequences in terms of water resources will be important, mainly in the regions not affected by the Asian monsoons (north-western part of the chain), and especially during drought episodes.
- With the increase of pro-glacial lakes, retained by the moraines of the retreating glaciers (especially in the south-eastern part of the chain), the risk of sudden glacial lake outburst flood increases.
Notes and references
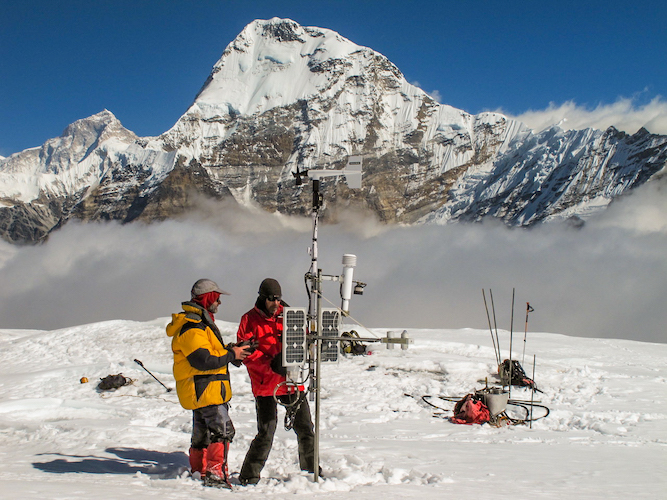
Cover image. Martin Ménégoz, making a well in the snow to measure the accumulation at 6350 m a.s.l. on the Mera glacier, in front of Everest. [Source: © Patrick Wagnon]
[1] Immerzeel, et al (2010): “Climate Change Will Affect the Asian Water Towers”. Science. https://doi.org/10.1126/science.1183188.
[2] Shean, et al. (2020): “A Systematic, Regional Assessment of High Mountain Asia Glacier Mass Balance”. Frontiers in Earth Science. https://doi.org/10.3389/feart.2019.00363.
[3] Pritchard, (2019): ‘Asia’s shrinking glaciers protect large populations from drought stress’. Nature. https://doi.org/10.1038/s41586-019-1240-1.
[4] Bookhagen, and Burbank (2010): ‘Toward a Complete Himalayan Hydrological Budget: Spatiotemporal Distribution of Snowmelt and Rainfall and Their Impact on River Discharge’. Journal of Geophysical Research: Earth Surface 115, https://doi.org/10.1029/2009JF001426.
[5] The troposphere is the layer of the Earth’s atmosphere between the Earth’s surface and the stratosphere. Its upper limit, the tropopause, is located at an altitude of about 8 to 15 kilometers depending on latitude and season.
[6] The stratosphere is the second layer of the atmosphere above the troposphere and below the mesosphere. Its upper limit (stratopause) in relation to the Earth’s surface has an altitude that varies between 12 and 50 km depending on the latitude on the globe.
[7] The Rossby waves or planetary waves are undulatory movements of the atmospheric circulation of long wavelength whose initiation is due to the variation of the Coriolis force according to the latitude, and which can be amplified by the topography.
[8] Xu, Y., Ramanathan, V., and Washington, W. M.: Observed high-altitude warming and snow cover retreat over Tibet and the Himalayas enhanced by black carbon aerosols, Atmos. Chem. Phys. 16, 1303-1315, https://doi.org/10.5194/acp-16-1303-2016, 2016.
[9] Lalande, M., Ménégoz, M., Krinner, G., Naegeli, K., and Wunderle, S.: Climate change in the High Mountain Asia in CMIP6, Earth Syst. Dynam. 12, 1061-1098, https://doi.org/10.5194/esd-12-1061-2021, 2021
[10] Harris, I., Osborn, T. J., Jones, P., and Lister, D.: Version 4 of the CRU TS monthly high-resolution gridded multivariate climate dataset, Scientific Data, 7, 109, https://doi.org/10.1038/s41597-020-0453-3, 2020.
[11] Robinson, D. A., Estilow, T. W., and NOAA CDR Program: NOAA Climate Data Record (CDR) of Northern Hemisphere (NH) Snow Cover Extent (SCE), Version 1.[r01], NOAA National Centers for Environmental Information [data set], https://doi.org/10.7289/V5N014G9, 2012.
[12] Yatagai, A., Kamiguchi, K., Arakawa, O., Hamada, A., Yasutomi, N., and Kitoh, A.: APHRODITE: Constructing a Long-Term Daily Gridded Precipitation Dataset for Asia Based on a Dense Network of Rain Gauges, B. Am. Meteorol. Soc. 93, 1401-1415, https://doi.org/10.1175/BAMS-D-11-00122.1, 2012.
[13] In statistics, the median is the value that separates the bottom half from the top half of a sample.
[14] Albedo (from the Latin albedo, meaning whiteness) is the reflectivity of a surface, i.e., the ratio of reflected light energy flux to incident light energy flux.
[15] The median altitude of the glacier is the altitude above which exactly 50% of the glacier surface is located. The median elevation is often close to the mean elevation, but it is less influenced by small englacial surfaces that might be at very high elevations.
[16] Sakai, et al. (2015) “Climate regime of Asian glaciers revealed by GAMDAM glacier inventory.” The Cryosphere. https://doi.org/10.5194/tc-9-865-2015.
[17] Miles, et al. (2021) “Health and sustainability of glaciers in High Mountain Asia.” Nature Communications, https://doi.org/10.1038/s41467-021-23073-4.
[18] Herreid, S. and Pellicciotti, F. (2020) “The state of rock debris covering Earth’s glaciers.” Nature Geoscience. https://doi.org/10.1038/s41561-020-0615-0.
[19] Brun, et al. (2019) “Heterogeneous Influence of Glacier Morphology on the Mass Balance Variability in High Mountain Asia”. Journal of Geophysical Research: Earth Surface. https://doi.org/10.1029/2018JF004838.
[20] Azam FM and 5 others (2018) Review of the status and mass changes of Himalayan-Karakoram glaciers. Journal of Glaciology 64(243), 61-74. doi: 10.1017/jog.2017.86
[21] Hoelzle, et al. (2017): ‘Re-establishing glacier monitoring in Kyrgyzstan and Uzbekistan, Central Asia’. Geoscientific Instrumentation, Methods and Data Systems. https://doi.org/10.5194/gi-6-397-2017.
[22] Brun, et al. (2017): ‘A spatially resolved estimate of High Mountain Asia glacier mass balances from 2000 to 2016’. Nature Geoscience. https://doi.org/10.1038/ngeo2999.
[23] Zhou, et al. (2018). “Glacier mass balance in the Qinghai-Tibet Plateau and its surroundings from the mid-1970s to 2000 based on Hexagon KH-9 and SRTM DEMs.” Remote Sensing of Environment. https://doi.org/10.1016/j.rse.2018.03.020.
[24] Hugonnet, et al. (2021): ‘Accelerated global glacier mass loss in the early twenty-first century’. Nature. https://doi.org/10.1038/s41586-021-03436-z.
[25] Shean, et al. (2020): “A Systematic, Regional Assessment of High Mountain Asia Glacier Mass Balance.” Frontiers in Earth Science. https://doi.org/10.3389/feart.2019.00363.
[26] Hewitt (2005). “The Karakoram anomaly? Glacier expansion and the ‘elevation effect’, Karakoram Himalaya”. Mountain Research and Development.
[27] Forsythe et al. (2017). “Karakoram temperature and glacial melt driven by regional atmospheric circulation variability.” Nature Climate Change. https://doi.org/10.1038/nclimate3361.
[28] De Kok, et al. (2018): ‘Irrigation as a Potential Driver for Anomalous Glacier Behavior in High Mountain Asia’. Geophysical Research Letters. https://doi.org/10.1002/2017GL076158.
[29] Sakai, Akiko, and Koji Fujita (2017). “Contrasting glacier responses to recent climate change in high-mountain Asia”. Scientific Reports. https://doi.org/10.1038/s41598-017-14256-5.
[30] Kraaijenbrink, et al. (2017). “Impact of a global temperature rise of 1.5 degrees Celsius on Asia glaciers.” Nature. https://doi.org/10.1038/nature23878.
[31] Immerzeel, et al. (2020) “Importance and vulnerability of the world’s water towers”. Nature. https://doi.org/10.1038/s41586-019-1822-y.
[32] Yao, et al. (2019) “Recent Third Pole’s Rapid Warming Accompanies Cryospheric Melt and Water Cycle Intensification and Interactions between Monsoon and Environment: Multidisciplinary Approach with Observations, Modeling, and Analysis.” Bulletin of the American Meteorological Society. https://doi.org/10.1175/BAMS-D-17-0057.1.
[33] Veh, et al. (2019): ‘Unchanged frequency of moraine-dammed glacial lake outburst floods in the Himalayas’. Nature Climate Chang. https://doi.org/10.1038/s41558-019-0437-5.
[34] Zheng, et al. (2021): ‘Increasing risk of glacial lake outburst floods from future Third Pole deglaciation’. Nature Climate Change. https://doi.org/10.1038/s41558-021-01028-3.
The Encyclopedia of the Environment by the Association des Encyclopédies de l'Environnement et de l'Énergie (www.a3e.fr), contractually linked to the University of Grenoble Alpes and Grenoble INP, and sponsored by the French Academy of Sciences.
To cite this article: MENEGOZ Martin, BRUN Fanny, WAGNON Patrick (January 5, 2025), Glaciers in the high mountains of Asia in the face of climate change, Encyclopedia of the Environment, Accessed July 23, 2026 [online ISSN 2555-0950] url : https://www.encyclopedie-environnement.org/en/climate/glaciers-in-the-high-mountains-of-asia-in-the-face-of-climate-change/.
The articles in the Encyclopedia of the Environment are made available under the terms of the Creative Commons BY-NC-SA license, which authorizes reproduction subject to: citing the source, not making commercial use of them, sharing identical initial conditions, reproducing at each reuse or distribution the mention of this Creative Commons BY-NC-SA license.