Genetic polymorphism and variation
PDF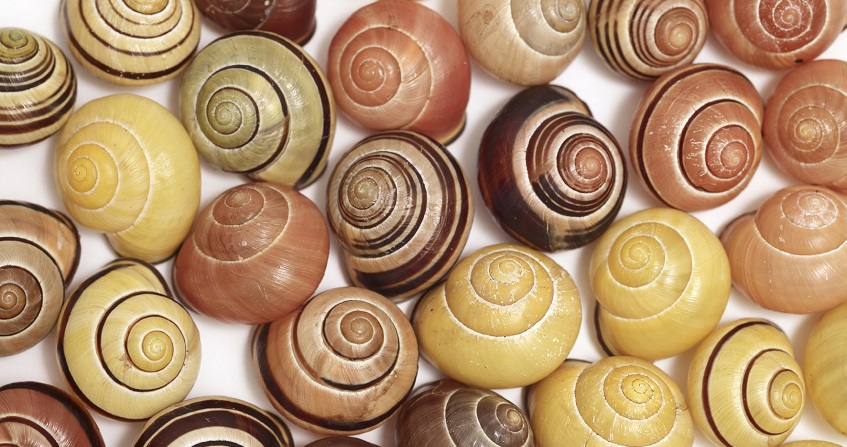
Genetic polymorphism is the existence of alternative states of DNA, determining the variation of the organism’s higher levels of integration. There are different kinds of genome modifications (mutations). The most studied are nucleotide substitutions in coding and regulatory regions.
1. Definition

Genetic polymorphism is the existence, in a population, of several alternative states of DNA, or alleles, at a defined position in the genome, or locusPosition of the gene on the chromosome. In population genetics, a set of homologous genes (homology class). Two genes are homologous if they match meiosis. Plural: loci.. This definition has several aspects:
(1) First, the trait must be carried by the chromosomes and be transmissible.
(2) Then the alleles must be homologousTwo chromosomes or two genes are said to be homologous if they match and mutually exclude each other from meiosis. for their position in the genome, which excludes certain types of variation that will be discussed later.
(3) But since the trait is transmissible, position homology also implies that the alleles are homologous by descent; if they are different, it is therefore that a mutation (at least) has occurred in one of the lines that links them to their last common ancestor (Figure 1).
(4) Finally, genetic polymorphism can be defined at the scale of the smallest unit composing DNA: the nucleotide site. As a result, each nucleotide variant can determine the polymorphism of the higher levels of biological structure – the individual’s gene, protein and phenotype – which become scales at which genetic polymorphism can be described (Figure 2).
Take the example of the ABO blood system, which corresponds to antigenic motivesPart of the antigen recognized by an antibody or lymphocyte receptor. Also known as an epitope or antigenic determinant. The same antigen can have several epitopes (identical or different) and thus induce a varied immune response. involved in the compatibility during blood transfusions. This is a case of genetic polymorphism present in human populations, involving the protein ABO glycosyl transferaseEnzyme allowing the transfer of residues containing sugars to proteins. In the case of the ABO system, glycosyl transferase A and B respectively induce an individual to belong to group A or B. When both glycosyltransferases are present, the individual is of group AB. which has three alleles, A, B and O. An individual can have (AA), (AO); (BB), (BO); (OO) or (AB) genotypes. Its phenotype will then be [A],[A],[A]; [B],[B]; [O] or [AB], where we see that A and B “dominate” O (i.e. their expression masks that of O), and that they are co-dominant among themselves (the heterozygous between A and B has a recognisable expression, [AB]).
A polymorphism can be described first at the scale of the DNA sequence of the locus encoding a protein. Some polymorphisms are “synonymous”, i.e. they do not change the amino acid sequence of the protein; they are often the most numerous polymorphisms. The others modify amino acids and are called “replacement” polymorphisms. Replacement polymorphisms of ABO glycosyl transferase are of two types: polymorphisms that change the amino acid but not the antigenic unit (they do not interfere with the ABO phenotype of individuals); and other replacement polymorphisms, which determine the ABO phenotypeSet of observable characteristics of an individual..

Between the nucleotide and allele levels, genetic analyses take into account an intermediate level of description: the linear arrangement of variable sites on the locus. These arrangements, called haplotypesGroup of alleles of different loci located on the same chromosome and usually transmitted together. Haplotype is a formed by the contraction of the English phrase haploid genotype, or haploid genotype. All the genes located on the same chromosome and whose alleles segregate together during meiosis constitute a haplotype. These genes are called “genetically linked”, are useful in evolutionary genetics because they allow to find the genealogical links between the alleles (Figure 2).
Nucleotide polymorphisms also exist in intergenic regions (outside coding regions). Some affect the areas where gene expression is regulated and therefore have phenotypic expression. Others have no known effect and are referred to as “silent”.
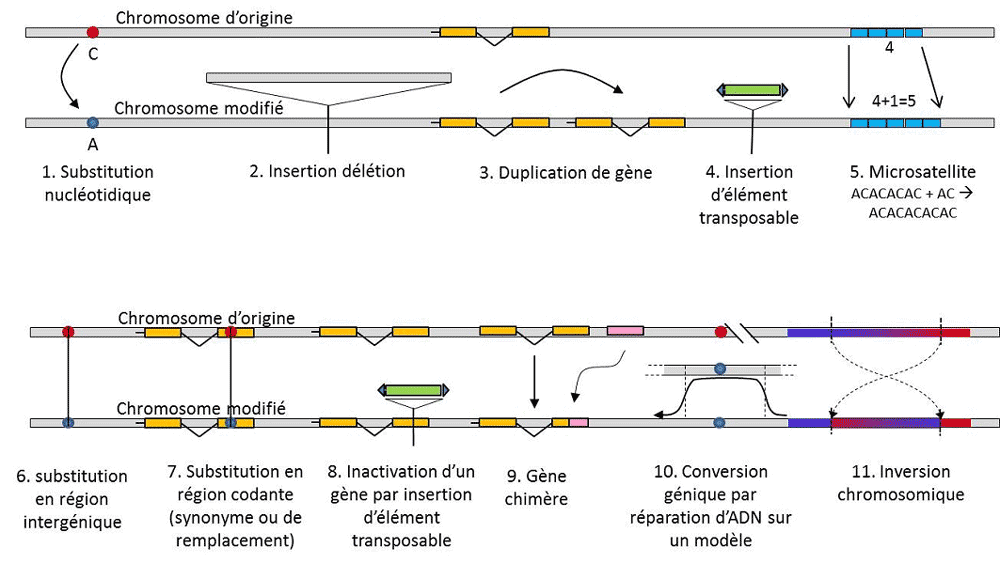
In addition to nucleotide substitutions, polymorphism for a particular type of mutation, microsatellites, refers to variations in the length of an often non-coding DNA fragment (Figure 3) due to a change in the number of repetitions in a short repeated sequence of nucleotides, e.g. CACACACA, or TGTGTG.
Not all genetic variation falls within the definition of genetic polymorphism, since it requires the position homology of alternatives (Figure 3). Thus, there are repeated sequences obtained by duplicating a gene, for which two repetitions are not homologous per position. Often, we cannot talk about homology for transposable elements either, because they generally change position during cell generations, can multiply and invade the genome. The homology of two transposable elements cannot then be defined. On the other hand, two coding sequences of the same locus, one of which is intact, and the other inactivated by the insertion of a transposable element, correspond well to a homology situation. One day, we will probably consider talking about polymorphism for the modifications of so-called “epigenetic” chromosomes, which are sometimes transmitted over several cell generations, somaticQualifies non-reproductive cells, or soma. A somatic mutation, which affects a gene of a somatic cell, disappears with the carrier individual. or germinalQualifies gametes. A germline mutation can be transmitted to its offspring., such as methylation. Their importance in the evolution of populations remains to be assessed. The limitation of the notion of genetic polymorphism to certain categories of variation – essentially nucleotide substitutions – comes from the great utility of the latter in exploring the history of natural populations. They lend themselves to mathematical modelling of evolution.
The word polymorphism means “several forms”. It is opposed to monomorphism, which indicates the absence of variation. In the vocabulary of biology, this opposition has long been used, before genetics, to signal the coexistence of several types of individuals in the same species, e.g. caste polymorphism (queen and workers) in social insects; seasonal polymorphism (fur changes) in some Arctic mammals. These cases do not fall under genetic polymorphism, a more recent concept with a narrower and more precise meaning. Continuous variations (e.g. size variation) also do not fall into the category of polymorphism, as they do not present distinct alternatives. However, locus that affect size fall within this definition. We will discuss below the most studied genetic variations because they are the most important for evolution, nucleotide substitutions, and then we will discuss the variation of phenotypes.
2. Measurement
It is not enough to say that a locus is more or less variable without giving a quantitative estimate to this judgment. A researcher can study the variation at different scales. If he is only interested in the alleles of a protein, he will measure the allelic diversity, symbolized by ‘H’. If he is interested in DNA diversity, he will measure nucleotide diversity, symbolized by ‘π’.
The allele diversity H is defined as the probability of drawing two different alleles during two sampling with replacementPerforming a successive draw with delivery of p tokens in an urn containing n tokens, means taking a first token, reading its value, putting it back in the urn, taking a second token, reading its value, putting it back in the urn, etc., until the pth token. This means choosing p objects among n with repetition (you can choose the same object several times) and in order (the order in which you choose the objects is important). The number of successive draws with tokens among n is: n × n × n × … × n = np.. If we call pi the frequency of the allele of rank i, we show that the probability of picking twice the same allele is F = Σ pi2. The allelic diversity of the sample is then its complement to 1, i.e.:
H = 1 – Σ pi2 (1)
This applies to both protein alleles and haplotypes. This is called haplotypical diversity. It can also be called heterozygosity, because in the case of a diploid locus, it gives the expected frequency of heterozygotes.
The nucleotide diversity π is the equivalent of H at the scale of each nucleotide. It is calculated as the average of the number of nucleotide differences between sequences in a sample taken two by two (δij), divided by the length of the DNA fragment into the number of nucleotides (L).
π = average (δij)/L (2) (see reference [1])
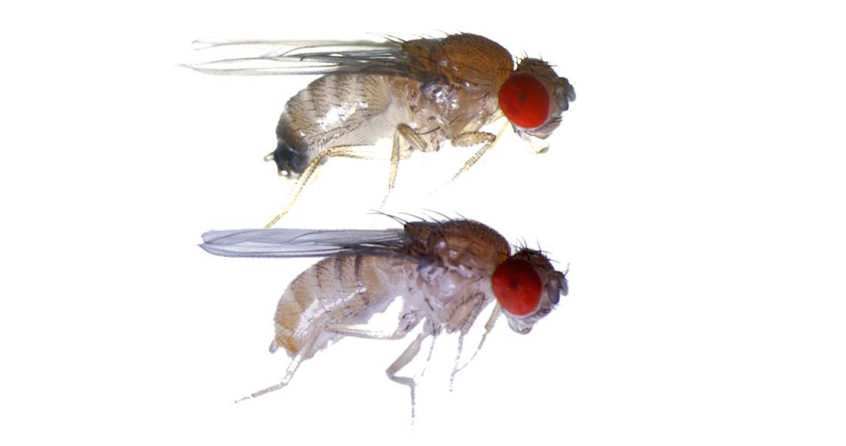
This value differs between species. In the coding parts of the human genome, two chromosomes randomly selected from the population differ on average by one nucleotide per thousand. In the fruit fly (Drosophila melanogaster) this difference is about one in a hundred. The fly is thus ten times more variable than man. When these values are related to the size of the coding regions (about 15,500 genes in Drosophila, at least 22,000 in humans), or even genomes (140 million base pairs per haploid genome in flies, about 3,200 million or twenty times more in humans), the number of polymorphic sites is astronomical and results in no one being born of the sexualized generation in any species is, has been and will be genetically identical to another one past, present or future. The information power of DNA polymorphism is immense. In forensics, detectives can identify any suspect from sixteen microsatellite locuses.
3. History
The term variation is in the title of the first two chapters of Darwin’s book The Origin of Species (1859). Darwin introduced this notion into the natural sciences at a time when the laws of biological heredity remained a mystery, and devoted another important book to it, Variation in Animals and Plants (1868). Convinced that evolution was about small variations that made little difference to the adaptation of organisms to their living conditions, he attached crucial importance to small quantitative variations, which prompted his successors (notably Karl Pearson) to found the biometryScience of life measurement. Refers in a very broad sense to the quantitative study of living beings.. But the rediscovery of Mendel’s laws in 1900 shifted interest to discontinuous variations.

From 1908 to 1930, population genetics was essentially a theoretical discipline seeking to reconcile Darwinism with Mendelian heredityHeredity based on the transmission of a single gene under a dominant, recessive or sex chromosome-linked mode X (or Y). Refers to a genetic trait with simple determinism, by a couple or a small number of couples of genes., and where probabilities played a major role. Genetics is counter-intuitive. It predicts that there is no reproduction of the parent in his descendant, because the latter’s genotype results from the lottery of the separation of the alleles before the fusion of the two parental half-genomes. It was realized that these are the allelic frequenciesFrequency at which the allele of a variant is found in a population. Expressed as a proportion or percentage. The sum of the allele frequencies of all alleles of a gene in a population is therefore by definition equal to 1. In population genetics, allele frequencies represent genetic diversity at the population or species level. that are transmitted between generations, not genotypes or phenotypes. These frequencies are more or less stable from one generation to the next and produce, beyond the multiple entanglement of filiations between individuals, the same genotypic frequenciesGenetic structure of the population. Determined from the allelic frequencies (Figure 4). The distribution of population genotypes, associated with variance, is therefore the only predictable factor. Around 1930, the three theoreticians Ronald Fisher, JBS Haldane and Sewall Wright helped to create the notion of the Mendelian populationPopulation whose heredity obeyed Mendel’s laws. [2]. In this context, evolution necessarily associates three structural levels: the gene, the individual and the population. This three-way association can be summarized by the following formula: population evolution is a change in allele frequency (gene scale, but also group scale), a change that depends on the sorting of phenotypes by selection (individual scale). Empirical population genetics research then developed, but was limited for a long time by our ignorance of how chromosomes work (the structure of DNA was understood in 1953 and its sequencing began in 1977), and had to fall back on the study of the few visible polymorphisms, such as the coloration of ladybug’s elytra or the shell of snails (see Focus The great snail debate). There was much debate among geneticists as to whether natural populations were generally polymorphic or monomorphic, and whether polymorphism was in itself beneficial or not. The study of macromolecular scale variation had to wait until 1966 (for proteins) and 1983 (for DNA) before answering these questions.
4. Quantitative variations and heritability
When we look around us, we see physical differences between beings, some complex like facial features, others easy to measure like weight or height. Common sense suggests that they are partly transmissible, although in a way that is difficult to specify. These traits are often polygenicunder the dependence of many genes. We are talking about polygenic heredity. Diabetes is a polygenic disease., which means that they are influenced by many locuses. Developmental genetics, and its application to the comparison of species (evo-devo, for “evolution of development“) unravel the web of complex interactions that make that during development the cells of the body, all with identical genetic baggage, differentiate themselves by epigenesis to give different tissues. It is still unclear how complex characters are built. Measurable phenotypes can be studied using biometrics, based on the properties of statistical distributions. One value with useful properties is the varianceIn a sample of individuals in which a given trait was measured, the variance is the difference between the mean of the square of values and the square of the mean of the values. This measure, which is always positive, indicates the dispersion of individuals. [3]. When several independent causes determine the variation of a line, their variances are additive and their sum gives the variance of the line. If they are not independent, the sum of the covariances is added to the sum of the variances. The total variance Vt of a phenotypic trait is such that :
Vt = Vga+Vgd+Vgd+Vgi+Ve
Vga, additive genetic variance, is the sum of the variances due to each locus independently of the others; Vgd, dominant genetic variance, results from the interaction of the two alleles of the same locus; Vgi, interaction variance between locuses, results from the fact that the locuses of the same individual interact; Ve, variance of the environment, is assumed here independent of genetic variance.
The genetic variance of dominance is common to two children of the same parents, because they share dominance effects when at a given locus they have received the same alleles from both parents, which happens to them at one in four locus. They do not share these effects with their parents, so they are more “similar” to each other than they are to their parents, despite the fact that they share so many genes with each other. Certainly, a parent may, by chance, have received the same two alleles as one of his children at a given locus. This chance depends on the frequency of alleles in the population. We see that the degree of similarity between a child and his or her parent for a given trait is a public property.
More generally, all components of genetic variance (Vga+Vgd+Vgi) can vary between populations. In breeding lines, a common case is inbreeding, which exhausts genetic variance: as a result, a trait may have the same average in two populations, but have a different genetic variation. The ability of a breeder to select a trait is therefore a characteristic of the line, not of the trait.
The relationship between parents and children is measured by heritability h2. It is defined as the ratio of additive genetic variance to total variance [4]:
h2 = Vga/Vt

(2) Correlation of 0, where the size of children is independent of that of parents. A valuable average parent has produced a child of indifferent value, within the distribution of children. The coordinates of the points are located on a circle; the expectation of their value is located on a line parallel to the parents’ axis (d). (3) Intermediate parent-child correlation between 0 and 1: the coordinates of the points are located on an ellipse. The expectation of their value is no longer located on the bisector of the coordinate axes (which is also the major axis of the distribution ellipse), but on the regression line r. An average parent of value has produced a child of value b (between 0 and a) with a certain variance. It is noted that case (3) is intermediate between cases (1) and (2)
It is shown under various assumptions in Figure 5. Heritability is the ability to determine whether a feature can be selected. Figure 5-3 shows that a breeder will be able, within a crossing generation, to move the average of a character from the value 0 to the value b if he selects individuals with value a. We can show that b = h2a. To select a trait, it is useful to increase the heritability ratio by standardizing the environment (thus reducing environmental variance), and by placing oneself in the environmental conditions that favour the appearance of the trait. Geneticist Waddington has shown that, in nature, a change of environment can thus reveal new traits that will then be selected during evolution.
References and notes
Cover image. Snail shells Cepaea nemoralis & Cepaea hortensis. André Künzelmann, UFZ.
[1] This formula can be written in a more conventional way as: \pi =\frac{n(n-1))}{2L}\sum _{i=1}^{n-1}\sum_{j=i+1}^{n}\delta ij
[2] Fisher R.A. (1930) The Genetical Theory of Natural Selection, Clarendon Press, Oxford; Haldane J.B.S. (1932) The causes of evolution. London: Harper & Brothers; Wright S. Evolution and the Genetics of Populations. 1, 2, 3, 4; New Edition. University of Chicago Press. 1984 (reprint by the author of his main results).
[3] Being a sample of individuals in whom the studied trait was measured, variance can be defined as the difference between the mean of the square of values and the square of the mean of the values. This measure, which is always positive, indicates the dispersion of individuals.
[4] This is heritability in the strict sense of the term. Heritability in a broad sense is the ratio of the sum of genetic variances to total variance. This formula gives heritability with both parents (the “average parent”); the estimate with only one parent would give h2/2.
The Encyclopedia of the Environment by the Association des Encyclopédies de l'Environnement et de l'Énergie (www.a3e.fr), contractually linked to the University of Grenoble Alpes and Grenoble INP, and sponsored by the French Academy of Sciences.
To cite this article: VEUILLE Michel (January 5, 2025), Genetic polymorphism and variation, Encyclopedia of the Environment, Accessed July 30, 2026 [online ISSN 2555-0950] url : https://www.encyclopedie-environnement.org/en/life/genetic-polymorphism-and-variation/.
The articles in the Encyclopedia of the Environment are made available under the terms of the Creative Commons BY-NC-SA license, which authorizes reproduction subject to: citing the source, not making commercial use of them, sharing identical initial conditions, reproducing at each reuse or distribution the mention of this Creative Commons BY-NC-SA license.