How do birds adapt to a changing climate?
PDF
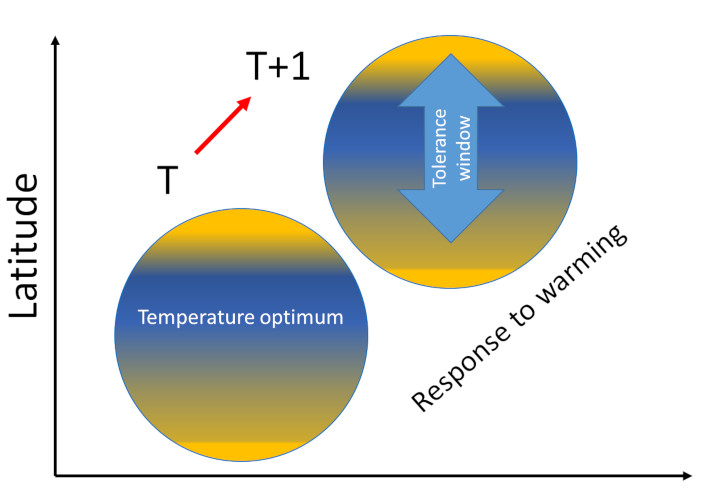
What can be done, being a bird, to adapt to a climate that is inexorably warming? Three solutions: fleeing under milder skies, adapting locally or disappearing. The best-known mechanism is the so-called “habitat tracking”: the bird follows the thermal envelope to which it is adapted, going up in latitude or altitude. Another solution is to adapt to rising temperatures if warming is neither too fast nor too high. But the safest mechanism is to adapt through microevolution, i.e. by modifying the genetic structure of the population. When, for some reason, none of these mechanisms is possible, extinction is inevitable. Species living in extreme environments (such as the tundra or high mountains) are particularly vulnerable to extinction because the movement of their habitats is constrained by geographical limits. Some categories of birds, particularly long-distance migrants frequenting many habitats during their travel, are hardly hit by the new constraints they face.
1. Huge challenges
The pace of change is so rapid and abrupt that we are faced with a new set of “natural experiments” that illustrate the challenges encountered by populations of organisms facing completely new environments. These new living conditions may lead organisms to extinction, but they can also offer them new opportunities depending on how they respond (or not) to these changes (see The adaptation of life to environmental constraints). Birds have been subject of a large number of studies on their vulnerability and responses to global warming. They are expected to be particularly affected [3] to the point that each degree Celsius increase in global temperature could lead to the extinction of 100 to 500 species [4].
2. Temperature, a key factor in physiology and ecology
The responses of organisms to global warming show cascading effects from a given level of resolution of life to the next:
- At the individual level, temperature affects growth, size, reproduction, and therefore the individual’s fitness;
- Then individual responses translate at the population level through their consequences on demographics, density and diversity, both phenotypic and genetic.
- Next, at the level of species assemblages, performance is translated at the population level by influencing its composition, structure, energy production, specific diversity and dynamics.
- Finally, what happens at the population level determines the functioning of the ecosystem.
Many examples, particularly in birds, illustrate the vulnerability of organisms to temperature variations, either when the thermal tolerance threshold is reached and then exceeded, or by decreasing ecosystem productivity, or by disrupting interactions between species thus disorganizing food webs.
3. What are birds’ responses to global warming?
Two main types of responses to global warming are provided by birds. The first is an immediate response, of phenotypic nature, whereby the bird immediately adjusts its behaviour to temperature variation (see (see The adaptation of life to environmental constraints). This type of response is possible because each life history trait is expressed within a “window of phenotypic plasticity”, the so-called reaction norm (see Focus Acclimation or adaptation?) that allows the body to respond immediately to the state of the environment. The second, much more difficult to démonstrate, is an adaptive response to new selection regimes. It is then a matter of microevolutionary adaptation, and therefore of genetic nature, in response to the new selection pressures exerted by the environment. While a phenotypic response is immediate, the microevolutionary response is trans-generational because it passes through a selective directional screening that happens on the descendants of genetic variants which present an advantageous variation for the trait in question, for example laying date or migration departure.
3.1. The “habitat tracking”
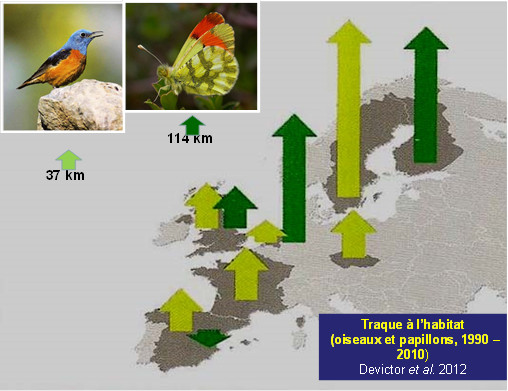
A rise in latitude in response to contemporary warming is obvious in most species of the two best studied terrestrial animal groups, birds and butterflies [7],[8] (Figure 3). This increase in latitude, which has been significant since the 1990s for 200 of the 500 breeding bird species in Europe for which data are available [9], is largely confirmed, with a strong acceleration from the 2000s. However, while climate warming plays a significant role in observed and measured movements, great care should be taken to balance climate with other environmental factors, particularly changes in habitats.
However any interpretations from correlative data involves some uncertainty because distribution envelopes of organisms may change without always having good arguments to explain them. Many changes in distribution areas cannot be explained as responses to climate change.
Hence the importance of being able to formally demonstrate the role of temperature rise in the movement of organisms.
- How to measure the extent and speed of range shifts in response to climate warming?
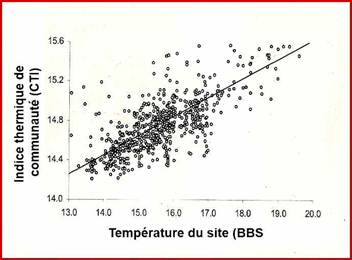
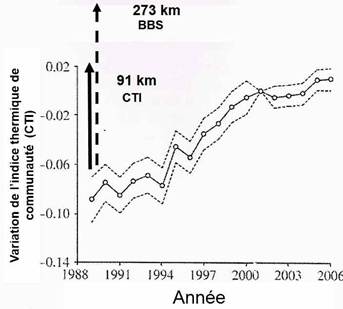
These data allowed these authors to calculate the response of bird communities to global warming: the increase over time in the CTI value of a local population indicates that this population contains an increasing number of thermophilic species (i.e. living more southerly) or, in other words, that thermophilic species have replaced less southern species, the latter having moved further north. Changes in CTIs over time provide information on the extent of average movement of each species assemblage when CTI values are reported at the sites where populations have been surveyed.
For many reasons that cannot be developed here, movements resulting from habitat tracking are highly variable depending on species, so that local species assemblages of any given habitat change over time. While latitudinal movements of birds are regularly observed, habitat tracking also occurs along mountain slopeswhen birds move up to follow altitudinal shifts of their habitats.
- And in extreme environments?

3.2. Climate warming and bird migration: new challenges
The steady decline, of about 1% per year for the last twenty years, of trans-Saharan migratory species is due to a number of constraints including a deterioration of conditions for migration and wintering habitats that fragment, desertify and transforms, as well as the worsening of metabolic constraints associated with crossing an expanding Sahara [12].
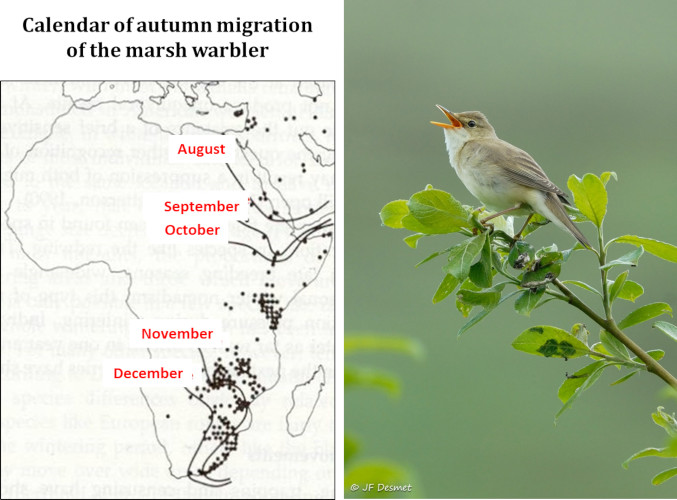
Migration (Figure 7) is a complex phenomenon governed by sophisticated behavioural, physiological and endocrine adaptations. It is achieved according to a rigorous timing and implies the existence, at the various stages of the journey, of resources allowing birds to reconstitute periodically their energy reserves in stopover sites. Climate change is disturbing the subtle balance that evolution has established between these different factors.
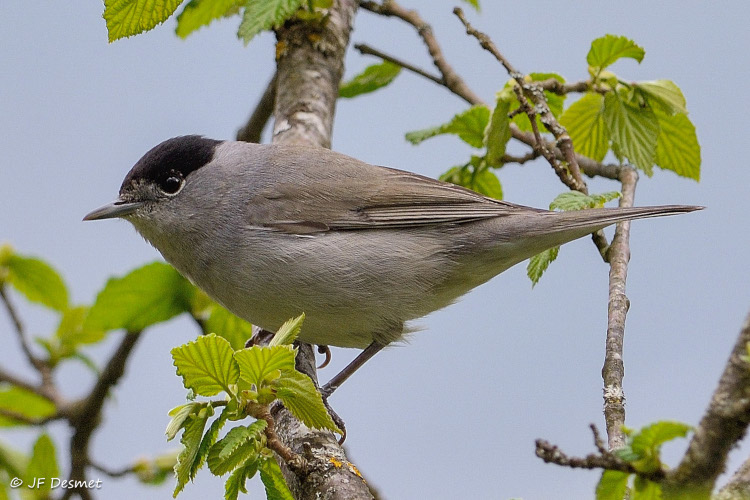
The warbler family is a nice model for studying these issues because of the seventeen species breeding in Europe, some are trans-Saharan migrants, some are partial migrants, and others are sedentary. A simulation of the response of the different species to global warming shows that, depending on various warming scenarios, breeding territories are expected to move northward by an average of 3.8 to 4.4 degrees latitude, which will increase the distances to be covered by highly migratory species such as the garden warbler (Sylvia borin) by some 400 to 600 kilometres because wintering habitats are not expected to change. It has been calculated that this increase in the distances to be covered requires an increase in the bird’s net mass of about 9%, corresponding to the excess energy reserves that must be stored in the form of fat required for this journey. We know that a small sparrow weighing about fifteen grams consumes about 3.5 grams of fat to cover 1000 km. Such an additional cost implies finding more food during migration stopovers and being able to store it as fuel in the body, a challenge that is difficult to meet and presumably one of the causes of the observed decline of populations. It may also be that the process of becoming adapted to the new conditions imposed on migrants is not fast enough if genetic responses to new selection pressures are slower than required by the speed of temperatures rising [13].
Under current selection pressures, many partially migratory species can be expected to become resident, as is already being observed, while many trans-Saharan migratory species will have to modify their migratory performance in order to meet the new challenges raised by the deterioration of their migration conditions. Huge variations in the intensity of migratory behaviour occurred repeatedly in the history of birds, especially during the Pleistocene with alternating glacial and interglacial periods that significantly altered the tempo and mode of migration.
3.3. An alternative to habitat tracking: local adaptation
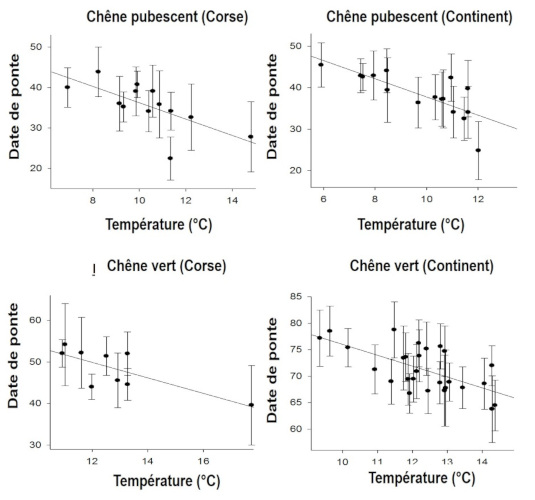
Observed changes in life history traits may be related to phenotypic plasticity whereby individual proximately responds to an environmental signal, such as immediate temperature: birds tend to start laying later when spring is cold and a earlier when it is warm (Figure 9, [16]).
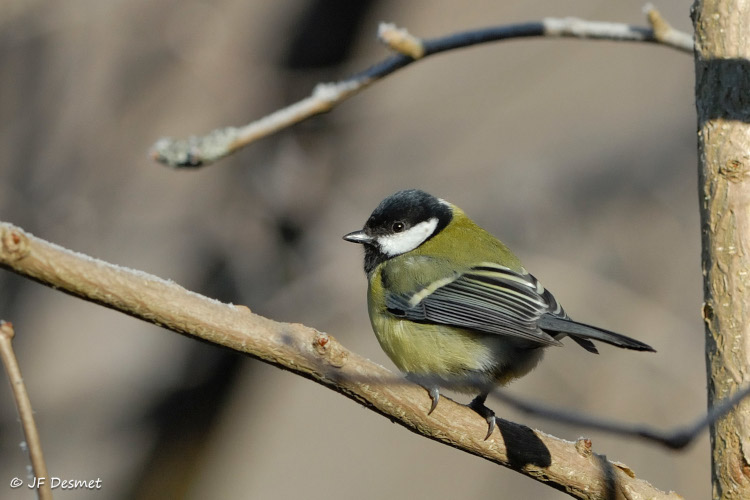
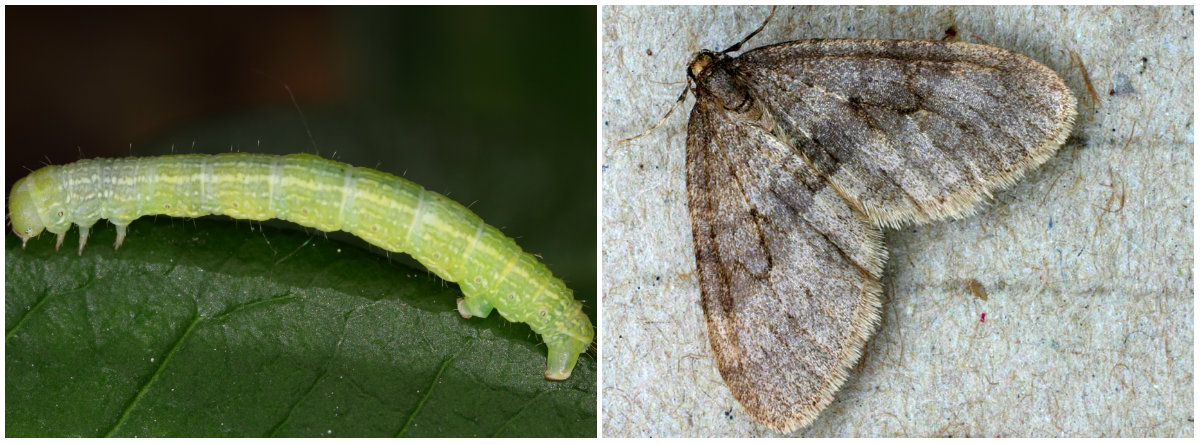
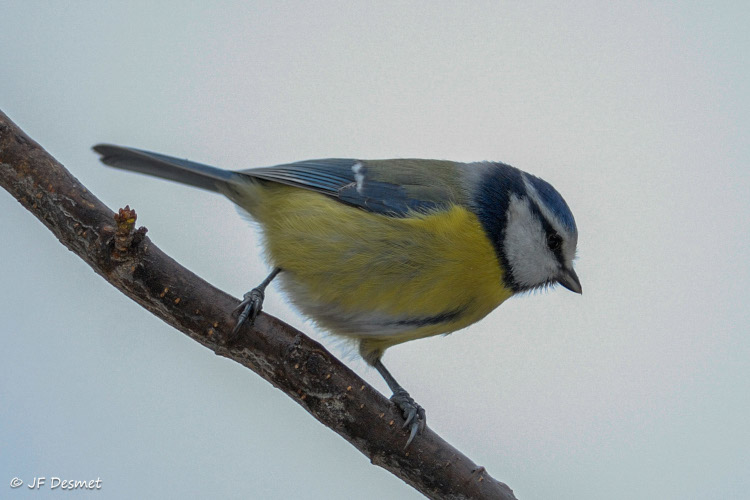
However this immediate response, which occurs within a “window of phenotypic plasticity”, has its limits because this window is not extensible so that some kind of maladaptation occurs whenever the limits of the window are overshot. In a study on the variation in the laying date of the great tit Parus major (Figure 10), Visser et al [17] were surprised to find that the population did not respond to warming, although the peak of abundance of defoliating oak caterpillars these passerines feed upon in during the breeding season, had advanced by about ten days.
The explanation for this lack of adaptation was as follows: to adjust their breeding time to the optimal date which fits to the peak abundance of the insects they feed on, birds use signals from the environment (so-called proximal signals) that inform them on the amount of food they will find more than a month later (after laying and incubating the eggs). If the ecological factor that determines the window of phenotypic plasticity within which the bird decides to lay eggs, in this case the birch budburst, does not respond in the same way to the temperature increase that triggers the development of chick food, in this case the budburst of oaks that announces the hatching of defoliating caterpillars, there will be a gap between these two crucial stages of the reproductive cycle, namely laying eggs and rearing young. The bird’s margin of manoeuvre is narrow because when the first egg is laid, the “blow is gone” so to say because the events inevitably follow one another: it takes four days to form an egg in the oviduct, the bird lays one egg a day and then incubates its clutch laying for 12 days. Since the young’s needs are at their maximum eleven days after hatching, the bird must “decide” to lay 4+10+12+11 days = 37 days before the peak of abundance of the food resource if it lays 10 eggs. It does this by using signals “proximal” to the medium, in this case the photoperiod. [18]
Besides phenotypic plasticity that has its limits, adaptive evolution by directional selection can be rapid so that selective processes can significantly affect the dynamics of a population within a few generations [20]. Such an evolutionary change will, over time, restore the broken synchronism; a process known as “evolutionary rescue” by which the genetic structure of the population gradually changes over time as a result of directional selection that favours the least maladapted individuals.
But the effectiveness of phenotypic plasticity is not indefinite. At some point, when the limit of the plasticity window has been reached, a microevolutionary mechanism comes into play to take over, one might say. Quantitative genetics methods that have been applied to this population since all individuals are ringed and therefore known, have demonstrated the effectiveness of this mechanism based on two key parameters, the intensity of selection imposed by the temperature differential and the heritability of laying date. The authors of the study showed that tits whose mothers nest a little earlier in the warm years are more likely to recruit their young into the population than others, with recruitment rates being in the average when the previous year’s temperatures were in the average.
3.4. The cost of maladaptation
- lower quality offspring with little chance of survival,
- a much higher cost of raising chicks (about 2 to 4 kilojoules spent to produce one gram of chicks compared to 1 to 2 kilojoules in well synchronized broods),
- a metabolic effort provided by the parents almost twice as high (5 to 7 times the base metabolism compared to 3 to 4 times) to feed the mismatched broods [16].
The consequences of such a lack of synchronization between supply and demand could become serious if the acceleration of global warming were to become such that the expected response to selection was not fast enough to allow organisms to adapt in time to new environmental conditions.
4. Global changes and ecosystem functioning
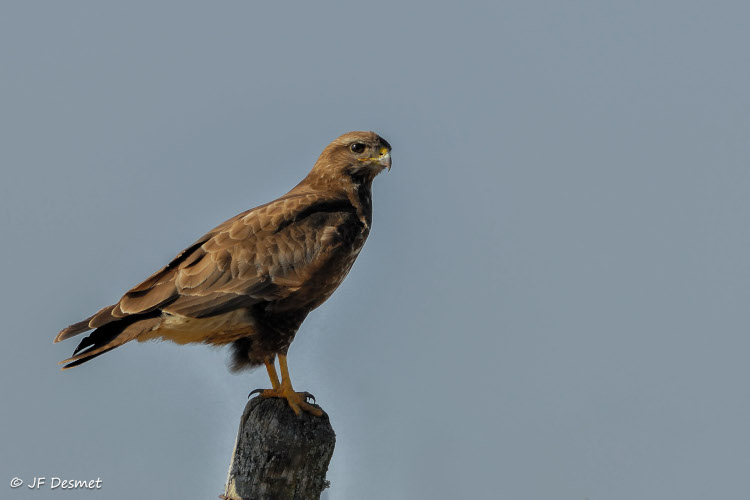
Here is an example [22]: the four-fold increase in the numbers of a German population of common buzzard Buteo buteo (Figure 13) over the past 20 years is the result of an improvement in the bird’s survival from 0.63 to 0.74 in females and from 0.61 to 0.80 in males. Surprisingly, these changes in survival were associated with a considerable decrease over the same period in the values of the very general North Atlantic Oscillation climate metric (NAO, colder temperatures, less rain but more snow; see Climate Variability: the example of the North Atlantic Oscillation). Although the relationship between the variation in NAO and buzzard survival does not say anything on the mechanisms involved because correlation does not mean causality, these variations were confirmed on a larger spatial scale: when the NAO decreases, buzzard survival increases and vice versa. The mechanism involved is therefore somehow related to these climatic factors.
The authors of the study eventually discovered it: the main prey of buzzards, especially in winter, is the vole Microtus arvalis whose populations are climate sensitive. While rain and frost are very unfavourable to this small mammal, a snow cover protects it while allowing the predator to detect and capture it if the snowpack is not too thick. A small layer of snow, which has been quite frequent over the past two decades, was therefore very favourable to voles, and therefore to their predators. The close relationship between the geographical variation in buzzard survival and climatic conditions is a demonstration of the interdependence of the different levels of variation, that of climate, that of voles and that of their predators. But this example also illustrates the complexity and, often, the unexpected nature of the relationships that climate change may produce. This makes it very difficult to predict and model the changes expected from the reorganization of food webs within species assemblages and, more generally, the responses that organisms make to climate change.
5. To go further
The main limitations of studies on organisms’ responses to climate change are due to their mostly correlative nature, which says nothing on the triggers and mechanisms involved. However, the involvement of several components of global change in changes in distribution areas or phenological events such as laying dates or migration departure dates in birds complicates the analysis of mechanisms. Three types of approaches can provide interesting answers:
- The first is modeling of niche envelopes [23] which is based on a multivariate statistical representation of the organism’s niche by relating its spatial distribution to key environmental variables. The niche thus defined is projected into the geographical space that the species should occupy in the future according to different expected scenarios of climate change as proposed by the IPCC (Intergovernmental Panel on Climate Change).
- A second approach which is expected to be particularly promising, is epigenetics, namely the study of mechanisms of environmental origin (climate stress, disturbance events, maternal effects) that modulate the expression of coding genes without modifying the genetic structure of the organism (see Epigenetics, the genome and its environment). These mechanisms of non-mendelian heredity (sometimes named “soft heredity”) can play a considerable role in adapting organisms to environmental changes because they are expressed during the development of the individual without going through the intergenerational screening of natural selection. These changes of epigenetic origin, which, moreover, are heritable, have the evolutionary consequence of either shifting the mean of the line to a new optimum, or modifying its variance and therefore its fitness, or reducing its variance around a new optimum, what is called a “phenotypic channelling” process [24].
- A third approach, still under-exploited but promising, is the use of data from the past. As soon as they can be identified, the responses of organisms to changes that took place in a more or less distant past represent “natural experiments” that allow ecological and evolutionary theories to be tested [25].
The fossil record can thus provide answers on adaptive evolution in response to climate change at time scales from a few years to about ten thousand years. It also provides answers on the reality of phenotypic plasticity at shorter time scales, of an order of one to a thousand years. Paleogenomics can also identify range shifts, population collapses and extinction events in response to climate change. Responses to variable climates have thus been explored using evolutionary genetics and experimental approaches to “resurrection ecology”, which consist in resuscitating propagules in prolonged dormancy, sometimes for several centuries (diatoms, insects, fungal algae, bacteria) and then experimentally submitting them to climatic stress events [26]. The great merit of all these approaches, many of which are still at an exploratory stage, is that they allow to move from correlative models to process models that allow to identify the mechanisms involved.
6. Messages to remember
- Organisms are adapted to live within a temperature window below or beyond which their survival is jeopardized,
- Habitat tracking in response to warming is a classic response which varies from species to species,
- Habitat tracking is no longer possible in extreme habitats (tundra, high mountains), hence the threats to birds in these environments,
- Global warming is imposing new and severe constraints on migratory birds, especially trans-Saharan migrants,
- An alternative to habitat tracking is local adaptation through phenotypic adjustment and/or or microevolution,
- Global changes modify the interactions between species, and therefore the structure and dynamics of communities.
Notes and references
Cover illustration. [Source: © Jacques Blondel]
[1] The changes inflicted by humans on the Earth system have proved so profound and universally distributed that meteorologist and chemist Paul Josef Crutzen coined the term Anthropocene at the end of the 20th century (Crutzen & Stoermer, 2000, The “Anthropocene”. Global Change Newsletter 41, 12-13), literally, “the era of man” to refer to that period in the history of the Earth from which human activities have irrevocably marked the Earth’s crust, as well as powerful telluric forces. Although the International Commission on Stratigraphy was cautious about this new sequence of Earth’s history, the term quickly became part of scientific vocabulary, including that of the life sciences.
[2] Parmesan, C. 2006. Ecological and evolutionary responses to recent climate change. Annu. Rev. Ecol. System 37: 637-669.
[3] Pearce-Higgins, J. W. & Green, R. 2014. Birds and climate change. Impacts and conservation responses. Cambridge, Cambridge Univ. Press.
[4] Sekercioglu, C. H., Schneider, S. H., S. H., Fay, J. P. & Loarie, S. R. 2008. Climate change, elevational range shifts, and bird extinctions. Cons. Biol. 22: 140-150.
[5] Brown, J. H., Gillooly, J. F., Allen, A. P., Savage, V. M. & West, G. B. 2004. Toward a metabolic theory of ecology. Ecology 85: 1771-1789.
[6] Hewitt, G. M. 2004. Genetic consequences of climatic oscillations in the Quaternary. Phil. Trans. R. Soc Lond. B 359: 183-195.
[7] Devictor, V., Julliard, R., Couvet, D. & Jiguet, F. 2008. Birds are tracking climate warming but not fast enough. Proc. R. Soc. Lond. B 275: 2743-2748.
[8] Devictor, V. van Swaay, C. Brereton, T. Brotons, L. Chamberlain, D. Heliölä, J. Herrando, S. Julliard, R. Kuussaari, M. Lindström, Å. Reif, J. Roy, D. B. Schweiger, O. Settele, J. Stefanescu, C. Van Strien, A. Van Turnhout, C. Vermouzek, Z. WallisDeVries, M. Wynhoff, I. & Jiguet, F. (2012) Differences in the climate debts of birds and butterflies at a continental scale. Nature Climate Change. 2, 121–124.
[9] Burton, J. F. 1995. Birds and Climate Change. London, Christopher Helm.
[10] Devictor, V., Julliard, R., Couvet, D. and Jiguet, F. (2007) French birds lag behind climate warming. Nature Proceedings 10 p. DOI: 10.1038/npre.2007.1275.
[11] Piersma, T. 2007. Using the power of comparison to explain habitat use and migration strategies of shorebirds worldwide. J. Ornithol. 148: S45-S59.
[12] Berthold, P., Fiedler, W., Schlenker, R. & Querner, U. 1998. 25-year study of the population development of Central European songbirds: a general decline, most evident in long-distance migrants. Die Naturwissenschaften. 85: 350-353.
[13] Doswald, N., Willis, S. G., Collingham, Y. C., Pain, D. J., Green, R. E. & Huntley, B. 2009. Potential impacts of climate change on the breeding and non-breeding ranges and migration distance of European Sylvia warblers. J. Biogeogr. 36: 1194-1208.
[14] Berthold, P. 1991. Genetic control of migratory behaviour in birds. Trends Ecol. Evol. 6: 254-257.
[15] Crick, H. Q. P., Dudley, C., Glue, D. E. & Thomson, D. L. 1997. UK birds are laying eggs earlier. Nature 338: 526.
[16] Thomas D. W., Blondel J., Perret P., Lambrechts M. M. & Speakman J. R. 2001. Energetic and fitness costs of mismatching resource supply and demand in seasonally breeding birds. Science 291: 2598-2600.
[17] Visser, M. E., Adriaensen, F., van Balen, J. H., Blondel, J., Dhondt, A. A., van Dongen, S., du Feu, C., Ivankina, E. V., Kerimov, A. B., de Laet, J., Matthysen, E., McCleery, R., Orell, M. & Thomson, D. L. 2003. Variable responses to large-scale climate change in European Parus populations. Proceedings of the Royal Society of London, series B 270: 367-372.
[18] Lambrechts, M. M., Blondel, J., Maistre, M. & Perret, P. 1997. A single response mechanism is responsible for evolutionary adaptive variation in a bird’s laying date. Proc. Natl. Acad. Sci. USA. 94: 5153-5155.
[19] Both, C. & Visser, M. E. 2001. Adjustment to climate change is constrained by arrival date in a long distance migrant bird. Nature 411: 296-298.
[20] Gingerich, P.D. 2009. Rates of evolution. Annu. Rev. Ecol. Evol. System 40: 657-75.
[21] Charmantier, A., McCleery, R. H., Cole, L. R., Perrins, C. M., Kruuk, L. E. B. & Sheldon, B. C. 2008. Adaptive phenotypic plasticity in response to climate change in a wild bird population. Science 320: 800-803.
[22] Jonker, R. M., Chakarov, N. & Krüger, O. 2014. Climate change and habitat heterogeneity drive a population increase in Common Buzzards Buteo buteo through effects on survival. Ibis 156: 97-106.
[23] Lavergne, S., Mouquet, S., Thuiller, W. & Ronce, O. 2010. Biodiversity and climate change: Integrating evolutionary and ecological responses of species and communities. Annu. Rev. Ecol. Evol. System 41: 321-350.
[24] Rey, O., Danchin, E., Mirouze, M., Lootù, C. & Blanchet, S. 2016. Adaptation to global change: a Transposable Element-Epigenetics perspective. Trends Ecol. Evol. 31: 514-526.
[25] Nogues-Bravo, D., Rodriguez-Sanchez, F., Orsini, L., de Boer, E., Jansson, R., Morlon, H., Fordham, D. A. & Jackson, S. T. 2018. Cracking the code of biodiversity responses to past climate change. Trends Ecol. Evol. 33: 765-767.
[26] Orsini, L., Schwenk, K., De Meester, L., Colbourne, J.K., Pfrender, M.E. & Weider, L.J. 2013. The evolutionary time machine: using dormant propagules to forecast how populations can adapt to changing environments. Trends Ecol. Evol. 28: 274-282.
The Encyclopedia of the Environment by the Association des Encyclopédies de l'Environnement et de l'Énergie (www.a3e.fr), contractually linked to the University of Grenoble Alpes and Grenoble INP, and sponsored by the French Academy of Sciences.
To cite this article: BLONDEL Jacques (January 5, 2025), How do birds adapt to a changing climate?, Encyclopedia of the Environment, Accessed August 3, 2026 [online ISSN 2555-0950] url : https://www.encyclopedie-environnement.org/en/life/how-birds-adapt-changing-climate-2/.
The articles in the Encyclopedia of the Environment are made available under the terms of the Creative Commons BY-NC-SA license, which authorizes reproduction subject to: citing the source, not making commercial use of them, sharing identical initial conditions, reproducing at each reuse or distribution the mention of this Creative Commons BY-NC-SA license.