Outdoor air pollution: keys to understand, inform and prevent
PDF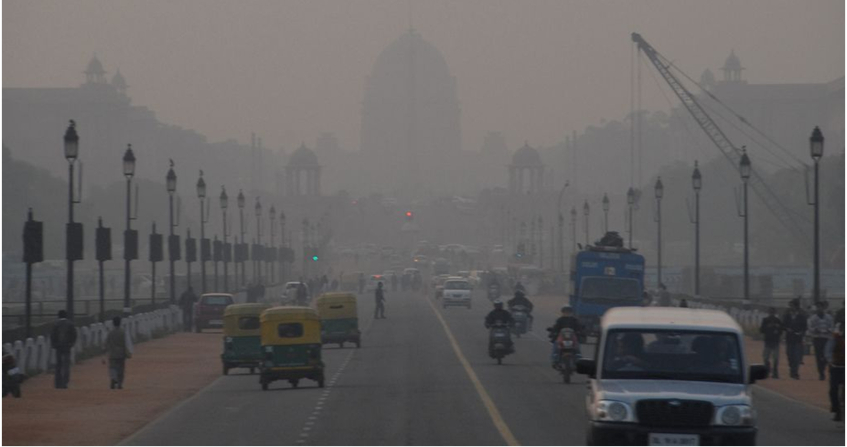
Outdoor air quality is now a major challenge for society. This article aims to clarify the phenomena involved in air pollution episodes and describe their health effects and economic impacts. This awareness has led national authorities and the European Union to offer air quality monitoring and forecasting services, such as the Prev’air and Copernicus Atmosphere Regional Systems.
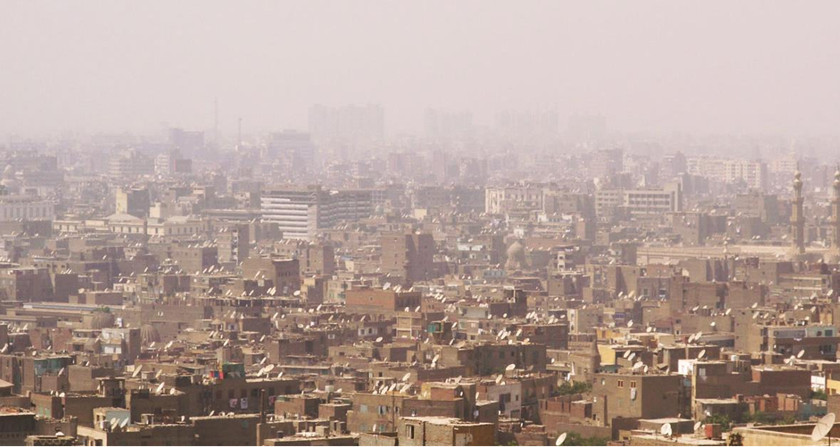
According to the latest figures from the WHO and Santé Publique France, the combined effects of outdoor and indoor air pollution would be responsible, in 2012, for the premature death of 6.5 million people worldwide and 600,000 in Europe [1]. While ambient air pollution is a very old phenomenon, a consequence of human concentrations in urban areas (read Air pollution), today it is now a major challenge for public health as well as the environment (see Figure 1).
Pollutant emitting sources can be of anthropogenic or natural origin. Air quality then results from complex phenomena to which these pollutants will be subjected in the atmosphere under the action of weather conditions. Meteorological situations favorable to the concentration of pollutants or, on the contrary, to their dilution or dispersion in the atmosphere are presented and illustrated by examples. The harmful effects on the body of exposure to suspended particles or reactive gases have been the subject of numerous studies. The results of these studies require the implementation of regulations and monitoring of exceedances of the authorized thresholds of the main pollutants, for the information of the public and decision-makers. In order to better understand and predict the factors that generate this pollution, numerical modelling is one of the essential tools of operational warning and decision support systems.
1. Weather conditions: an important factor in the concentration of pollutants in the atmosphere
The “atmosphere” refers to all the gases surrounding the Earth under the influence of gravity. The composition of the atmosphere, the physical and chemical characteristics of its different layers are described in The atmosphere and the gaseous envelope of the earth. Pollution phenomena concern the first two layers of the atmosphere, the troposphere (altitudes below about 12 km depending on latitude) and the stratosphere (up to about 60 km). Pollution affecting the stratosphere is mainly manifested by an additional greenhouse effect (see Air Pollution) and by the destruction of the protective ozone layer resulting from the combination of special weather conditions and the contribution of halogenated compounds (chlorofluorocarbons or CFCs) from human activities.
1.1. The atmospheric boundary layer
The greatest variations in pollutant concentrations according to weather conditions are observed in the troposphere and, in particular, in the atmospheric boundary layer. This boundary layer is the portion of the atmosphere subject to the influence of the Earth’s surface; its thickness varies from a few hundred metres to a few kilometres depending on larger-scale atmospheric conditions and surface characteristics [2]. Friction of the ground and diurnal variations in its temperature have an impact on air flow and temperature.
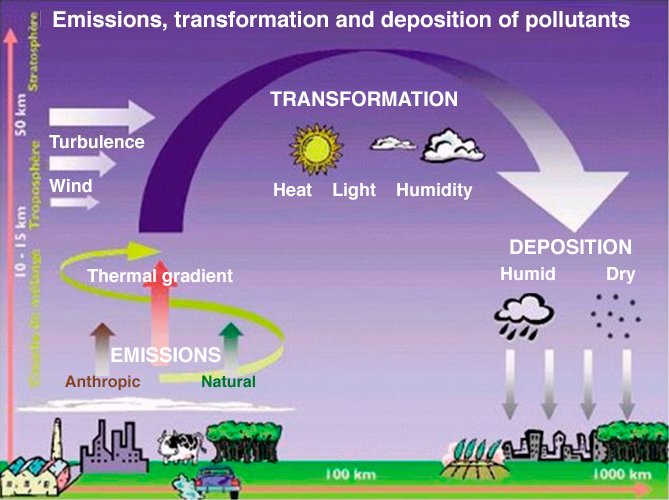
It is also in the atmospheric boundary layer that the main pollutants linked to human activity (nitrogen oxides, sulphur oxides, hydrocarbons and fine particles) or of natural origin (desert dust, sea spray, volatile organic compounds emitted by vegetation,…) are released. After their emission into the atmosphere, the pollutants, whose origins and formation are described in the article Air pollution, will then disperse or accumulate depending on weather conditions (see Figure 2). They are more or less quickly transported, diluted, dissolved and leached under:
- the effect of the wind, responsible for horizontal transport over distances of up to several hundred kilometres. The higher the wind speed, the less pollutants accumulate in the vicinity of the emission source.
- the effect of vertical turbulence. The latter, within the boundary layer, has two origins, a thermal cause due to underfloor heating and a mechanical cause due to the effect of surface obstacles that cause horizontal and vertical wind shear. This turbulence also favours the dilution and dry deposition of pollutants in contact with the ground, vegetation and various obstacles encountered.
- the effect of temperature, which directly affects the rate of chemical reactions between pollutants and thus their transformation into secondary pollutants.
- the effect of precipitation (rain, snow, fog). Some gaseous pollutants are soluble in water and will dissolve in fog droplets or clouds. This is referred to as wet deposition or, in the case of particles, aerosol capture in the cloud phase. As for rainfall, it causes particles and gases to leach out under the clouds.
Thus, in clear skies during the day, with ground temperatures higher than those of the air at the surface, an unstable layer develops in thickness as the ground warms. This instability allows the pollutants to be diluted in the surrounding air. At night, however, the soil cools by radiation. We then observe a temperature inversion over a few hundred meters. In this layer, the stability of the air then affects the dispersion of pollutants.
1.2. Winter pollution
This situation is particularly noticeable in winter, during anticyclonic conditions with light winds. Temperature inversions in this season persist for several hours due to the lower solar radiation during the day and its shorter duration.
Emissions of pollutants (NO2, SO2, fine particles) due to human activities (transport, district heating, industrial installations, etc.) stagnate in the lower layers and accumulate there. In addition, the increased use of heating related to these cold episodes increases particulate emissions. Only a change in weather conditions, the arrival of a disturbance, reinforcement or change in wind direction, can put an end to these episodes by leaching the pollutants or mixing them vertically.
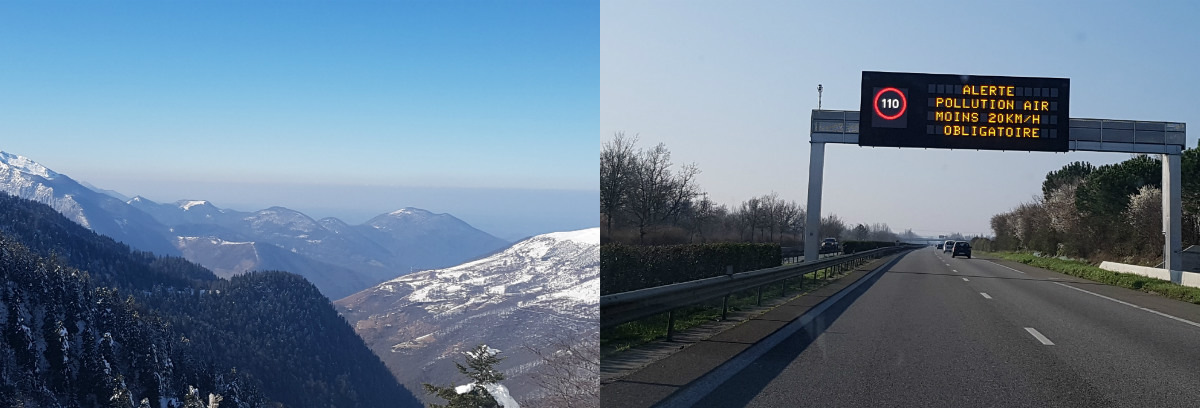
Finally, particular situations (valley effect, relief, sea breeze or urban heat island) are also likely to lead to pollution phenomena by accumulation of harmful chemical elements. The recurrent episodes of particulate pollution in the Arve Valley in winter are an illustration of this. The main causes are the massive use of wood heating during cold spells and the confinement induced by the topography which favours the accumulation of fine carbonaceous particles in a thin stable layer near the ground.
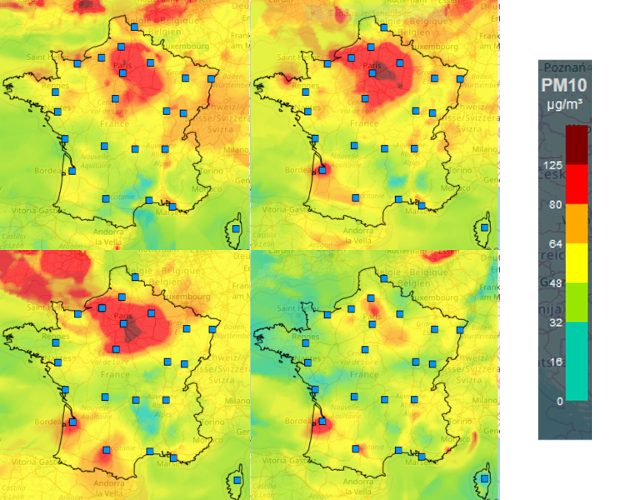
In the Paris region, the maximum PM10 concentrations measured by AIRPARIF were 146 µg/m3 on December 1 and 122 µg/m3 on December 2. Such a level ranks this episode among the most important winter episodes of the last ten years. The situation was unblocked, with the arrival of an easterly flow: the wind forces were low but the direction being constant, the accumulation phenomenon was limited.
1.3. Summer pollution
In summer, in the absence of wind with maximum solar radiation, the accumulation of pollutants such as nitrogen oxides (NOx), volatile organic compounds (VOCs), including hydrocarbons, methane and carbon monoxide (CO) leads to the production of ozone in the lower layers. Thus, almost every summer, major cities record episodes of photochemical pollution peaks.
When the wind carries the air mass, pollution occurs downstream of the precursor sources. Indeed, the chemical reaction of ozone formation from nitrogen dioxide NO2 is reversible and located near intense emissions of nitrogen monoxide (due to road traffic). Ozone can then react with the NO monoxide formed during the dissociation of NO2 to give back nitrogen dioxide. As a result, higher ozone concentrations are sometimes observed in peri-urban or rural areas near large cities than in the centre of the agglomeration.
This is an urban ozone plume phenomenon. Upstream of urban pollutant emissions, oxidant concentrations (noted Ox as a whole with Ox = O3 + NO2) correspond to the background level. Downstream from cities, low nitrogen oxide emissions no longer allow the chemical destruction of ozone, which returns to its background value, increased by the quantities produced upstream and carried by the wind.
Biogenic VOC emissions. During this season, vegetation also contributes to the emission of VOCs, particularly under the influence of the sun and high temperatures. The production of VOCs by vegetation is dominated by isoprene (C5H8) emissions, mainly from deciduous trees, with conifers emitting more complex terpene compounds. Volatile Organic Compounds play an important role in atmospheric chemistry and contribute to the formation of secondary pollutants such as Ozone and secondary organic aerosols. On a global scale, vegetation is responsible for about 90% of VOC emissions compared to 10% for human activities [3].
Finally, we cannot limit ourselves to the local level to consider episodes of heavy pollution: large-scale transport also explains the horizontal extension of these episodes over several hundred kilometres. Urban ozone pollution episodes are strongly linked to air mass transport and interactions between cities, regions and countries must be taken into account to quantify these phenomena. Here again, the change in weather conditions (change in wind direction, greater cloud cover) determines the end of the episode.
2. Health impacts and economic costs
The high proportion of exposed people makes urban and indoor pollution a major public health problem, as highlighted by numerous studies (e.g. those [4] carried out by the Laboratory of Cytophysiology and Cell Toxicology at the Paris 7 Université). Toxicological studies and epidemiological methods have identified short-term effects, in the form of clinical manifestations occurring within minutes to weeks after exposure, and long-term effects, after several months or years of chronic exposure. These effects result in higher mortality or a reduction in the life expectancy of the populations concerned.
Although awareness of the dangers of air pollutants to human health has existed since antiquity, it became a matter of concern in the first half of the 20th century following dramatic episodes such as the one in London in December 1952, responsible for more than 4000 deaths (see Air Pollution).
Toxicological studies that establish the health consequences of pollutants range from experimentation on cell cultures in the laboratory to exposure to animals or human subjects that are exposed to known and controlled quantities of pollutants. In addition, epidemiological methods link, through statistical tools, the measurements taken of certain pollutants and the pathologies observed in the people subjected to this pollution. Indeed, only the long-term monitoring of cohorts on a large number of subjects makes it possible to compare health data (pathologies, hospitalizations, deaths, etc.) with measurements of the various pollutants.
2.1. Pathologies
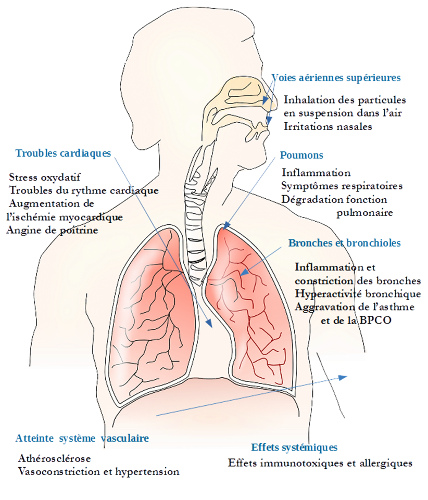
The penetration of gaseous pollutants into the respiratory tract depends on their solubility. Pollutants such as ozone (O3) or nitrogen dioxide (NO2) are highly oxidizing and therefore highly irritating. In the case of particles, their deposition in the respiratory tract depends on their size. The smaller the particles, the deeper they penetrate into the lungs and settle in the bronchi, or even the bronchioles, causing exacerbation of asthma, bronchiolitis, lung disease and worsening cardiovascular disease (see Figure 5).
These various studies emphasize the weight of chronic pollution in the resulting pathologies and show that there are no thresholds below which exposure to pollutants is without health risk. As the sensitivity threshold is very different from one individual to another, attention should not be paid only to intense pollution episodes but also measures to reduce background pollution should be widely favored.
2.2. A few figures
In its reports, the World Health Organization (WHO) distinguishes between the effects of ambient air pollution and those of indoor air pollution, while recognizing the combined effects and the difficulty of accurately identifying the two contributions [5]. In the following, only the effects of ambient air pollution will be reported.
The use of new models to assess exposure to fine particulate matter (PM2.5) combined with risk assessment methods has resulted in an estimated of old more than 3 million deaths worldwide from outdoor air pollution per year, confirming that the majority of these deaths occur in low-income countries [6].
In 2011, a three-year European study, APHEKOM [7], used a conventional health impact assessment (HIA) method to estimate the impact of urban pollution on the health of residents in 25 major European cities participating in the project. This study estimates the average life expectancy gain, in months, at age 30 years old, if the average levels of fine particulate matter (PM2.5) were reduced to 10 µg/m3 as recommended by WHO. The annual health costs and associated costs (absenteeism, loss of quality and life expectancy) related to pollution are estimated to reach €30.5 billion annually for Europe.
Results also make it possible to link the occurrence of certain chronic diseases to the residence of people who live near major roads. Thus 15% to 20% of asthma attacks in children and the worsening of chronic obstructive pulmonary disease in adults over 65 years of age could be linked to pollution.
Finally, a recent report published by Santé Publique France [8] presents the latest quantitative health impact assessment (QISA) conducted on the link between chronic exposure to fine particulate matter (PM2.5) and mortality in 2007 and 2008. This study concludes that more than 48,000 deaths per year are estimated to be due to pollution from anthropogenic particulate matter in our country. Results by region are available in the form of maps. Such studies have also been conducted to quantify the impact of pollution on the Ozone. The uncertainties of these assessments are also recalled, uncertainties upstream on the quantification of emissions and exposures of populations, on the causes of the pathologies observed (confounding factors related to lifestyles, diet, smoking, exposure in the workplace,…) and on the methodological choices used. Despite their limitations, these results have the advantage of raising awareness of the urgency of the health problem and the importance of the measures to be implemented to reduce air pollution.
3. Public information at national and European level: the Prev’air and Copernicus Atmosphere systems
As recalled in Marianne Moliner-Dubost’s article (see How does the law protect air quality?), the 1996 Air Act has profoundly modified the national organization around issues related to the air we breathe. This was the starting point for the establishment of a network of air quality monitoring agencies (AASQA). During the 2000s, this system was completed with the creation of the Prev’air system, which was oriented towards modelling.
3.1. The Prev’air system
This platform for predicting the concentrations of the main regulated pollutants is managed on a daily basis by INERIS (Institut National de l’EnviRonnement et des rIsqueS). It was developed in 2004 by the consortium integrating INERIS, Météo France, CNRS and LCSQA (Laboratoire Central de Surveillance de la Qualité de l’air). Today, this consortium continues to develop this system, which is unique in Europe.
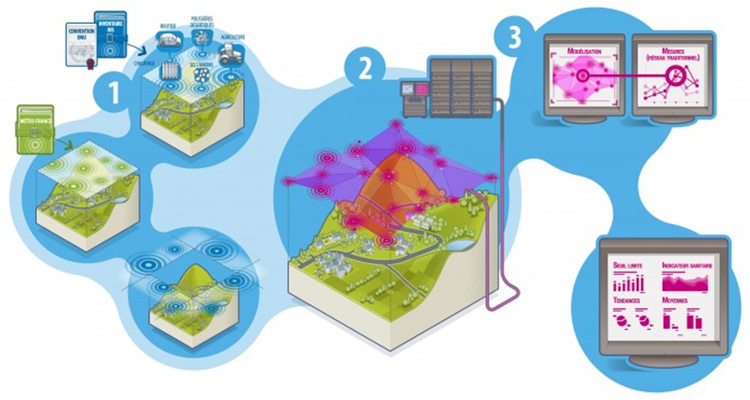
These operating models to provide predictions of pollutant concentrations require the following information:
- An emissions inventory, now static (not dependent on the weather situation) that details the spatial and temporal distribution of emissions over a period of time. These emissions include those resulting from human activity (anthropogenic emissions) but also those resulting from natural sources (vegetation, soils, etc.). These emissions files are regularly updated to take into account changes in land use and are the subject of research projects to make them dynamic and dependent on the situation (weather conditions, time of year, public holidays, etc.). In particular, we can mention the inventory developed as part of the MACC and MACCII research projects, which are precursors to the Copernicus projects.
- Weather conditions over the period considered, because as seen in the first part, the weather conditions create favourable conditions for a pollution episode and above all are a major element in the end of the events. The weather forecast will therefore impact the quality of the air quality forecast. This point largely explains the differences in the prediction of pollutant concentrations (or air quality by extension) sometimes observed between different sources of information.
- Boundary conditions, it is in fact the state of the chemical composition at the edge of the domain under consideration, these pollutants may then interact or move in the modelling domain (transport effect for example).

This system, a pioneer in Europe, is regularly reassessed [10], and is continuously evolving to take into account more chemical phenomena, to increase the resolution in the field, and to correct a bias observed in the forecast. Research work in the field of chemistry and air quality modelling is extensive and contributes to enriching this service to users. Thus, Primequal calls for projects, launched in 2005, aimed to study the links between air quality and agriculture. It should also be noted that since the launch of air quality models in 2004, the models have been enriched in terms of chemical reactions taken into account, particularly through the modelling of secondary aerosols.
3.2. Copernicus Atmosphere services on Europe
An alternative approach has been adopted at European level. The MACC (Monitoring Atmospheric Composition and Climate) research projects have made it possible to develop from 2009 onwards an unparalleled air quality monitoring and forecasting system involving a set of around ten models developed and implemented by various European teams. They brought together 35 European partners, national meteorological services and other research organizations, including Météo-France and INERIS [11]. Since 2015, part of this work has led to the establishment of operational services: the Copernicus Atmopshere services [12].
The operational implementation of these services has been delegated by the European Union to major operators. For the atmospheric monitoring component, the operator is the European Centre for Medium-Range Weather Forecasting (ECMWF/ECMMT). Under its aegis, Météo-France and INERIS coordinate air quality forecasting and analysis services in Europe and services for evaluating air quality management strategies.
Since 2015, on the website www.regional.atmosphere.copernicus.eu, 4-day forecasts of concentrations of 10 pollutants (including pollen species during the pollination seasons) are available, as well as previous day’s analyses (forecasts corrected using spot observations collected by the European Environment Agency) or annual re-analyses that make it possible to assess and monitor trends and therefore the impact of public policies. This data is offered with visualization and download services that comply with standardized data exchange protocols (including WMS/WCS services). These download services are entirely free of access and free of charge, and are intended to be used by downstream expert systems, which will enhance these outputs by providing finer resolution air quality information, cross-referencing these data with other data sources, statistical processing.
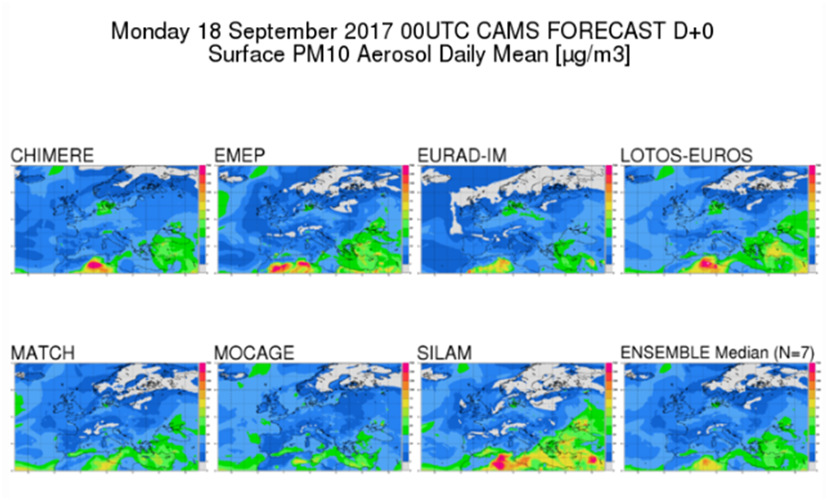
Based on the conclusions of the pioneering MACC projects, the multi-model approach has been retained, the CAMS regional forecasts are now being developed by combining the outputs of seven of the best models in Europe and all capable of providing the expected level of service. These models are produced by national meteorological services or organizations (from Finland, France, Norway, Sweden, the Netherlands and the United Kingdom) and university laboratories (such as Aarhus University/Denmark, Rhenish Institute for Environmental Research at University of Cologne/Germany, Warsaw University of Technology/Poland). The flagship forecast produced by this system is called the Ensemble, it is the median of the individual results, it thus benefits from the advantages of each of the models and allows to propose a quality forecast on Europe at a resolution of 0.1°.
The system, which complements the global system [13], is currently in the expansion phase and continues to offer new services (new pollen species, new reanalyses) as well as controlled and monitored developments at the level of the European Union, including ambitious programs to make available mass data download platforms supplemented with services. This can be done by updating emission inventories or by proposing innovative services such as a fire monitoring system based on satellite data assimilation. The latter system is intended to be taken into account in the context of regional air quality; thus, the impact of a fire outside Europe on air quality at European level can be included in the forecasts.
This European service can also be a major support in the monitoring of air quality at national level, through the interweaving of modelling systems at different geographical scales, as is now the case for the Prev’air and Copernicus Atmosphere systems. Finally, the use of “Sentinel” satellite data should also allow the implementation of new products and a significant improvement of existing products.
References and notes
Cover image. Air pollution (smog) in New Delhi. Source: Flickr – License: CC BY-NC]
[1] WHO report of November 2016 “Burden of disease from the joint effects of household and ambient air pollution for 2012″[http://www.who.int/airpollution/data/AP_jointeffect_BoD_results_Nov2016.pdf]
[2] Malardel S. (2009). Fundamentals of Meteorology, Cepadues-Editions
[3] Fuentes et al (2000). Biogenic Hydrocarbons in the Atmospheric Boundary Layer: A Review Bulletin of the American Meteorological Society 81:7, 1537-1575
[4] Auger F. (2006). Involvement of fine atmospheric particles (PM <2.5 μm) in the induction of cardiovascular diseases. In vitro study of the relationships between the epithelium of the respiratory tract and the cells of the vascular endothelium. Thesis University Paris 7.
[5] WHO (Nov 2016). Burden of disease from the joint effects of household and ambient air pollution for 2012[http://www.who.int/phe/health_topics/outdoorair/databases/AP_jointeffect_BoD_results_Nov2016.pdf?ua=1]
[6] WHO (Press release. 27 September 2016). WHO publishes national estimates of exposure to air pollution and health effects. [http://www.who.int/mediacentre/news/releases/2016/air-pollution-estimates/fr/]
[7] The Aphekom Project. Improving knowledge and communication for decision making on air pollution and heath in Europe[http://aphekom.org/web/aphekom.org/home]
[8] Santé Publique France. Impacts of chronic exposure to fine particulate matter on mortality in mainland France and analysis of health gains from several air pollution reduction scenarios
[10] Rouil L., Honore C., Vautard R., Beekmann M., Bessagnet B., Malherbe L., Meleux F., Dufour A., Elichegaray C., Flaud J-M., Menut L., Martin D, Peuch A., Peuch V-H., Poisson N., 2009, PREV’AIR : an operational forecasting and mapping system for air quality in Europe, BAMS, DOI: 10.1175/2008BAMS2390.1
[11] Marécal V., Peuch V.-H., Andersson C., Andersson S., Arteta J., Beekmann M., Benedictow A., Bergstrom R., Bessagnet B., Cansado A., Cheroux F., Colette A., Coman A., Curier R. L.,. Denier van der Gon H. A. A. C, Drouin A., Elbern H., Emili E.,. Engelen R. J.,. Eskes H. J., Foret G., Friese E., Gauss M., Giannaros C., Joly M., Jaumouillé E., Josse B., Kadygrov N., Kaiser J. W., Krajsek K., Kuenen J., Kumar U., Liora N.,. Lopez E., Malherbe L., Martinez I., Melas D., Meleux F., Menut L., Moinat P., Morales T., Parmentier J., Piacentini A., Plu M., Poupkou A., Queguiner S., Robertson L., Rouil L., Schaap M., Segers A., Sofiev M., Thomas M., Timmermans R., Valdebenito A., van Velthoven P., van Versendaal R., Vira J., and Ung A., A regional air quality forecasting system over Europe: the MACC-II daily ensemble production, Geosci. Model Dev. Discuss, 8, 2739-2806, 2015, doi:10.5194/gmdd-8-2739-2015
[13] http://atmosphere.copernicus.eu/
The Encyclopedia of the Environment by the Association des Encyclopédies de l'Environnement et de l'Énergie (www.a3e.fr), contractually linked to the University of Grenoble Alpes and Grenoble INP, and sponsored by the French Academy of Sciences.
To cite this article: GUIDOTTI Sylvie, PITHON Marion (January 5, 2025), Outdoor air pollution: keys to understand, inform and prevent, Encyclopedia of the Environment, Accessed July 25, 2026 [online ISSN 2555-0950] url : https://www.encyclopedie-environnement.org/en/air-en/outdoor-air-pollution-understanding-to-inform-and-prevent-2/.
The articles in the Encyclopedia of the Environment are made available under the terms of the Creative Commons BY-NC-SA license, which authorizes reproduction subject to: citing the source, not making commercial use of them, sharing identical initial conditions, reproducing at each reuse or distribution the mention of this Creative Commons BY-NC-SA license.