Air pollution

PDF

Air pollution is multiple and old. They have consequences not only for human health but also for the biosphere, in particular the planet’s vegetation, atmosphere and climate. Releases to the atmosphere resulting from human activities are added to naturally occurring constituents that are often of the same nature as pollutants. A historical overview of air pollution with the most famous dramatic episodes is presented. The consequences of pollution are manifested at the local level with mainly health effects, at the regional level with forest damage and transboundary pollution, at the global level with the destruction of the stratospheric ozone layer, the greenhouse effect and a contribution to global warming. As far as health effects are concerned, neither indoor air pollution nor radioactive pollution of natural or anthropogenic origin should be neglected, with for the last nuclear tests in the atmosphere and accidents related to the peaceful uses of nuclear energy. Among the many types of pollution, some are now under control, such as acid rain and stratospheric pollution.

1. Primary and secondary pollutants

compounds of anthropogenic - troposphere
Figure 1. Qualitative illustration of the main sources of compounds of anthropogenic or natural origin and their interactions in the troposphere.

Air pollution is defined in the French Law on Air and the Rational Use of Energy of 30 December 1996 (link to How does the law protect air quality?). It results from the direct release of gaseous or particulate compounds, harmful to man and the biosphere, from various human, industrial, domestic, agricultural, transport, combustion and other activities. The pollutants emitted in this way are said to be of anthropogenic origin. The biosphere also naturally produces gases and particles that are found in the atmosphere. This is the case of wind erosion, hydrocarbons emitted by vegetation, gas production from bacterial decomposition in soils and waters, sea spray often carrying detergents, etc. These sources of constituents (see Figure 1), which are often of the same nature as pollutants, are called biogenic. Human activities modify these emissions, contributing to air pollution. Thus agriculture modifies wind erosion and emissions of gases such as nitrogen oxides with the use of nitrogen fertilizers that disrupt the natural nitrogen cycle.

Pollutants introduced directly into the atmosphere, or resulting from changes in natural emissions from the biosphere, are called primary pollutants. Many of them will react chemically, especially under the influence of solar radiation, and give rise to new constituents or secondary pollutants, which are often more aggressive to the environment than those that gave birth to them. These secondary pollutants include strong acids, such as sulphuric acid and nitric acid, as well as strong oxidants such as ozone (O3). The atmosphere is thus the site of intense chemical activity, between compounds that are mostly in trace amounts. The concentrations of active constituents [1], which are often expressed by the volume mixing ratio, can be very low in the order of ppt, i.e. one pollutant volume per 1012 (or 1000 billion) air volumes. They are often in the order of ppb (part for billion, where b refers to the English word billion), or ppm (part for million).

2. A little history of air pollution

Air pollution is a very old phenomenon. It has been manifesting itself since antiquity. Seneca, 61 years before Christ, complained about the polluted air in Rome. Pollution is partly the result of human concentrations in cities and regions, accompanied by numerous burns of various materials for domestic, industrial or other use. In London, coal combustion caused air pollution problems as early as the twelfth century. In 1273, the parliament prohibited the burning of coal in the area. At the beginning of the 14th century, Edward I wanted to limit the use of coal in furnaces. In the 16th century, Queen Elizabeth I banned the use of coal at parliamentary meetings. In 1661, John Evelyn, an English writer and memorialist, published a treatise on air pollution Fumifugium, which was reissued in 1960 by the National Society for Clean Air. He advocated moving polluting industries from central London to the periphery. In the 19th century, novelist Charles Dickens described in great detail the smoke and fogs of London and other British cities. Camille Flammarion in a book on the atmosphere, published in 1872 [2], highlighted the poor air quality in Paris and its harmful effects on health (see the quotation in the focus dedicated to this author).

Encyclopédie environnement - pollution atmosphérique air - Armand Guillaumin 1841-1927 River Scene - air pollution atmosphere
Figure 2. At the beginning of the industrial era, air pollution inspired many painters, such as Claude Monet (cover image) and Armand Guillaumin (1841-1927, River Scene). Fortunately, such pollutant releases have become rare, both in industrial sites and in urban areas. [Source: Wikimedia commons]
Pollution increased from the end of the 19th century to the middle of the 20th century, with the growth of industrial production which, in the absence of binding regulations, was accompanied by an increase in emissions into the atmosphere. Many famous painters have represented industrial or urban sites with chimneys emitting plumes of pollutants, as shown in the cover image and Figure 2. Awareness of the dangers of air pollution to human health was raised in the middle of the 20th century following episodes of now famous air pollution that led to a significant increase in mortality and morbidity.

3. Some tragic episodes

From  December 1 to 5, 1930, thanks to an anticyclonic situation, a strong temperature inversion, accompanied by fog, continued for five days in the Meuse valley in eastern Belgium, near Liège. The many pollutants emitted, particularly sulphur dioxide (SO2) and particulate matter, can accumulate in the valley, which is one kilometre wide and bordered by hills about 100 metres high. Concentration levels cannot be given because there were no pollutant measurements at that time. As a result of the fog, some of the sulphur dioxide was transformed into sulphuric acid (SO4H2). Many deaths (63 compared to 6 in normal times) and several hundred patients have been reported and attributed to pollution.

In 1948, an acute episode of pollution occurred in Donora, a small industrial town in Pennsylvania (USA) located in a valley about 50 kilometres from Pittsburgh. From 27 to 31 October, pollutants from various industrial installations accumulated. About 20 deaths (2 in normal times) and several thousand patients were attributed to this event. As in the Meuse valley, the presence of an inversion layer (link to the article Mountain Winds) accompanied by a formation of fog forced polluted cold air to stagnate at the bottom of the valley, promoting the transformation of sulphur dioxide into sulphuric acid.

Among the most severe and striking episodes were those in London in the first half of the 20th century. To represent the mixture of smoke and fog, the word smog [3] had been introduced. The high pollution in the Los Angeles Basin, combined with a particular coastal breeze situation, has also contributed sign

health effects of air pollution
Figure 3. The main health effects of air pollution. The pollutants are directly inhaled. Deposited on the ground and vegetation, they pollute surface water and food, which are then ingested. The destruction of the stratospheric ozone layer reduces the barrier against UVB rays, increasing the risk of skin cancer. The increase in the concentration of greenhouse gases may increase the severity and frequency of heat waves, diseases transmitted by mosquitoes. Fear of the consequences of pollution may increase stress on populations.

ificantly to awareness of air quality degradation and its consequences on health (see Figure 3).

In addition to the chronic pollution outlined above, there are accidental pollution, with significant releases of toxic substances, which have caused many victims (Bhopal, Seveso, Chernobyl, etc.).

4. The main pollutants at the local scale

ulphur dioxide and nitrogen oxides
Figure 4. Emissions of sulphur dioxide and nitrogen oxides since 1960, and lead emissions since 1990. It can be seen that for sulphur dioxide and lead emissions have decreased significantly. This decrease is less significant for nitrogen oxides. According to the CITEPA SECTEN Air Pollutant Emissions Inventory, October 2016. [Source: www.citepa.org]
Currently the main primary pollutants that contribute to local air pollution are solid particulates (see Air pollution particles: what are they?), nitrogen oxides (NOx), hydrocarbons. The attached table gives an idea of their nature and origin: combustion or evaporation of fuels in engines of cars, light vehicles and heavy goods vehicles, space heating with combustion of wood or fuel oil, etc. Current emissions and concentrations of some compounds that were major pollutants have decreased significantly (see Figure 4). This is the case for sulphur dioxide (SO2), which came from sulphur contained in fuels (coal, fuel oil, etc.), lead, which increased the octane number in petrol, other heavy metals such as mercury released mainly by waste incinerators, and dioxins, etc. Biogenic compounds, such as pollens, spores, bacteria, etc., must be added to this list of primary pollutants.

Table of the main classes of pollutants with their physical states and sources.

5. Pollution on a regional scale: acids and oxidants

The pollution cases mentioned above occurred on a scale that can be considered local or limited in scope. Atmospheric pollution also occurs at the regional level (from about ten to several hundred or even a thousand kilometres), also known as meso-meteorological. Concentration levels are not as high as locally and the effects, mainly due to secondary pollutants, will be felt more insidiously. In the 1970s and subsequent years, forest dieback was observed in some areas in Europe and the United States. It was quickly attributed to air pollution and in particular to acidification of precipitation and surface water, as well as to an increase in the oxidative power of the air. Pollution on this scale, which knows no borders between nations, is often referred to as transboundary pollution. The high ozone concentrations observed during each summer period can be classified as this category of regional transboundary pollution.

6. Secondary pollutants

Figure 5. Diagram of atmospheric pollution. On the left are activities that release pollutants or trace constituents into the atmosphere. To these activities must be added biogenic sources such as wind erosion, sea spray, vegetation and soil emanations, etc. All these pollutants will interact in an extremely complex atmospheric chemistry. On the right are the main areas impacted by air pollution, health, the biosphere, climate, buildings. In the centre right, in green, different chapters of air pollution.

The transformation of primary pollutants into secondary pollutants can take place in the gas phase, with solar radiation playing a very important role, but also in the liquid phase in fog and clouds. A major secondary compound in atmospheric chemistry is the hydroxyl radical OH. It is sometimes called the detergent of the atmosphere. Its role was only highlighted in the early 1970s. It is formed mainly by photolysis of ozone. Its concentration is very low due to its high reactivity. It has provided an understanding of the transformation of sulphur dioxide into sulphuric acid. It regulates the concentration of compounds such as carbon monoxide (CO), methane (CH4), and other hydrocarbons. The residence time of a large number of pollutants depends on their concentration, which in turn depends on a large number of reactions. In the presence of hydrocarbons, this OH radical can give rise to compounds that are themselves highly reactive. Figure 5 summarizes all the pollution present in the lower atmosphere, between its sources and the areas affected.

7. Global pollution: the greenhouse effect, the ozone hole

global temperature - air pollution - global warming
Figure 6. Increase in the average global temperature since 1880. [Source: en.wikipedia.org]
Finally, atmospheric pollution is a phenomenon that affects the entire planet, with two main manifestations. The first is the destruction of the ozone (O3) layer in the stratosphere [4] (see The Earth’s atmosphere and gaseous envelope), accompanied by a dangerous increase for man and the biosphere of ultraviolet radiation reaching the ground (see Cellular impact of solar UV rays). The second is the increase in the concentration of certain gases with low chemical reactivity in the troposphere where they can therefore accumulate since they are emitted and not destroyed. They are transparent to solar radiation, a variable fraction of which is captured by the ground. Some of the energy received is emitted in the form of infrared radiation that is partially absorbed by these gases and therefore captured by the atmosphere, resulting in a warming of the lower layers. This phenomenon is called the greenhouse effect. The atmosphere plays a role that is compared to that of the glass or plastic wall of a gardener’s greenhouse. The greenhouse effect occurs naturally in the atmosphere, mainly due to the presence of water vapour and carbon dioxide as absorbent gases. Other constituents, such as methane, also have a significant, but lesser, influence. It is thanks to this phenomenon that we have mild temperatures on Earth. Without this effect, the average temperature at the Earth’s surface would be about 35°C lower than the one we enjoy (see The climate machine). Since the industrial era, pollution has significantly increased the intensity of this greenhouse effect, slightly but sufficiently to cause a change in the planet’s climate [5], illustrated in Figure 6. This is called the additional greenhouse effect.

In conclusion, atmospheric pollution occurs at three different scales. At the local level, it mainly, but not only, has effects on human health; at the regional level, the most dramatic effects are the acidification of surface waters and the decline of forests; and finally at the global level, with the destruction of stratospheric ozone and the increase in the greenhouse effect, it has risks of climate change and impacts on the biosphere, on sea level, but also on human health.

8. Indoor air pollution

To these three main types of pollution must be added the air quality within buildings [6]. In industrialized countries, the population spends on average about 80% of its time in workplaces and living quarters. Polluted outdoor air enters in homes, but there are also many sources of indoor pollutants [7], sometimes of the same nature as outdoor pollutants. In these rooms, air pollution can be more significant than in the atmosphere. However, situations vary greatly from one location to another, which complicates the study and effects of this type of pollution.

9. Air radioactivity and anthropogenic pollution

In addition, the outdoor atmosphere and air in buildings also contain radioactive pollutants, gases and solid particles. This radioactivity is of geological origin (read Radioactivity and nuclear reactions), it comes from rare gas emissions that belong to the radioactive families of uranium and thorium. In some areas, concentrations can be high and exceed the values allowed in uranium mines.

In the 1950s and 1960s, experimental nuclear explosions in the atmosphere by the Americans, Russians, then the British, French and Chinese introduced large quantities of products mainly from the fission of uranium 235 or plutonium. The peaceful uses of nuclear energy has also contributed to the introduction of radioactive products into the atmosphere during reactor operating accidents. The Chernobyl accident in Ukraine on April 26, 1986, is the best known, most important and most dramatic. Large areas in Europe, including France, have been affected by the cloud carrying various radionuclides, including Cesium 137 and Iodine 131 (see Pesticides: what the past teaches us). In addition, there was the more recent Fukushima accident in Japan in 2011, following an earthquake, followed by a tsunami, which resulted in the loss of the cooling system of several reactors with radioactive product releases into the atmosphere and the environment, particularly into the ocean.

10. Evolution of air quality

In the end, it can be said that air quality has improved, although there is still room for improvement, particularly on a global scale. When they are still visible, plumes from industrial and urban sites are most often visible due to water vapour condensation. This does not mean that there are no more pollutants, but effluent treatment systems can stop a large part of them. International agreements have significantly reduced the destruction of the stratospheric ozone layer and the acidification of precipitation. It is to be hoped that the same will apply to greenhouse gases. However, nitrogen oxide and particulate concentrations remain at high levels, as does the production of ozone in the lower atmosphere. The first major international action dates back to 1992 with the Rio De Janeiro conference. The commitments made at the last Paris conference in 2016 are encouraging, but concrete actions have yet to be implemented.


References and notes

Cover image. painting by Claude Monet showing the air pollution in the Paris region at the beginning of the 20th century (Le pont Saint-Lazare, Musée Marmottan)

[1] The concentration of a pollutant, whether gaseous or in the form of particles, is expressed in mass per unit volume, most often in micrograms per cubic metre (μg/m3). For gases, instead of concentration, the mixing ratio, usually by volume, is also often used, which represents the volume proportion of the pollutant in the air. It is expressed in ppmv (one part per million), ppbv (one part per billion, pptv (one part per thousand billion or 1 part per 1012). Very often v (volume) is not indicated and we talk about ppm, ppb or ppt. A mixing ratio of 1 ppm means that per million air molecules there is one molecule of the pollutant.

[2] Camille Flammarion, L’atmosphère, Librairie Hachette, 1872.

[3] This English neologism smog is what linguists call a suitcase word. It is a fused form of the words smoke and fog.

[4] Stratospheric ozone results from the photodissociation of oxygen by short-wave ultraviolet solar radiation. This exothermic chemical reaction explains the warming of the air in this region above the troposphere, between altitudes of 20 to 70 km.

[5] The global average temperature includes a large number of observations distributed over the surface of continents and oceans. Its global average value for continental and ocean surfaces was higher than the 20th century average (13.9°C) by 0.94°C in 2016, 0.90°C in 2015, 0.74°C in 2014. (www.ncdc.noaa.gouv/sotc/global/201613).

[6] Luc Mosquerons and Vincent Nedellec. Indoor Air Quality Observatory. Inventory of French data on indoor air quality in buildings. http://www.oqai.fr/userdata/documents/Document_16.pdf

[7] YEARS – Indoor Air Quality. ,https://www.anses.fr/fr/content/qualité-de-l’Indoor Air


The Encyclopedia of the Environment by the Association des Encyclopédies de l'Environnement et de l'Énergie (www.a3e.fr), contractually linked to the University of Grenoble Alpes and Grenoble INP, and sponsored by the French Academy of Sciences.

To cite this article: FONTAN Jacques (July 3, 2019), Air pollution, Encyclopedia of the Environment, Accessed July 27, 2024 [online ISSN 2555-0950] url : https://www.encyclopedie-environnement.org/en/air-en/air-pollution/.

The articles in the Encyclopedia of the Environment are made available under the terms of the Creative Commons BY-NC-SA license, which authorizes reproduction subject to: citing the source, not making commercial use of them, sharing identical initial conditions, reproducing at each reuse or distribution the mention of this Creative Commons BY-NC-SA license.

空气污染

PDF

  空气污染类型多样且历史久远,不仅会影响人类健康,还会影响生物圈,特别是会影响地球的植被、大气和气候。空气污染源包括自然产生的污染物,以及具有相同性质的人类活动释放到大气中的污染物。本文概述了空气污染的历史,其中包括一些著名的污染事件。在局地尺度污染的影响主要表现为健康影响,在区域尺度表现为森林锐减和跨界污染,在全球尺度表现为平流层臭氧层的破坏、温室效应和全球变暖。就对健康的影响而言,室内空气污染、自然或人为造成的放射性污染(如最后一次大气层核试验与和平利用核能有关的事故)都不应被忽视。在众多污染类型中,有些空气污染已经得到了基本的控制,如酸雨和平流层污染。

1. 一次污染物和二次污染物

环境百科全书-空气污染-生物圈气体和颗粒物
图1. 对流层中人为或自然来源化合物的主要来源及其相互作用的定性说明。(Stratosphere平流层,Particles颗粒物,Composition of the atmosphere大气成分,Chemistry of the troposphere对流层中的化学物质,Thunderstorms雷,Troposphere对流层,Boundary layer边界层,Organochlorines有机氯)

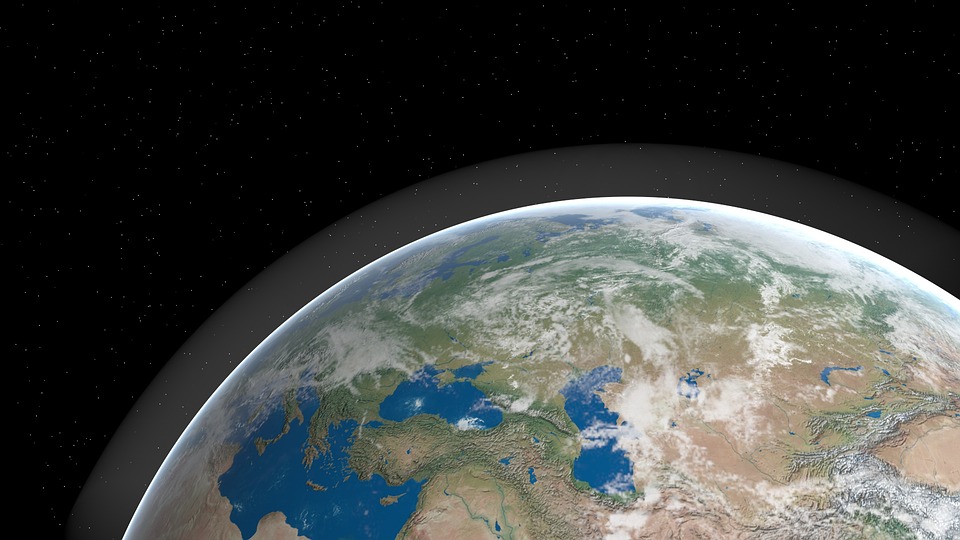
  1996年12月30日的《法国空气和合理使用能源法》对空气污染做出了定义(详情参考法律如何保护空气质量?)。直接由人类活动、工业、生活、农业、交通运输和燃烧等活动引起的。通过以上方式释放的污染物称为人为污染物。此外,生物圈也会自发地向大气释放气体和颗粒物,如风蚀过程会生成颗粒物、植物会释放碳氢化合物、土壤和水体中细菌的分解会产生气体,携带清洁剂的海水会释放浪沫,这些要素的成分(见图1)与污染物具有相同的性质,被称为生物污染物。人类活动改变了污染物的释放形式,导致了空气污染。如农业上人们利用氮肥,改变风蚀和氮氧化物等气体的释放过程,破坏了大自然的氮循环。

  直接从污染源排放至大气的,或由生物圈自然释放过程变化所引起的污染物,被称为一次污染物。许多一次污染物会发生化学反应——特别是在太阳辐射的影响下,生成新的成分或二次污染物。二次污染物通常比一次污染物更具有环境危害性。二次污染物包括强酸,如硫酸和硝酸,以及臭氧(O3)等强氧化剂。因此,大气是强烈化学活动发生的场所,参与反应的化合物大多是微量的。大气中活性成分的浓度[1]通常用体积混合比来表示,体积混合比可以很小,如 ppt级,即每1012(或1万亿)空气体积中有一个污染物体积。通常是ppb(十亿分之一,b指英语单词billion)或ppm(百万分之一)级。

2. 空气污染简史

  空气污染是一个非常古老的现象,在古代即有所显现。早在公元前61年,塞内加就曾抱怨罗马的空气污染。造成污染的部分原因是城市和地区人口的聚集,伴随着用于家庭、工业或其他用途的各种材料大量燃烧。在伦敦,煤炭燃烧早在12世纪就造成了空气污染问题。1273年,议会禁止在该地区燃烧煤炭。14世纪初,爱德华一世想要限制燃煤的使用。16世纪,伊丽莎白一世女王禁止在议会会议上使用煤炭。1661年,英国作家兼回忆录作者约翰·伊夫林(John Evelyn)发表了一篇关于空气污染的论文《驱逐烟气》(Fumifugium),该论文于1960年由国家清洁空气协会重新发布。他主张把污染工业从伦敦市中心移到周边地区。19世纪,小说家查尔斯·狄更斯(Charles Dickens)对伦敦和其他英国城市的烟雾进行了详尽的描述。卡米尔·弗拉马里昂(Camille Flammarion)在1872年出版的有关大气的书[2]中,强调巴黎糟糕的空气质量及其对健康的有害影响(请参阅献给这位作者的焦点中的引文)。

环境百科全书-空气污染-工业时期空气污染
图2. 在工业时代初期,空气污染激发了许多画家的灵感,比如克劳德·莫奈(Claude Monet)(封面照片)和阿曼德·纪尧敏(Armand Guillaumin)(1841-1927,《河景》)。幸运的是,在工业场所和城市地区这样的污染物排放已经很少见了。(来源:维基共享)

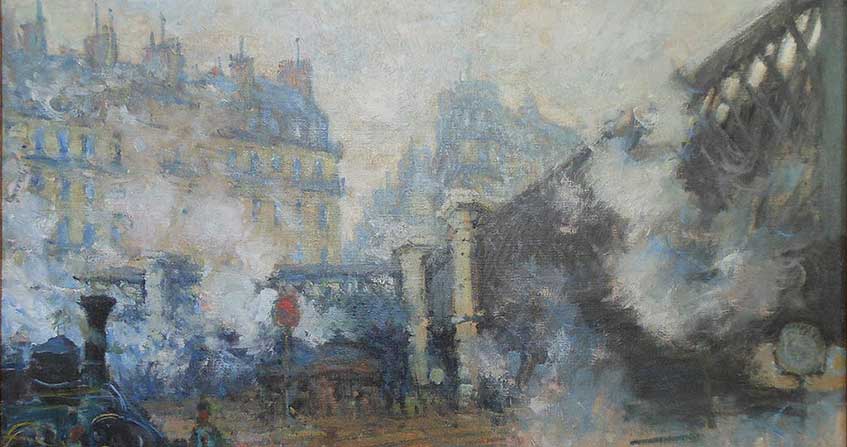
  从19世纪末到20世纪中叶,污染随着工业生产的增长而增加,在缺乏约束性法规的情况下,排放到大气中的气体也随之增加。许多著名的画家都用排放污染物的烟囱来代表工业或城市场所,如封面图片和图2所示20世纪中叶,空气污染事件显著提高了死亡率和发病率,人们开始意识到空气污染对人类健康的危害。

3. 若干严重污染事件

  1930年12月1日至5日,由于反气旋现象,在比利时东部列日市(Liège)附近的马斯河谷出现了一次强烈的逆温,伴随大雾持续了5天之久。排放的众多污染物,特别是二氧化硫(SO2)和颗粒物,在宽1公里,深100米的山谷中积聚。当时没有污染物检测,因此浓度水平不明。最终,大雾导致一些二氧化硫转化为硫酸。据报道,该污染事件造成了多人死亡(共计63人,正常情况下为6人),数百人中毒。

  1948年,位于美国宾夕法尼亚州,离匹兹堡约50公里的山谷中的工业小镇多诺拉(Donora)发生了一起严重的污染事件。10月27日至31日,来自各种工业设施的污染物累积。该事件导致20人死亡(正常情况下为2人)和数千人中毒。如同马斯河谷事件,逆温层的存在伴随着雾的形成(详情参考《山风》),迫使受污染的冷空气滞留在山谷底部,促使二氧化硫转化为硫酸。

环境百科全书-空气污染-对健康的影响
图3. 空气污染对健康的主要影响。污染物被人直接吸入。它们沉积在地面和植被上,污染地表水和食物,然后被摄入。平流层臭氧层的破坏降低了对紫外线的屏障,增加了患皮肤癌的风险。温室气体浓度的增加可能会增加热浪的危害和频率,增多蚊子传播的疾病。对污染后果的恐惧可能会增加人们的压力。(Destruction of the ozone layer臭氧层的破坏UVB紫外线,Heat waves热浪,Vectorized illnesses虫媒传染病,Stress压力,Ingestion摄取,Acid rains酸雨,Inhalation吸入,Decay of forests森林的腐烂,Pollutants污染物,Pollution of soils and plants土壤和植物的污染)

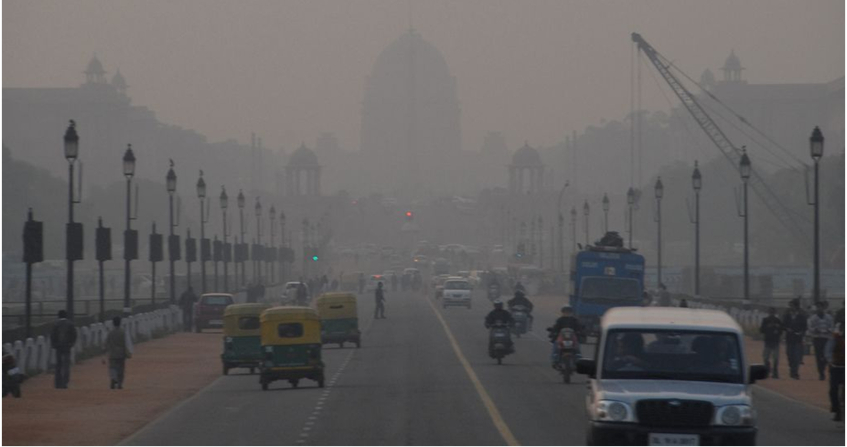
  其中最严重和最引人注目的事件发生在20世纪上半叶的伦敦。为了表示烟和雾的混合物,引入了烟雾[3]这个词。洛杉矶盆地的高污染,加上沿海地区常伴海风,极大地提高了人们对空气质量下降及空气污染对健康影响的认识(见图3)。

  除了上述慢性污染之外,还有意外污染,大量释放有毒物质,造成多人受害(博帕尔毒气泄漏事件、塞韦索污染事件、切尔诺贝利事件等)。

4. 局部地区的主要污染物

环境百科全书-空气污染-污染物排放量和浓度
图4. 自1960年以来的二氧化硫和氮氧化物排放,以及自1990年以来的铅排放。图表显示,二氧化硫和铅的排放量显著减少。氮氧化物排放量的减少不太明显。以上信息源自2016年10月空气污染物排放清单。[来源:www.citepa.org](Kilotons for SO2 and NOx:二氧化硫,氮氧化物按千吨计;Tons for lead:铅按吨)

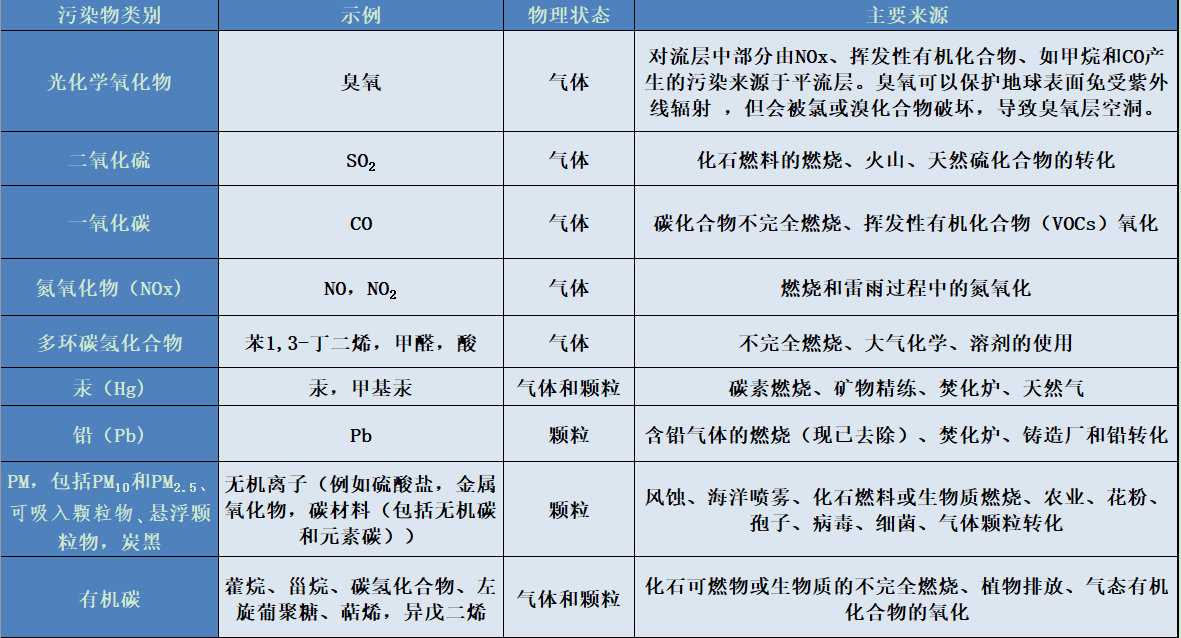
  当前,导致局部地区空气污染主要的一次污染物是固体颗粒(详情参考空气污染颗粒究竟是什么?)氮氧化物(NOx)和碳氢化合物。附表给出了它们的性质、来源:汽车、轻型车辆和重型货车发动机中燃料的燃烧或蒸发,燃烧木材或燃料取暖等。

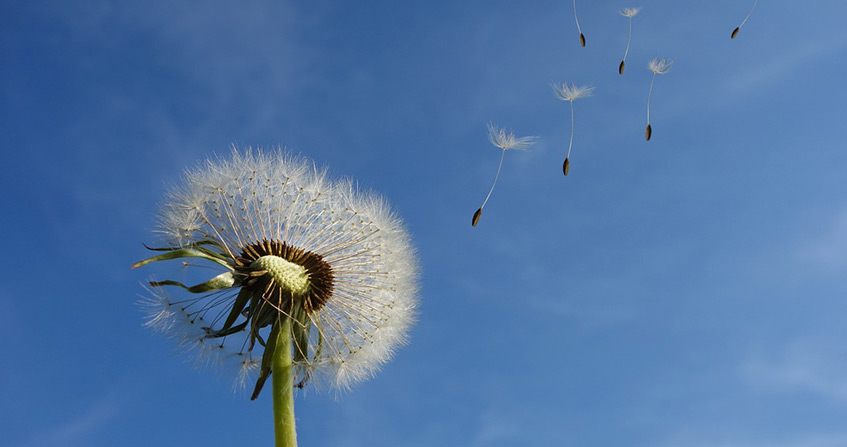
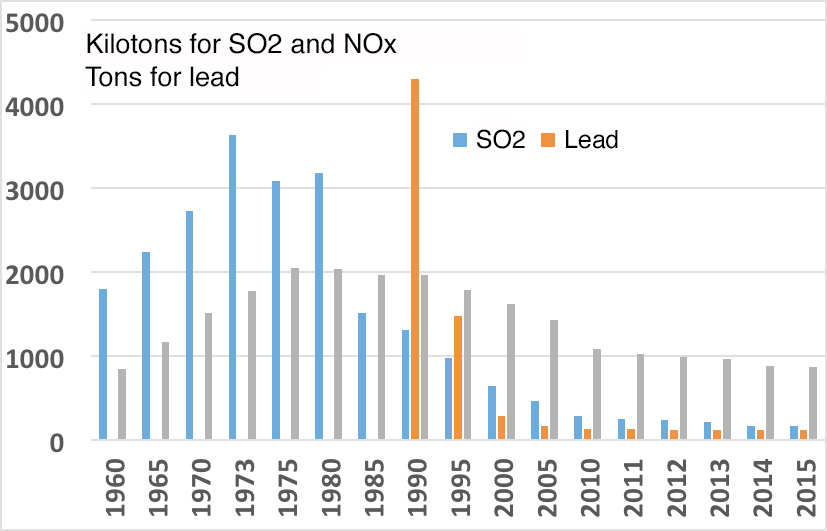
  目前一些主要污染物的排放量和浓度已经显著下降(见图4)。如二氧化硫(SO2)就是这种情况,它来自燃料(煤、燃料油等)中所含的硫、铅,用于增加汽油的辛烷值,及其他重金属,如主要由废物焚烧炉释放的汞和二恶英等。此外,生物源化合物,如花粉、孢子、细菌等,必须列入一次污染物列表中。

主要污染物类别及其物理状态和来源表

环境百科全书-空气污染-表

5. 区域性污染:酸和氧化剂

  上述污染事件发生在局地区域或较小的范围,规模和影响范围有限。大气污染也发生在区域层面(从十几公里到几百公里甚至一千公里),被称为中尺度气象。浓度水平不如局地高,且由于是二次污染物导致,产生的影响会更隐蔽。在1970年代及随后的几年中,在欧洲和美国的某些地区发现了森林梢枯病。空气污染,特别是降水和地下水的酸化,以及空气氧化能力的提高被认为是导致该病发生的原因。这种污染不分国界,通常被称为跨界污染。每年夏季监测到的高浓度臭氧可归类为此类区域跨界污染。

6. 二次污染物

环境百科全书-空气污染-大气污染图
图5. 大气污染图。左边是向大气中释放污染物或微量成分的活动。除了这些活动之外,还必须添加生物污染源,例如风蚀、海沫、植被和土壤散发物等。所有这些污染物将在复杂的大气中相互作用。右边是受空气污染影响的主要领域:健康、生物圈、气候和建筑。右边绿色一列是空气污染的不同种类。(Domestic life家庭生活,transportation交通,industry工业,agriculture农业,biogenic sources生物资源,atmospheric chemistry大气化学,atmospheric pollution大气污染,acid rain酸雨,photooxidation光氧化剂,greenhouse effect温室效应,stratospheric ozone平流层臭氧,urban pollution城市污染,industrial plants工业厂房,accidental releases意外释放,biosphere生物圈,climate气候,health健康,buildings建筑物)

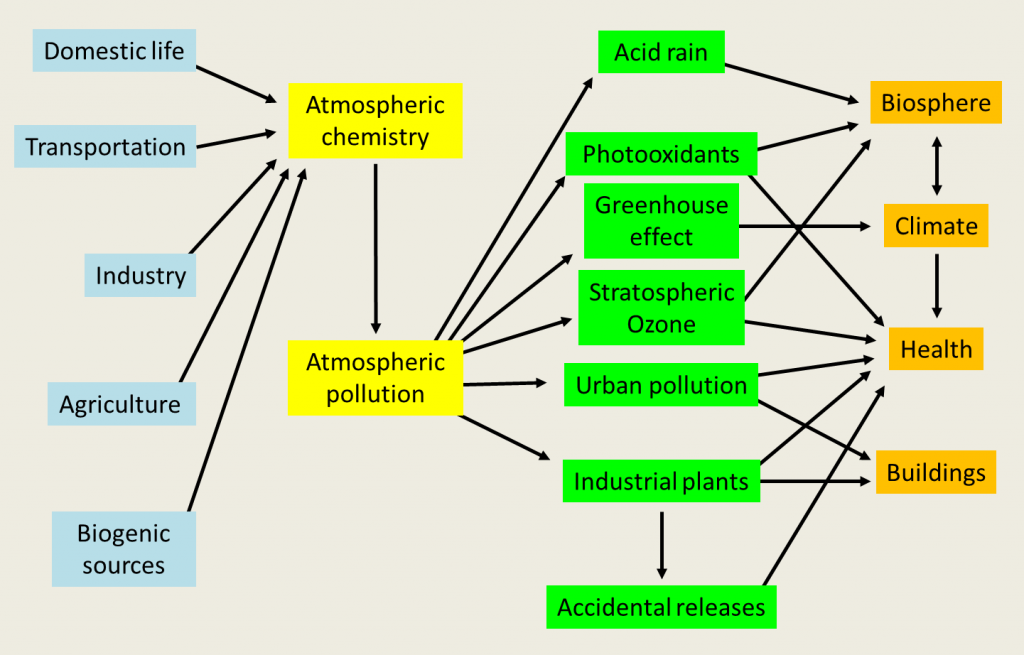
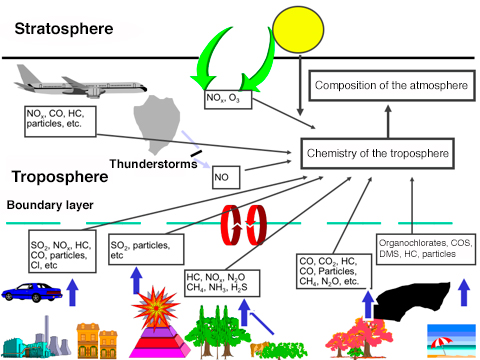
  一次污染物向二次污染物的转化可以发生在气相中,其中太阳辐射起非常重要的作用,这种转化也可以发生在雾和云中的液相中。大气化学中主要的二次化合物是羟基自由基OH,有时被称为大气清洁剂。直到1970年代初,羟基自由基才引起人们的重视。羟基自由基主要是臭氧光解形成的。由于其反应活性较高,大气中羟基自由基的浓度非常低。它能将二氧化硫转化为硫酸,也可以调节一氧化碳(CO)、甲烷)CH4)和其他碳氢化合物等化合物的浓度。污染物在大气中的停留时间取决于它们浓度,而浓度又取决于反应。在碳氢化合物存在的情况下,羟基自由基会产生比自身更具有活性的化合物。图5总结了低层大气中从污染源到受污染地区范围内的所有污染。

7. 全球污染:温室效应,臭氧层空洞

环境百科全书-空气污染-
图6. 自1880年以来全球平均气温的上升图[来源:en.wikipedia.org](International index for ground-ocean temperature:国际地表海洋温度指数,Annual average:年平均值,Smoothed curve over 5 years:五年平滑曲线,Temperature anomaly:温度异常)

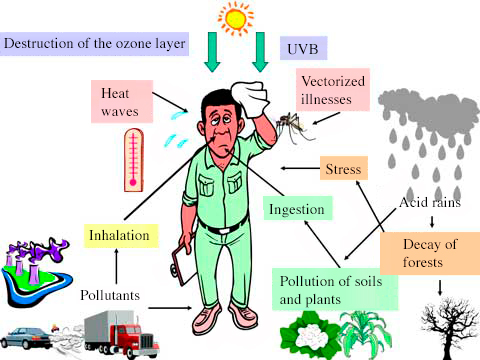
  大气污染会影响整个地球,主要表现在两个方面。其一是平流层臭氧(O3)层的破坏[4](详情参考地球的大气层和气体层),会增加到达地表的紫外辐射光对人类和生物圈的危害(详情参考太阳光中的紫外线对细胞的影响)。其二是被排放到大气中的有些低活性气体会在对流层中不断积累导致浓度升高。太阳辐射可以穿透这些气体,一小部分被地表吸收。吸收的部分能量以红外辐射的形式释放出来,部分被这些气体吸收,能量被大气捕获从而导致低层大气变暖,这种现象被称为温室效应。大气起着跟温室的玻璃或塑料墙一样的作用。大气中水蒸气和二氧化碳等吸热气体的存在,使得温室效应在大气中自然而然地发生。大气中甲烷等其他成分,对温室效应也起到了显著的影响,不过影响力不及水蒸气和二氧化碳。正是因为温室效应地球才有了温和的温度。如果没有温室效应,地球表面的平均温度将比我们目前的温度低35摄氏度左右(详情参考气候机器)。自工业时代以来,污染已经显著增加了温室效应的强度,虽轻微但足以引起地球气候[5]变化,如图6所示。这被称为额外的温室效应。

  综上所述,大气污染有三个不同的尺度。在局地尺度,它主要影响人类健康,却又不仅局限于此;在区域尺度,它造成的显著危害是地表水的酸化和森林的锐减;在全球尺度,随着平流层臭氧层的破坏和温室效应的加剧,大气污染会导致气候变化,对生物圈、海平面和人类健康都有影响。

8. 室内空气污染

  除这三种主要污染类型外,还有室内空气污染[6]。在工业化国家,人们平均80%的时间待在工作场所和生活场所。污染的空气会进入室内,室内还有很多其他污染源[7],有些室内污染物具有跟室外污染物相同的性质。室内空气污染可能比室外大气污染更严重。然而,不同环境差异很大,因此研究室内空气污染及其影响较为复杂。

9. 空气放射性和人为污染

  此外,室外大气和室内空气均含有放射性污染物、气体和固体颗粒。这种放射性污染物是地质来源(详情参考放射性与核反应),它来自于属于铀和钍放射性家族的稀有气体排放。在某些地区,放射性污染的浓度可能很高,超过铀矿允许的浓度值。

  在二十世纪五六十年代,美国、俄罗斯、英国、法国和中国在大气层中进行的实验性核爆炸,向大气排放了大量主要来自铀235或钚裂变的物质。核能和平利用时发生的反应堆事故也能向大气释放放射性物质。1986年4月26日发生在乌克兰的切尔诺贝利事故是最悲惨、最典型的。包括法国在内的欧洲大部分地区的大气层中弥漫着各种放射性物质,其中包括铯137和碘131(详情参考农药:历史给我们的教训)。此外,2011年日本发生了地震,继而引发海啸。该地震导致福岛核事故,导致几个反应堆的冷却系统失灵,放射性物质释放到大气及周边环境中,特别是海洋中。

10. 空气质量演变

  目前全球范围内环境质量已经有所改善,但仍有很大的提升空间。由于水蒸气的凝结,工业和城市的烟羽仍然可见。这并不意味着没有更多的污染物,然而污染物处理系统可以去除其中的大部分。国际协定大大减少了对平流层臭氧层的破坏和降水的酸化。希望它同样能减少温室气体的排放。然而,大气中氮氧化物、颗粒物浓度很高,与底层大气中臭氧浓度一个水平。第一个主要的国际行动是1992年的里约热内卢会议。2016年巴黎会议作出很多鼓舞人心的承诺,但尚未落实。


参考文献及说明

封面图片:克劳德·莫奈的一幅画,描绘了20世纪初巴黎的空气污染。(圣拉扎尔桥,玛摩丹美术馆)

[1] 无论是气体污染物还是颗粒污染物,其浓度都是以每单位体积的质量来表示的,通常以微克每立方米来表示(μg/m3)。对于气体,则并不使用浓度表示,而是也经常使用混合比,通常是体积比,代表空气中污染物的体积比例。用ppmv(百万分之一)或者ppbv(十亿分之一,ppt(十亿分之一或1012分之一))表示。很多时候不用v(体积)表示,用ppm,ppb或ppt。1 ppm的混合比意味着每百万个空气分子中有一个污染物分子。

[2] Camille Flammarion, L’atmosphère, Librairie Hachette, 1872.

[3] 这个英语新词“smog”就是语言学家所说的“手提箱词”。它由“smoke”和“fog”这两个词的合并而成。

[4] 平流层臭氧是由短波紫外线太阳辐射引起的氧气光解产生的。这种放热化学反应能解释对流层上方 20 至 70 公里高度之间的空气变暖现象。

[5] 全球平均温度包括大陆和海洋表面温度的大量观测值。2016年全球大陆和海洋表面平均值温度比20世纪高0.94°C,2015年高0.90°C,2014年高0.74°C(www.ncdc.noaa.gouv/sotc/global/201613)。

[6] Luc Mosquerons and Vincent Nedellec. Indoor Air Quality Observatory. Inventory of French data on indoor air quality in buildings. http://www.oqai.fr/userdata/documents/Document_16.pdf

[7] YEARS – Indoor Air Quality. https://www.anses.fr/fr/content/qualité-de-l’Indoor Air


The Encyclopedia of the Environment by the Association des Encyclopédies de l'Environnement et de l'Énergie (www.a3e.fr), contractually linked to the University of Grenoble Alpes and Grenoble INP, and sponsored by the French Academy of Sciences.

To cite this article: FONTAN Jacques (March 5, 2024), 空气污染, Encyclopedia of the Environment, Accessed July 27, 2024 [online ISSN 2555-0950] url : https://www.encyclopedie-environnement.org/zh/air-zh/air-pollution/.

The articles in the Encyclopedia of the Environment are made available under the terms of the Creative Commons BY-NC-SA license, which authorizes reproduction subject to: citing the source, not making commercial use of them, sharing identical initial conditions, reproducing at each reuse or distribution the mention of this Creative Commons BY-NC-SA license.