Air pollution
PDF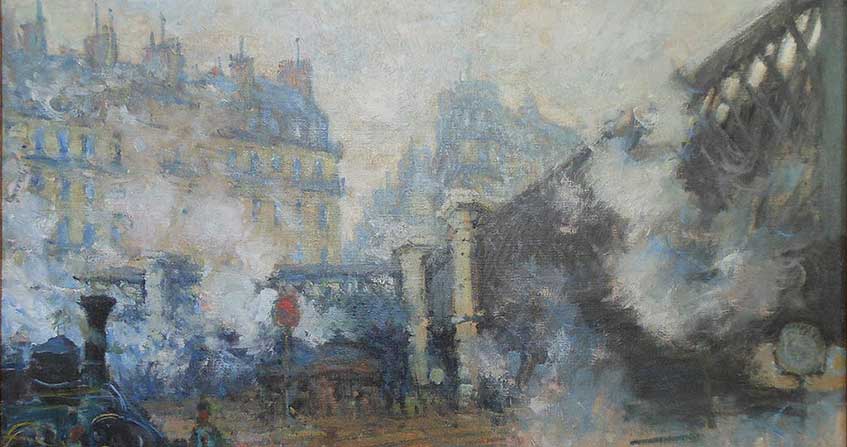
Air pollution is multiple and old. They have consequences not only for human health but also for the biosphere, in particular the planet’s vegetation, atmosphere and climate. Releases to the atmosphere resulting from human activities are added to naturally occurring constituents that are often of the same nature as pollutants. A historical overview of air pollution with the most famous dramatic episodes is presented. The consequences of pollution are manifested at the local level with mainly health effects, at the regional level with forest damage and transboundary pollution, at the global level with the destruction of the stratospheric ozone layer, the greenhouse effect and a contribution to global warming. As far as health effects are concerned, neither indoor air pollution nor radioactive pollution of natural or anthropogenic origin should be neglected, with for the last nuclear tests in the atmosphere and accidents related to the peaceful uses of nuclear energy. Among the many types of pollution, some are now under control, such as acid rain and stratospheric pollution.
- 1. Primary and secondary pollutants
- 2. A little history of air pollution
- 3. Some tragic episodes
- 4. The main pollutants at the local scale
- 5. Pollution on a regional scale: acids and oxidants
- 6. Secondary pollutants
- 7. Global pollution: the greenhouse effect, the ozone hole
- 8. Indoor air pollution
- 9. Air radioactivity and anthropogenic pollution
- 10. Evolution of air quality
1. Primary and secondary pollutants
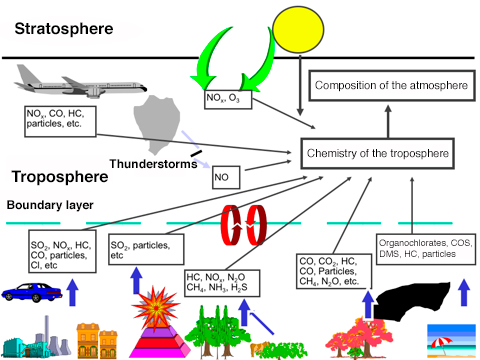
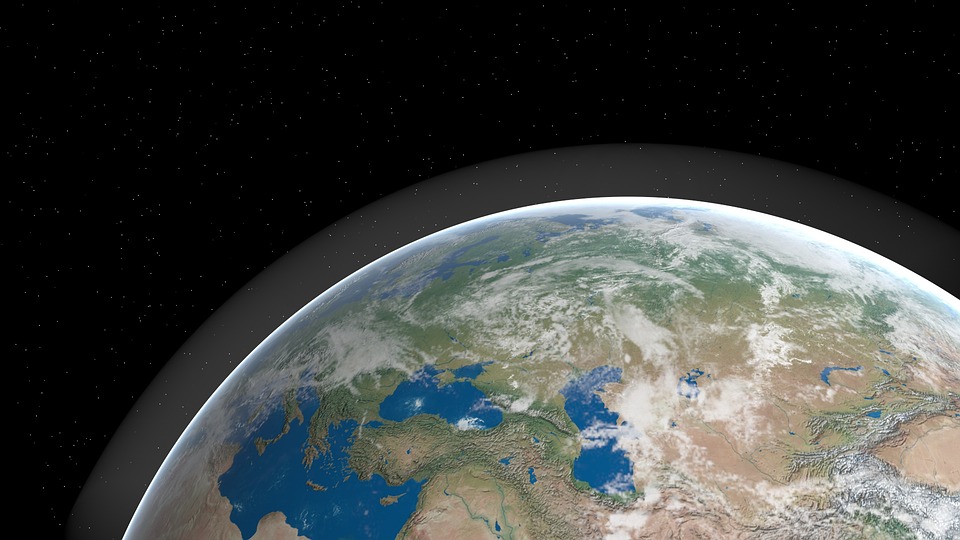
Air pollution is defined in the French Law on Air and the Rational Use of Energy of 30 December 1996 (link to How does the law protect air quality?). It results from the direct release of gaseous or particulate compounds, harmful to man and the biosphere, from various human, industrial, domestic, agricultural, transport, combustion and other activities. The pollutants emitted in this way are said to be of anthropogenic origin. The biosphere also naturally produces gases and particles that are found in the atmosphere. This is the case of wind erosion, hydrocarbons emitted by vegetation, gas production from bacterial decomposition in soils and waters, sea spray often carrying detergents, etc. These sources of constituents (see Figure 1), which are often of the same nature as pollutants, are called biogenic. Human activities modify these emissions, contributing to air pollution. Thus agriculture modifies wind erosion and emissions of gases such as nitrogen oxides with the use of nitrogen fertilizers that disrupt the natural nitrogen cycle.
Pollutants introduced directly into the atmosphere, or resulting from changes in natural emissions from the biosphere, are called primary pollutants. Many of them will react chemically, especially under the influence of solar radiation, and give rise to new constituents or secondary pollutants, which are often more aggressive to the environment than those that gave birth to them. These secondary pollutants include strong acids, such as sulphuric acid and nitric acid, as well as strong oxidants such as ozone (O3). The atmosphere is thus the site of intense chemical activity, between compounds that are mostly in trace amounts. The concentrations of active constituents [1], which are often expressed by the volume mixing ratio, can be very low in the order of ppt, i.e. one pollutant volume per 1012 (or 1000 billion) air volumes. They are often in the order of ppb (part for billion, where b refers to the English word billion), or ppm (part for million).
2. A little history of air pollution
Air pollution is a very old phenomenon. It has been manifesting itself since antiquity. Seneca, 61 years before Christ, complained about the polluted air in Rome. Pollution is partly the result of human concentrations in cities and regions, accompanied by numerous burns of various materials for domestic, industrial or other use. In London, coal combustion caused air pollution problems as early as the twelfth century. In 1273, the parliament prohibited the burning of coal in the area. At the beginning of the 14th century, Edward I wanted to limit the use of coal in furnaces. In the 16th century, Queen Elizabeth I banned the use of coal at parliamentary meetings. In 1661, John Evelyn, an English writer and memorialist, published a treatise on air pollution Fumifugium, which was reissued in 1960 by the National Society for Clean Air. He advocated moving polluting industries from central London to the periphery. In the 19th century, novelist Charles Dickens described in great detail the smoke and fogs of London and other British cities. Camille Flammarion in a book on the atmosphere, published in 1872 [2], highlighted the poor air quality in Paris and its harmful effects on health (see the quotation in the focus dedicated to this author).
3. Some tragic episodes
From December 1 to 5, 1930, thanks to an anticyclonic situation, a strong temperature inversion, accompanied by fog, continued for five days in the Meuse valley in eastern Belgium, near Liège. The many pollutants emitted, particularly sulphur dioxide (SO2) and particulate matter, can accumulate in the valley, which is one kilometre wide and bordered by hills about 100 metres high. Concentration levels cannot be given because there were no pollutant measurements at that time. As a result of the fog, some of the sulphur dioxide was transformed into sulphuric acid (SO4H2). Many deaths (63 compared to 6 in normal times) and several hundred patients have been reported and attributed to pollution.
In 1948, an acute episode of pollution occurred in Donora, a small industrial town in Pennsylvania (USA) located in a valley about 50 kilometres from Pittsburgh. From 27 to 31 October, pollutants from various industrial installations accumulated. About 20 deaths (2 in normal times) and several thousand patients were attributed to this event. As in the Meuse valley, the presence of an inversion layer (link to the article Mountain Winds) accompanied by a formation of fog forced polluted cold air to stagnate at the bottom of the valley, promoting the transformation of sulphur dioxide into sulphuric acid.
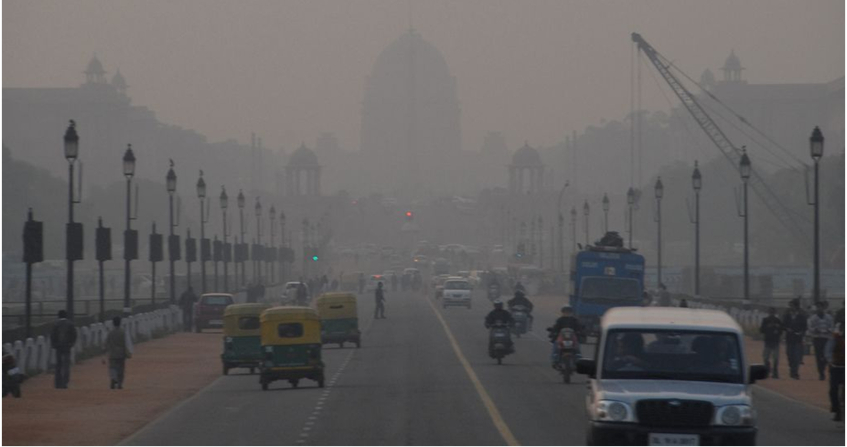
Among the most severe and striking episodes were those in London in the first half of the 20th century. To represent the mixture of smoke and fog, the word smog [3] had been introduced. The high pollution in the Los Angeles Basin, combined with a particular coastal breeze situation, has also contributed sign
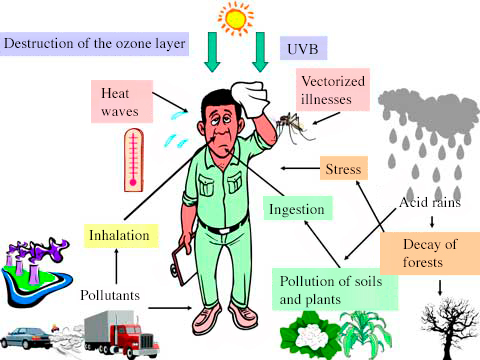
ificantly to awareness of air quality degradation and its consequences on health (see Figure 3).
In addition to the chronic pollution outlined above, there are accidental pollution, with significant releases of toxic substances, which have caused many victims (Bhopal, Seveso, Chernobyl, etc.).
4. The main pollutants at the local scale
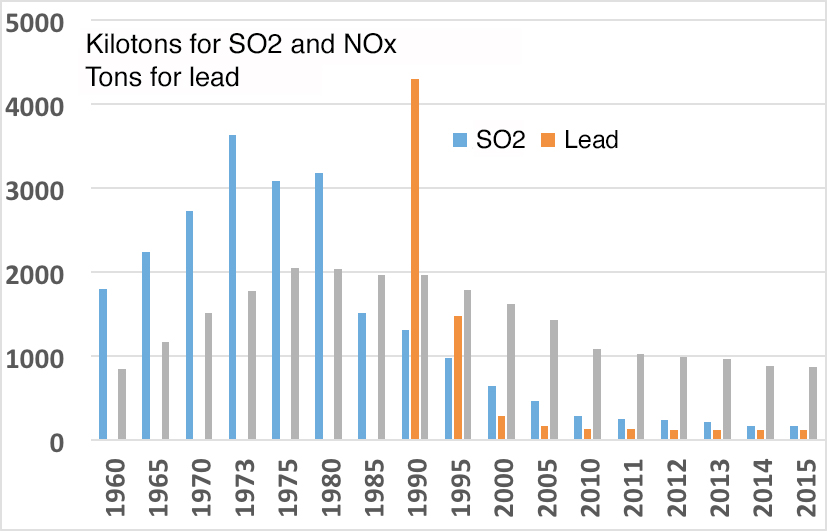
Table of the main classes of pollutants with their physical states and sources.

5. Pollution on a regional scale: acids and oxidants
The pollution cases mentioned above occurred on a scale that can be considered local or limited in scope. Atmospheric pollution also occurs at the regional level (from about ten to several hundred or even a thousand kilometres), also known as meso-meteorological. Concentration levels are not as high as locally and the effects, mainly due to secondary pollutants, will be felt more insidiously. In the 1970s and subsequent years, forest dieback was observed in some areas in Europe and the United States. It was quickly attributed to air pollution and in particular to acidification of precipitation and surface water, as well as to an increase in the oxidative power of the air. Pollution on this scale, which knows no borders between nations, is often referred to as transboundary pollution. The high ozone concentrations observed during each summer period can be classified as this category of regional transboundary pollution.
6. Secondary pollutants
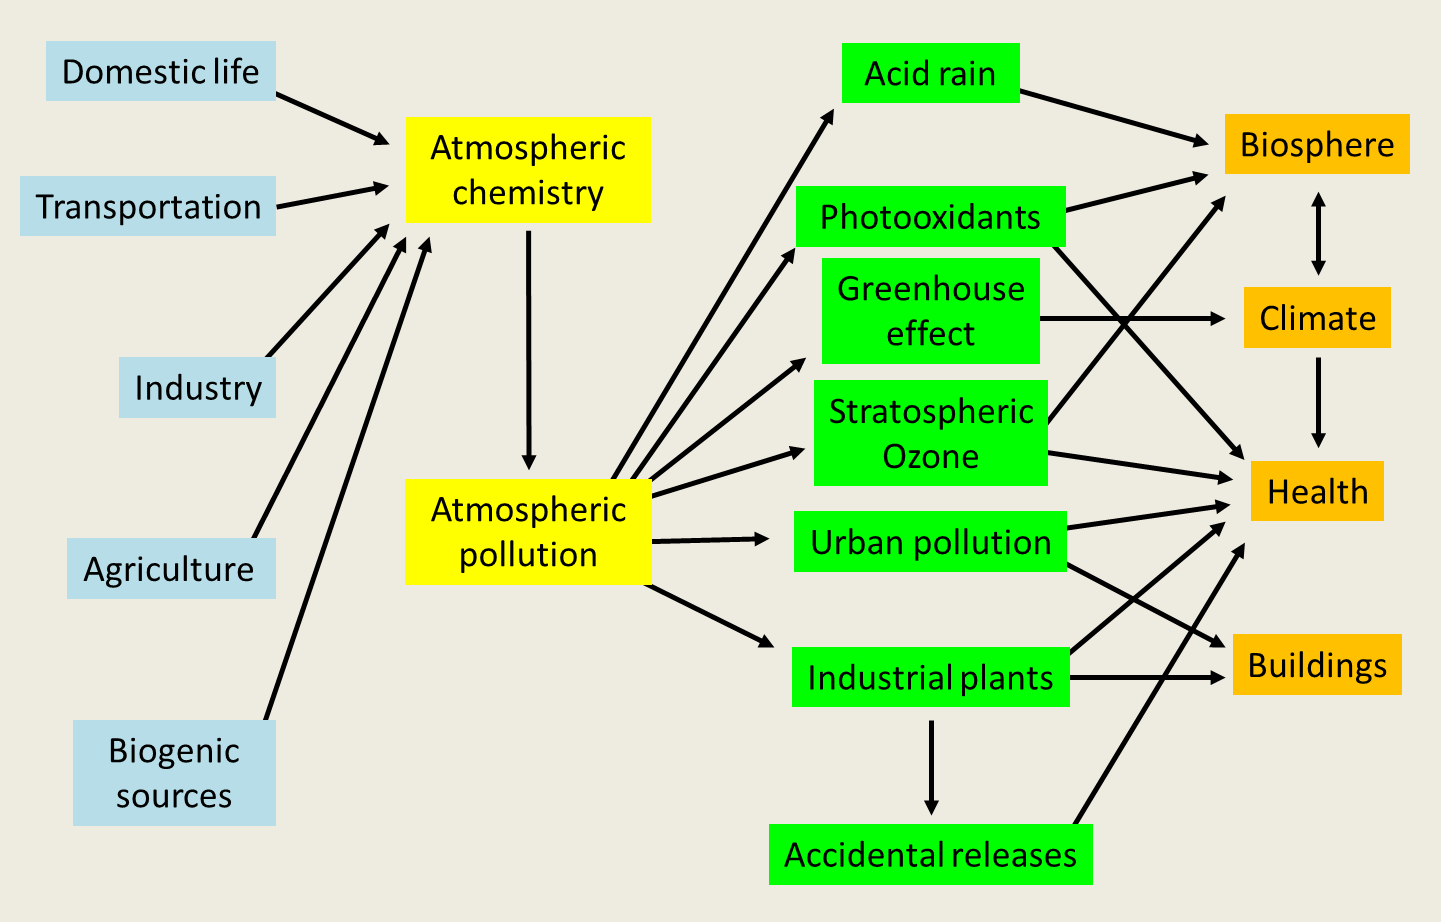
The transformation of primary pollutants into secondary pollutants can take place in the gas phase, with solar radiation playing a very important role, but also in the liquid phase in fog and clouds. A major secondary compound in atmospheric chemistry is the hydroxyl radical OH. It is sometimes called the detergent of the atmosphere. Its role was only highlighted in the early 1970s. It is formed mainly by photolysis of ozone. Its concentration is very low due to its high reactivity. It has provided an understanding of the transformation of sulphur dioxide into sulphuric acid. It regulates the concentration of compounds such as carbon monoxide (CO), methane (CH4), and other hydrocarbons. The residence time of a large number of pollutants depends on their concentration, which in turn depends on a large number of reactions. In the presence of hydrocarbons, this OH radical can give rise to compounds that are themselves highly reactive. Figure 5 summarizes all the pollution present in the lower atmosphere, between its sources and the areas affected.
7. Global pollution: the greenhouse effect, the ozone hole

In conclusion, atmospheric pollution occurs at three different scales. At the local level, it mainly, but not only, has effects on human health; at the regional level, the most dramatic effects are the acidification of surface waters and the decline of forests; and finally at the global level, with the destruction of stratospheric ozone and the increase in the greenhouse effect, it has risks of climate change and impacts on the biosphere, on sea level, but also on human health.
8. Indoor air pollution
To these three main types of pollution must be added the air quality within buildings [6]. In industrialized countries, the population spends on average about 80% of its time in workplaces and living quarters. Polluted outdoor air enters in homes, but there are also many sources of indoor pollutants [7], sometimes of the same nature as outdoor pollutants. In these rooms, air pollution can be more significant than in the atmosphere. However, situations vary greatly from one location to another, which complicates the study and effects of this type of pollution.
9. Air radioactivity and anthropogenic pollution
In addition, the outdoor atmosphere and air in buildings also contain radioactive pollutants, gases and solid particles. This radioactivity is of geological origin (read Radioactivity and nuclear reactions), it comes from rare gas emissions that belong to the radioactive families of uranium and thorium. In some areas, concentrations can be high and exceed the values allowed in uranium mines.
In the 1950s and 1960s, experimental nuclear explosions in the atmosphere by the Americans, Russians, then the British, French and Chinese introduced large quantities of products mainly from the fission of uranium 235 or plutonium. The peaceful uses of nuclear energy has also contributed to the introduction of radioactive products into the atmosphere during reactor operating accidents. The Chernobyl accident in Ukraine on April 26, 1986, is the best known, most important and most dramatic. Large areas in Europe, including France, have been affected by the cloud carrying various radionuclides, including Cesium 137 and Iodine 131 (see Pesticides: what the past teaches us). In addition, there was the more recent Fukushima accident in Japan in 2011, following an earthquake, followed by a tsunami, which resulted in the loss of the cooling system of several reactors with radioactive product releases into the atmosphere and the environment, particularly into the ocean.
10. Evolution of air quality
In the end, it can be said that air quality has improved, although there is still room for improvement, particularly on a global scale. When they are still visible, plumes from industrial and urban sites are most often visible due to water vapour condensation. This does not mean that there are no more pollutants, but effluent treatment systems can stop a large part of them. International agreements have significantly reduced the destruction of the stratospheric ozone layer and the acidification of precipitation. It is to be hoped that the same will apply to greenhouse gases. However, nitrogen oxide and particulate concentrations remain at high levels, as does the production of ozone in the lower atmosphere. The first major international action dates back to 1992 with the Rio De Janeiro conference. The commitments made at the last Paris conference in 2016 are encouraging, but concrete actions have yet to be implemented.
References and notes
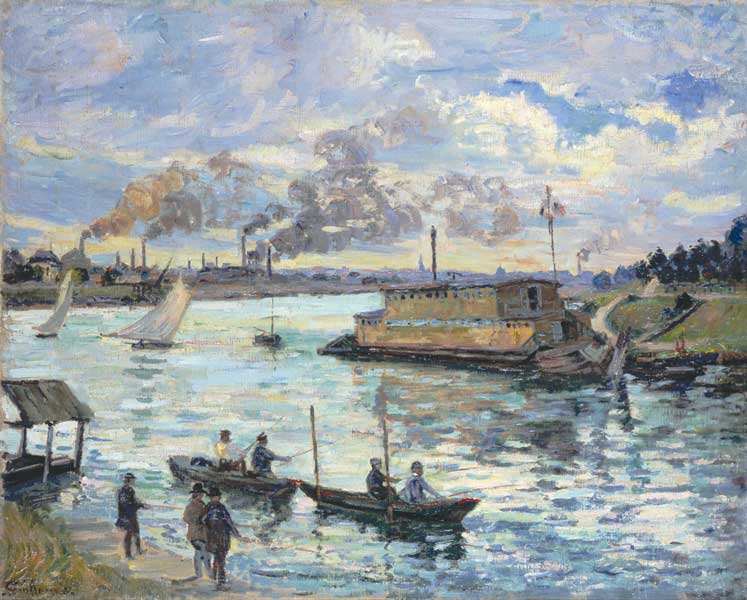
Cover image. painting by Claude Monet showing the air pollution in the Paris region at the beginning of the 20th century (Le pont Saint-Lazare, Musée Marmottan)
[1] The concentration of a pollutant, whether gaseous or in the form of particles, is expressed in mass per unit volume, most often in micrograms per cubic metre (μg/m3). For gases, instead of concentration, the mixing ratio, usually by volume, is also often used, which represents the volume proportion of the pollutant in the air. It is expressed in ppmv (one part per million), ppbv (one part per billion, pptv (one part per thousand billion or 1 part per 1012). Very often v (volume) is not indicated and we talk about ppm, ppb or ppt. A mixing ratio of 1 ppm means that per million air molecules there is one molecule of the pollutant.
[2] Camille Flammarion, L’atmosphère, Librairie Hachette, 1872.
[3] This English neologism smog is what linguists call a suitcase word. It is a fused form of the words smoke and fog.
[4] Stratospheric ozone results from the photodissociation of oxygen by short-wave ultraviolet solar radiation. This exothermic chemical reaction explains the warming of the air in this region above the troposphere, between altitudes of 20 to 70 km.
[5] The global average temperature includes a large number of observations distributed over the surface of continents and oceans. Its global average value for continental and ocean surfaces was higher than the 20th century average (13.9°C) by 0.94°C in 2016, 0.90°C in 2015, 0.74°C in 2014. (www.ncdc.noaa.gouv/sotc/global/201613).
[6] Luc Mosquerons and Vincent Nedellec. Indoor Air Quality Observatory. Inventory of French data on indoor air quality in buildings. http://www.oqai.fr/userdata/documents/Document_16.pdf
[7] YEARS – Indoor Air Quality. ,https://www.anses.fr/fr/content/qualité-de-l’Indoor Air
The Encyclopedia of the Environment by the Association des Encyclopédies de l'Environnement et de l'Énergie (www.a3e.fr), contractually linked to the University of Grenoble Alpes and Grenoble INP, and sponsored by the French Academy of Sciences.
To cite this article: FONTAN Jacques (January 5, 2025), Air pollution, Encyclopedia of the Environment, Accessed August 3, 2026 [online ISSN 2555-0950] url : https://www.encyclopedie-environnement.org/en/air-en/air-pollution-2/.
The articles in the Encyclopedia of the Environment are made available under the terms of the Creative Commons BY-NC-SA license, which authorizes reproduction subject to: citing the source, not making commercial use of them, sharing identical initial conditions, reproducing at each reuse or distribution the mention of this Creative Commons BY-NC-SA license.