


The tides
PDF
Tide refers to the process of periodic sea level change, usually semi-diurnal (period close to 12 hours), but diurnal in some regions. The tide is due to the lunar attraction, and to a lesser extent to the attraction of the Sun which modulates its amplitude according to the phase of the Moon and different astronomical periods. Very violent local currents are associated with tides in coastal areas. In addition to these well-known local effects, the tide plays a global role in climate by contributing to the vertical mixing of the ocean. Tidal oscillation excites internal waves propagating along interfaces due to temperature differences within the ocean, producing mixing as they break. Finally, on a geological time scale, the tide slows down the Earth’s rotation and keeps the Moon away from the Earth.
1. Observations from antiquity
The links between the tide and the movement of the Moon have been known empirically from antiquity [1]. The time of low water (minimum level) and high water (maximum level) delays by about 25 minutes per tide, or 1/60th day, corresponding to the displacement of the Moon on its orbit by 1/60th of a turn in 12 hours (1 turn in 30 days). Because of this delay the effective tidal period is 12 h 25 mn. It is also known that tides are more intense during the full and new Moon (spring tides) than during the first and last districts (neap tides). This indicates that the effect is governed by the Moon, with a more modest contribution from the Sun. The tide is particularly strong at equinoxes and also depends on the distance from the Moon, which varies by about 10% because of its elliptical orbit. The tidal amplitude in a given place is thus modulated by a tidal coefficient that can vary from 20 to 120 according to the different astronomical periods.
Due to its elasticity, the solid Earth is also subject to a tidal effect but with a smaller amplitude, in the order of 10 cm. What we observe at the seaside is the difference between the ocean tide and this land tide. Older measurements were made near the shore by float gauges, more recently replaced by ultrasonic or radar water level detectors. Altimetry satellites now allow tide mapping over the entire oceanic surface by radar measurement, after calibration by buoys whose position is tracked by GPS.
2. Newton’s static theory
Tides were very early interpreted as an attraction effect of the Moon and the Sun. However, these explanations stumbled on the fact that the sea is raised not only on the side of the Moon, but also on the opposite side, leading to the 12-hour period (rather than 24 hours). It was Isaac Newton (1643-1727) who first understood this paradox thanks to his theory of universal gravitation published in 1687 in his famous book Philosophiae Naturalis Principia [3]. Tides play an important role because they were the most tangible effect of attraction by a body outside the Earth at that time.
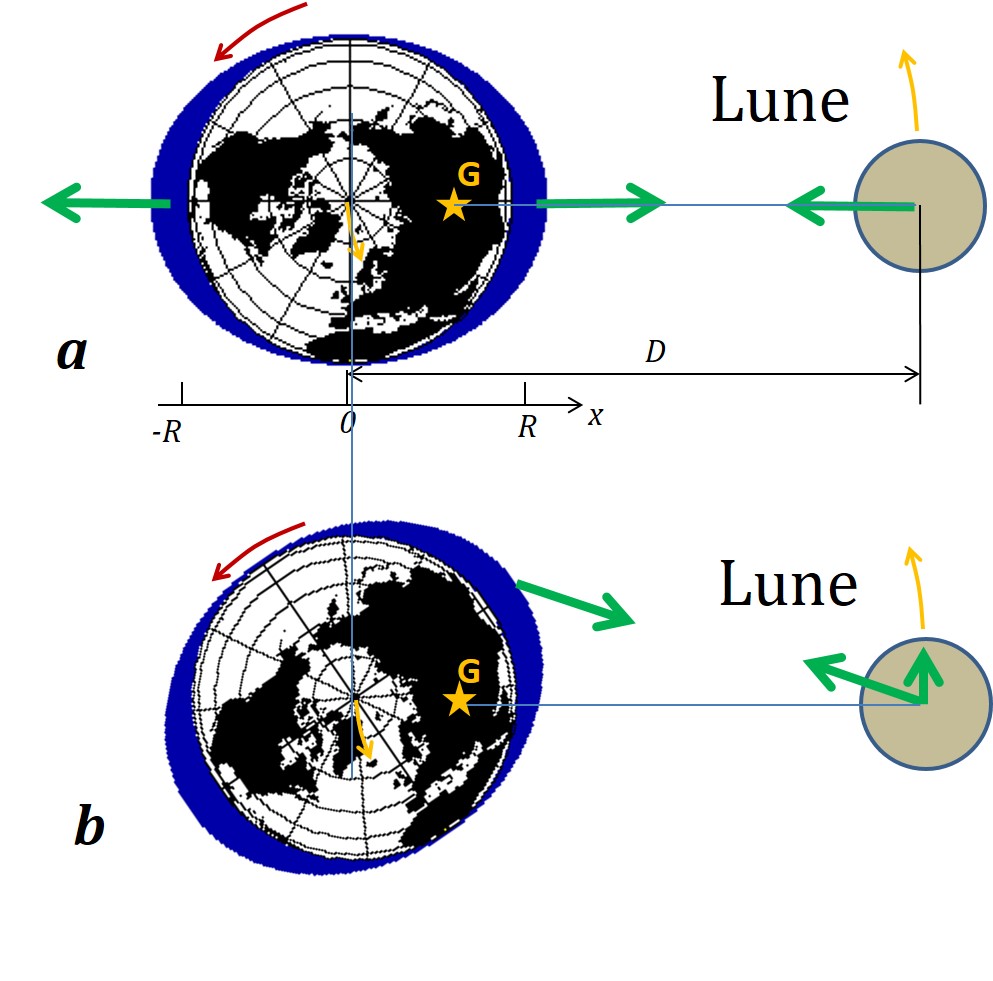
Newton first understood that if the Earth keeps the Moon in orbit by its attraction force, the Moon must in turn exert an equal and opposite force on the Earth: this is the principle of action and reaction. Thus the Earth revolves a little around the Moon, more precisely around their common barycentre (point G in Figure 2). Every body on Earth accompanies it in its movement around this barycentre, in the same way that an orbiting cosmonaut remains weightless near his spacecraft. The reason is that every body undergoes the same acceleration in a field of gravity regardless of its mass. What will move the ocean relative to the Earth is therefore not the attraction field of the Moon, but the difference between this field and the one acting at the centre of the Earth. An excess attraction is exerted in the areas closest to the Moon and a lack of attraction on the opposite side further away, producing a bulge on each side, as shown in Figure 2. Another equivalent argument is to place oneself in a frame of reference rotating around this barycentre at the orbital angular velocity of the Moon: the centrifugal force then compensates for the lunar attraction at the centre of the Earth, but it dominates at the point opposite the Moon, while the attraction dominates on the Moon’s side. This leads to the two bulges respectively.
In the so-called static theory proposed by Newton, these bulges are assumed to be fixed in relation to the Earth-Moon system. During its rotation around the Earth, a point thus passes successively through each bulge leading to two high tides per day, hence the semi-diurnal period.
The effect of the Sun is added to that of the Moon when it is in the same direction (new Moon), but also when it is in the opposite direction (full Moon), due to the double bulge. This explains the alternation observed between spring tides and neap tides. The attraction force of the Sun is stronger than that of the Moon, but the difference between the two sides is smaller due to the long distance, producing a lower tidal effect . Thus the gravitational attraction decreases as the square of the distance while the corresponding tidal effect decreases as the cube of the distance.
3. Tidal amplitude variations
A complication comes up from the fact that these different rotations occur along different axes: the Earth’s axis of rotation is tilted by 23°26′ with respect to the plane of the Earth’s orbit, itself close to the plane of the Moon’s orbit (inclined by 5° 9′ with respect to the plane of the Earth’s orbit). The diagram of Figure 2 applies strictly to the equinoxes, when the axis of rotation is transverse to the direction of the Sun, aligned with the Moon at spring tide.
However, at the solstices, a point on the Earth travels around the bulges in an inclined circle, leading to a smaller amplitude. This can be understood by considering the limiting case of a 90° tilt: at the solstice the Earth’s axis would then be oriented along the axis of the bulge, and a point on Earth would then rotate around it without any variation in height, like a rugby ball rotating around its major axis.
Finally, the Moon’s orbit is not circular, but elliptical, so that the distance D to the Earth varies by 10% between the perihelion (minimum) and the aphelion (maximum). As a result, the tidal effect is greater at perihelion by 30% (due to the dependence in 1 / D3). These different astronomical effects are taken into account in a very precise way to establish the tide tables. The understanding and prediction of tides has been the subject of much work throughout the 19th and 20th centuries (focus 1) because of its fundamental interest and importance for navigation and coastal use.
4. Tidal waves
Newton’s static approach assumes that the ocean bulge, which is fixed relative to the Moon, propagates relative to the Earth at the speed opposite to its rotation, i.e. 450 m/s at the equator. This is not possible because a deformation of the ocean surface propagates at a limited speed of about 200 m/s. This speed is related to the ocean depth d and the acceleration of gravity g by the formula c=(gd)1/2 (read https://www.encyclopedie-environnement.org/eau/vagues-houles/). This yields c=200 m/s for an average depth of d=4000 m. This wave therefore lags behind the position of the Moon, which leads to a shift of the bulge as shown in Figure 2b.
The shape of the coasts also strongly constrains this propagation, with ocean basins behaving like large basins of water shaken by the tidal force. There are established specific modes of oscillation, somewhat similar to the modes of vibration of sound waves in a musical instrument.
Newton’s theory remains accurate as a driving force, but the resulting deformation therefore depends on these propagation phenomena and the resonances that occur when the excitation frequency coincides with the natural oscillation frequencies of ocean basins.
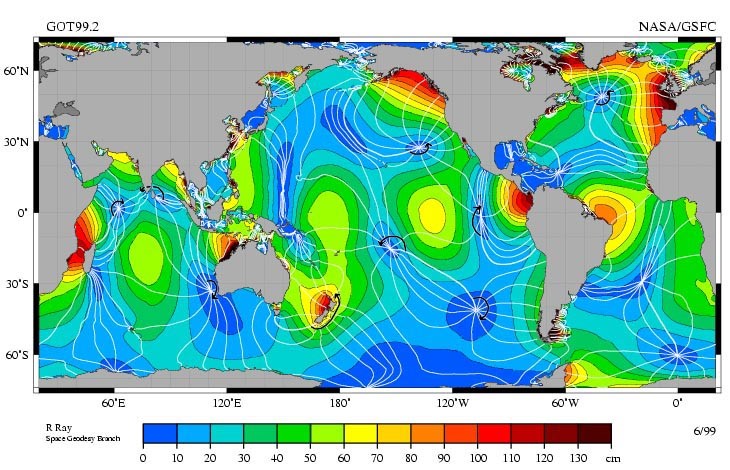
Tidal amplitude is now mapped with centimetre accuracy using altimetry satellites (see Figure 3). We can see that the amplitude is very variable, with oscillation antinodes (maxima in red) and oscillation nodes where the amplitude cancels (in blue). The lines of equal phase are also shown: they represent the delay of the tidal maximum with respect to the passage of the Moon at zenith. The tidal wave propagates perpendicular to these lines, thus rotating around the nodes. This rotation, due to the Coriolis force, is counter-clockwise in the Northern Hemisphere.
The modulation of the tides by the different astronomical effects is more precisely expressed as a sum of excitations at different periods, the semi-diurnal mode being however dominant. It is this mode, called M2, which is represented in Figure 3. Note that the average distance between antinodes (or between nodes) corresponds to the tidal wavelength of the order of 8500 km, i.e. the distance travelled by the wave at speed c=200 m/s during the 12 h period.
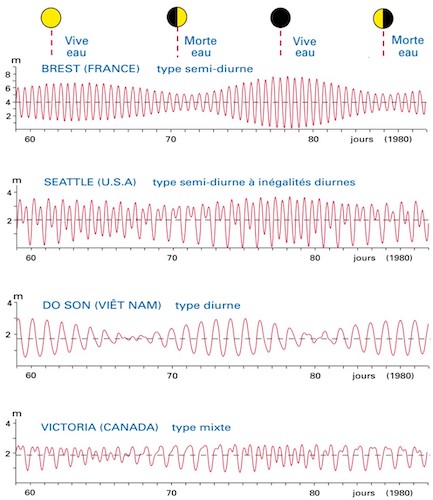
There is also an excitation at the diurnal period, resulting from a slight asymmetry of the two opposing bulges of attraction. This mode, called M1, is forced to a level 20 times weaker than M2, but it effectively resonates with the Pacific Ocean, which is comparable in size to its wavelength, about 15,000 km. The diurnal tide is thus significant in some regions of the Pacific. Regions located on nodes of the M2 mode, such as Vietnam, then mainly feel this M1 mode (3rd curve in Figure 1). Other regions show a superposition of both M1 and M2 modes (2nd and 4th curves in Figure 1).
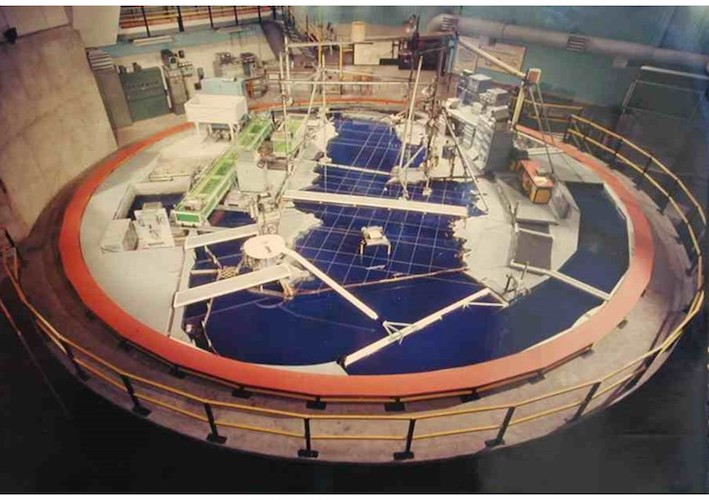
The tidal wave is often amplified in bays or inland seas such as the English Channel. This is because the energy propagates more slowly, as a square root of the depth, resulting in an increase in energy density at constant flux: moving from 5000 m to 50 m thus produces an increase in energy density by a factor of 10, i.e. an increase in amplitude by a factor of 3. In the English Channel, the average amplitude typically increases from 1 m offshore to 3 m, and the tide is associated with a strong current. The incoming current is deflected towards the French coast by the Coriolis force, and away from it at ebb tide, which amplifies the tidal range on the French side, to the detriment of the English side. These effects could be reproduced in a similar way on the large “Coriolis” rotating platform, shown in figure 4. The ocean tide forcing is then reproduced by an oscillating beater located at the entrance to the English Channel. The amplitude and phase of the tide over the whole of the English Channel could thus be reproduced (Figure 5).

Current numerical models make it possible to reproduce and predict these tidal phenomena with an accuracy of around 1cm. The main difficulties are the consideration of friction on the ocean floor in turbulent conditions and energy losses due to internal tidal excitation (see section 7).
5. Other influences on sea level
The tide is not the only effect influencing sea level. First of all, we can ask ourselves about the relevance of measurements to the nearest cm in a sea that is often rough with waves of several metres. But the average level over several square kilometres is very well defined even if it locally fluctuates very strongly. In addition, for tidal amplitudes such as those in Figure 3, the signal is filtered at a given time period (12h 25 min), similar to the frequency selection used to receive radio waves. Thus, effects acting at other frequencies are not taken into account.
Among these other effects, atmospheric pressure is a fairly immediate factor. A high pressure locally lowers the water level: an overpressure of 10 hPa = 103 N/m2 induces by simple hydrostatic equilibrium a decrease of the level by 10 cm, the height h of a water column whose weight ρgh is 103 N/m2 (ρ=103 kg/m3 represents the density of water). By contrast low atmospheric pressure raises the water level. The overheight reaches a value of one metre at an atmospheric pressure of 913 hPa, occurring in the middle of extreme hurricanes. This rise in water levels amplifies the damage caused by waves and heavy rainfall in coastal areas.
A second effect is due to the friction force of the wind. When it is directed offshore, this force lowers the water level, and by contrast pushes the water towards the shore if it is directed toward the land. An elevation of about 1 m can be produced during heavy storms. The coincidence of these phenomena with high tides favours the breaking of protective dikes that cause flooding, such as the storm “Xynthia” that struck France in February 2010, or hurricane “Katrina” that flooded New Orleans in August 2005. These phenomena, depending on wind and pressure, are however much more predictable than the intense and very local precipitation that causes flash floods.
In the longer term, average sea level increases in the presence of global warming due to ocean expansion, which accounts for about 65%, and glacier melting for the remaining 35%. Recent measurements indicate an average elevation of about 2 mm/year.
Finally, the water level on the coast also depends on the evolution of the solid Earth. Sediment transport modifies the shoreline, through siltation or erosion. The latter effect currently tends to dominate due to dams on large rivers that reduce sediment input. The Louisiana coast is severely eroded due to the decrease in sediment brought by the Mississippi River. Deep geological movements also contribute, changing the shape of the coasts by continental drift over millions of years. In Canada and northern Europe, the most significant geological effect is the post-glacial rebound that raises Scandinavia by several mm per year following the load reduction due to the melting of the ice caps 10,000 years ago. This uplift induces by compensation a sinking of peripheral areas such as Brittany in France. Thus, menhirs erected on land 7000 years ago are found in the sea, after a sinking of the continent by about 7 m.
6. Harnessing the energy of the tide
Tidal mills have been used since the Middle Ages to harness tidal energy at favourable sites, with estuaries or coves sheltered from the waves and equipped with small dams. The principle was adopted for the Rance tidal power plant, which was commissioned in 1967. With an average capacity of 57 MW (installed capacity of 240 MW), it produces 3.5% of Brittany’s electricity consumption (and 45% of its electricity production). It remained the world’s largest tidal power plant for 45 years, until the slightly more powerful Sihwa Lake power plant in South Korea was commissioned in 2011 (254 MW installed). The facility uses a dam across the Rance estuary, with directional blade turbines that can operate in both directions, at rising or falling tide.
However, few high tide sites allow the construction of facilities of this size, and the need to preserve natural sites now makes it difficult to build them by the sea. A much more ambitious project consisted in damming the bay of Mont Saint-Michel in France. This is a particularly exceptional site in terms of tidal amplitude, but this project was abandoned in favour of the development of nuclear power plants in the 1970s.
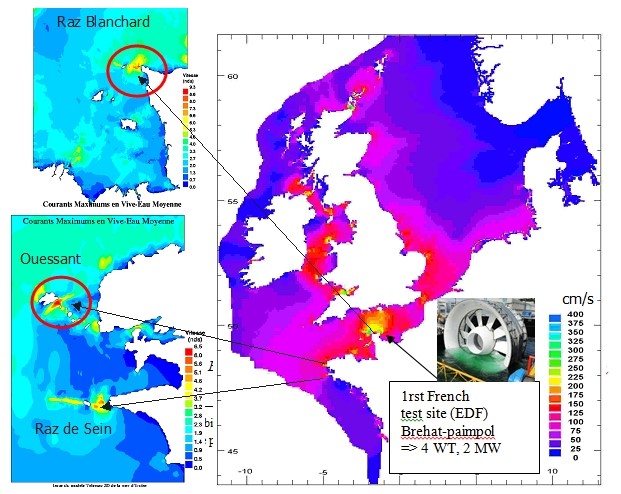
The current trend is to directly use the currents produced by the tide through hydro turbines, the marine equivalent of wind turbines. These turbines do not require reservoirs and therefore have a lower environmental impact. However, the developments are only at the prototype stage of a few MW, with test sites in Scotland and Brittany (see Figure 6). In Scotland, the objective by 2020 is to build hydroelectric farms producing 1,000 MW. The total estimated resource in Europe is around 10,000 MW installed (5,000 MW average), 80% of which is in France and Great Britain. This represents about 10% of the average electrical power consumed in France.
This resource represents barely 0.2% of the total power dissipated by the tides and thus lost through the Earth’s rotation (see section 8). Energy extraction tends to slow down the tidal current and thus reduce its amplitude locally, thus reducing viscous friction losses. It can be expected that the extracted energy will be dissipated as heat anyway in the absence of capture. However, it is not easy to calculate the return impact on the Earth’s rotation, which is very small anyway[5].
7. Internal tide
The density of the ocean increases with depth, with surface water being warmer (and therefore less dense) than deep water. Such density stratification can also result from salinity, for example in the Strait of Gibraltar where ocean water enters the more salty Mediterranean Sea while remaining at the surface due to its lower density. This situation can be summarized by a two-layer model of different densities.
Internal wave oscillations, known as internal waves, can propagate along this interface in a similar way to surface waves. However, they are much slower, described by replacing gravity g by a reduced gravity gδρ/ρ, where δρ/ρ is the relative density difference between the two layers. In a surface layer of thickness H, the propagation velocity of the waves is therefore c=(Hgδρ/ρ)1/2 . For or a typical value δρ/ρ=0,001, the propagation speed is thus 30 times less than for the surface waves in a layer of the same thickness : c=1 m/s for a layer of thickness H=100 m.
Internal tidal generation is observed in many parts of the ocean. One of the most active is the Strait of Luzon, separating Taiwan and the Philippines, where an underwater ridge generates internal waves in the China Sea whose vertical displacement exceeds 300 m. The dissipation of these waves by breaking contributes to the vertical mixing of the ocean, which in turn affects its general circulation and climate.
8. Astronomical effects and energy dissipation
On astronomical time scales, the tides increase the length of the day by 2 ms per century, or about one hour in 200 millions years. This slowing down of the Earth’s rotation can be measured very well with current atomic clocks. In addition, the tidal effect moves the Moon away by 3.8 cm/year. This effect can be measured directly with an accuracy of 1 cm by measuring the round trip time of laser pulses sent to reflectors deposited by the Apollo lunar missions [7].
This slowdown is confirmed by the observation of fossil corals (ref 6), whose daily growth circles make it possible to count the days in a year. Thus the year counted 410 days 400 million years ago, a 21.5-hour day. Monthly bands associated with the full moon also indicate that the year was 13 months long, i.e. the Moon was spinning faster (and was therefore closer to the Earth).
These effects are easily understood with the diagram in Figure 2b. Earth’s rotation tends to entrain the bulge, which is therefore out of phase with Newton’s static model. The lunar attraction thus exerts a torque that slows down the Earth and reciprocally brings energy to the Moon. Counterintuitively at first sight, such an energy supply tends to drive away the Moon, and therefore to slow down its rotation, whose speed decreases in 1/√r. However, the kinetic moment of the Moon, produced by the speed by the distance to the Earth r increases well (in √r), in accordance with the motor direction of the torque. The kinetic moment of the Earth decreases in the same proportion so that the total kinetic moment is preserved. The total mechanical energy decreases, converted into heat when the marine currents produced by the tide dissipate.
Astronomical measurements make it possible to accurately determine the decrease in rotational energy and thus to deduce the total power dissipated by the tides: 2.9 x10¹² Watts. Oceanographers, for their part, have estimated a power dissipated by about half by studying tidal currents, most of which are active in coastal areas. It is now established that the’missing dissipation‘ is due to the excitation of the internal tide (see section 7), which spreads inside the ocean and eventually dissipates. This dissipation occurs by waves breaking, producing a slow vertical mixing of the ocean. The influence of these effects on thermo-haline circulation is currently under active research.
Notes and references
Cover illustration. Mont-Saint Michel, où les marées peuvent atteindre un marnage de 15m. source https://upload.wikimedia.org/wikipedia/commons/thumb/2/29/Mont-Saint-Michel_Drone.jpg/1280px-Mont-Saint-Michel_Drone.jpg .
[1] http://www.imcce.fr/promenade/pages5/525.html#Para02
[2] Tidal level records at more than 900 sites over the world are available on http://www.ioc-sealevelmonitoring.org/
[3] Newton I. (1687) ’Philosophiae naturalis principia mathematica’
[4] http://science.nasa.gov/media/medialibrary/2000/06/15/ast15jun_2_resources/oceantides.gif
[5] Maitre T., http://encyclopedie-energie.org/notices/les-hydroliennes
[6] This statement needs to be qualified, as a large energy extraction would in turn change the shape and phase of the tides, and thus the torque exerted on the Earth. nevertheless, a 5,000 MW extraction represents just 0.2% of the total power dissipated in the tides (see section 8)
[7] http://culturesciencesphysique.ens-lyon.fr/ressource/laser-distance-terre-lune.xml
[8] Runcorn S.K. , « Corals as paleontological clocks», Scientific American, vol. 215, 1966, p. 26–33
The Encyclopedia of the Environment by the Association des Encyclopédies de l'Environnement et de l'Énergie (www.a3e.fr), contractually linked to the University of Grenoble Alpes and Grenoble INP, and sponsored by the French Academy of Sciences.
To cite this article: SOMMERIA Joël (January 5, 2025), The tides, Encyclopedia of the Environment, Accessed July 24, 2026 [online ISSN 2555-0950] url : https://www.encyclopedie-environnement.org/en/water/the-tides-2/.
The articles in the Encyclopedia of the Environment are made available under the terms of the Creative Commons BY-NC-SA license, which authorizes reproduction subject to: citing the source, not making commercial use of them, sharing identical initial conditions, reproducing at each reuse or distribution the mention of this Creative Commons BY-NC-SA license.

