La Clapière: is the largest French landslide still a major risk?
PDF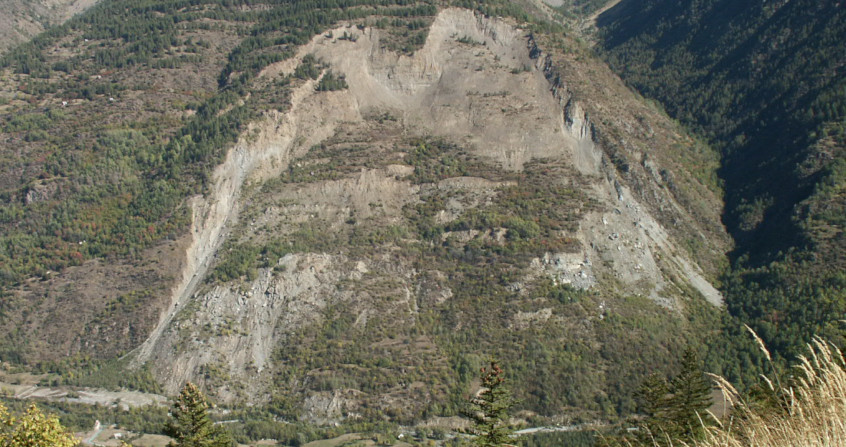
The La Clapière landslide (Alpes-Maritimes) involves 50 million m³. Identified around 1980, the phenomenon showed a gradual acceleration with marked seasonal modulations. After a peak in speed in 1987-88 that raised fears of a catastrophic rupture, and led to the excavation of a diversion tunnel for the river, a deceleration occurred, attributed to better drainage in the moving mass.
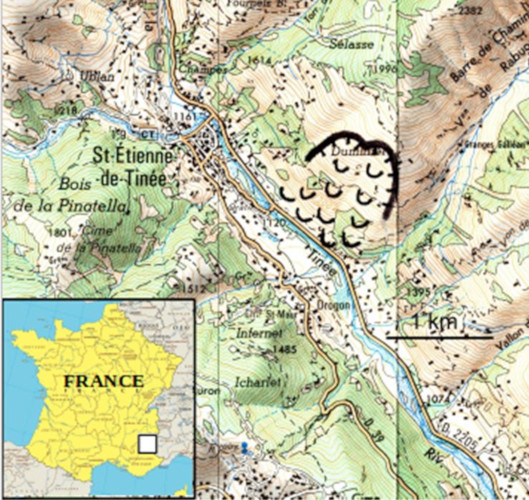
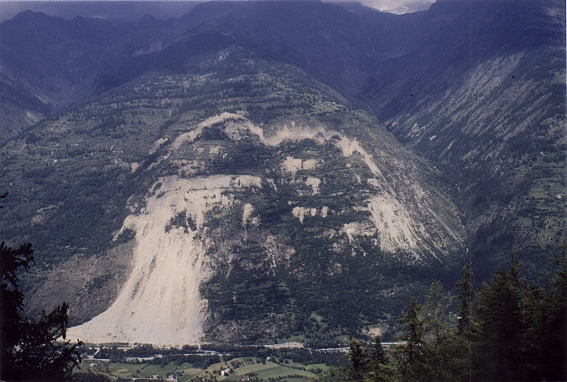
The La Clapière landslide is located in the Southern Alps (Figure 1), 80 km north of Nice. It developed on the left bank of the Tinée, a tributary of the Var, less than one kilometre downstream of the village of Saint-Étienne-de-Tinée. The landslide extends from the valley bottom, at an altitude of 1100 m, to 1760 m. The total area of the landslide is approximately 1.2 km² and its volume is estimated at around 50 million m3 (50 hm3). Forty years ago, boulder falls and road deformations attracted attention and a phenomenon of instability on the slope was detected. A monitoring of the movements was in place at the end of 1982, by distance measurements from the opposite side. In 1984 the road was temporarily diverted and then, in 1986, definitively on the right bank slope of the Tinée river.
A catastrophic break was expected in the late 1980s. To avoid the risk induced by a dam in the valley, a tunnel project was studied, following the visit of Minister H. Tazieff in 1988, and built in 1989-1991 under the right bank of the Tinée river. Zones prohibiting access to the foot of the slide and construction in the assumed spreading area have been defined. A contingency plan has been put in place. However, as early as 1988, a deceleration of the movement appeared, interrupted by a few seasonal peaks, and in 2019 it seems that the main mass stabilized, after a cumulative displacement of more than a hundred meters (see the animation Clapiere.avi).
1. An old phenomenon reactivated

Annual rainfall averages 990 mm in Saint-Étienne-de-Tinée. The upper part of the slope, which rises to 3000 m, is covered with snow in winter and spring.
1.1. Geology
The La Clapière landslide is located on the southwestern edge of the Argentera-Mercantour massif, in contact with the sedimentary Triassic. It develops on a slope composed of metamorphic rocks of the Hercynian age, mainly gneiss, amphibolites and migmatites: the Annelle series, in which the 80 m thick Iglière formation can be individualized and composed of massive migmatites (Figure 3). The proportion of micas (biotite) is high in some levels of the Anelle series, promoting alteration.

The presence of gypsum Triassic rocks at the foot of the slide, which would nowadays be masked by alluvial filling, remains a hypothesis, in the absence of boreholes.
After the glacial retreat, dated 13,000 years ago B.P. (Before Present: origin = + 1950) in the Tinée Valley, glacio-alluvial and alluvial formations filled the valley floor to a thickness of several decameters.
From a hydrogeological point of view, a two-layer model can be accepted: one, basal, connecting to the alluvial groundwater of the Tinée and impregnating the foot of the slide, and the other, perched in the decompressed zone of the gneisses (a few surface decameters), feeding the top of the slide and in particular the upper slide.
1.2. History of slope destabilization

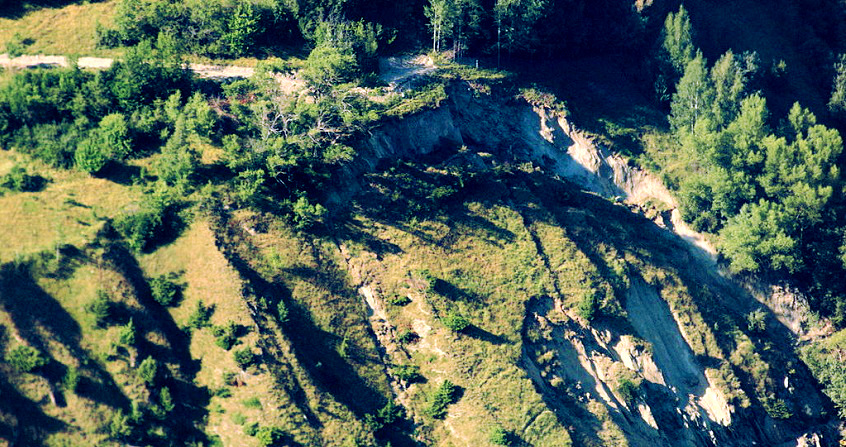
On the 1938 aerial photographs, a beginning of a high escarpment is visible, corresponding to the northwest lobe of the current landslide. In the 1950s, the two lobes formed a clean, high escarpment while the scree cone of La Clapière sensu stricto was enriched with many blocks.

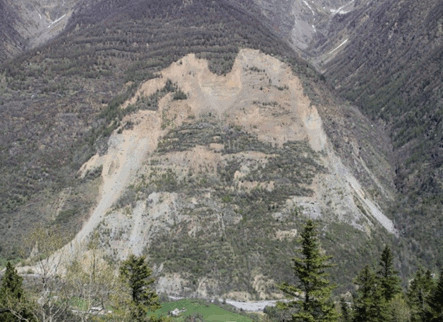
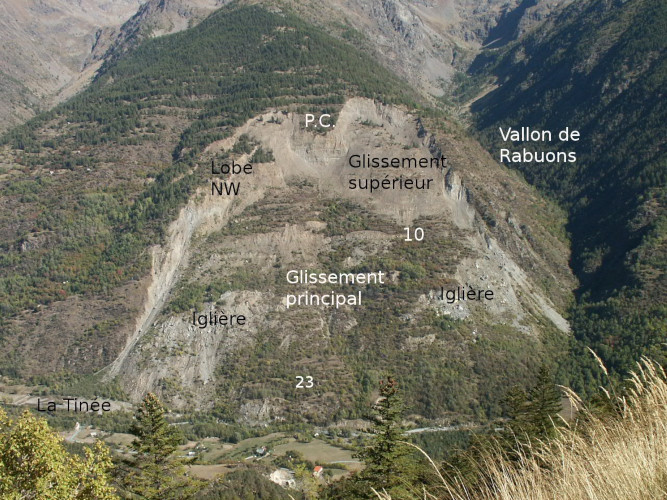
A significant regression upstream of the Rabuons lobe occurred around 1989, accentuated in 1997, delimiting the upper slide (about 5 hm3), which gradually advanced over the main slide (Figure 2).
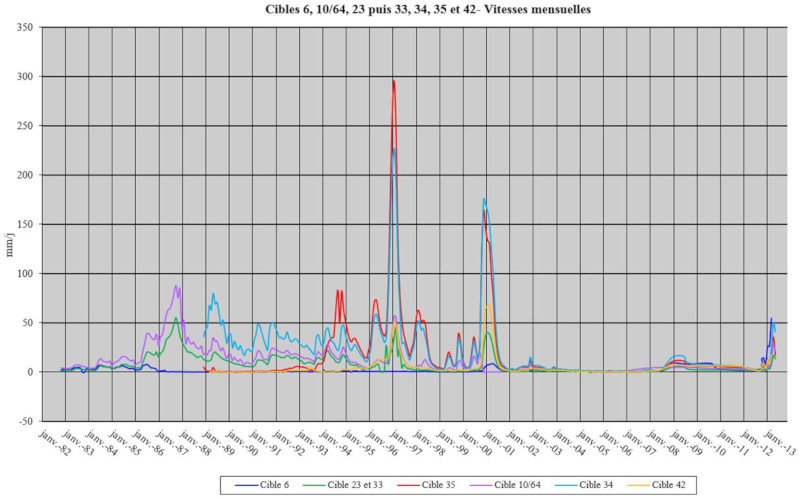
The slowdown, still marked by peaks during very wet periods, particularly in the upper landslide, has continued until today when movements are low (less than 20 cm per year in the main landslide since 2010 for most of the targets). Since the early 2010, significant displacements of the NW lobe have been observed, but without regression upstream.
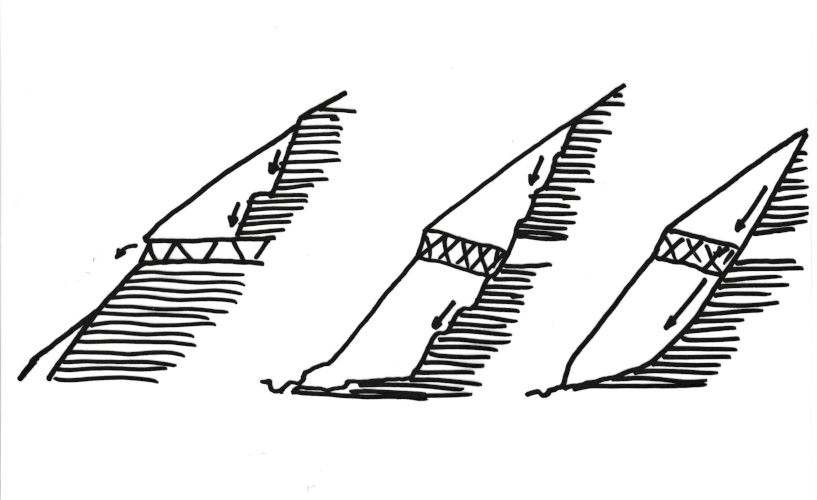
After a cumulative displacement of 100 to 130 m, the slide is now subject to surface erosion, which degrades in particular the upstream escarpment (Figure 6).
2. A slip observed and measured from every angle
2.1. Distance measurements
A system of distance measurements by infra-red from the opposite side has been operational since 1983 [2]. The measurements were acquired by two distance meters, located 1 km apart, for several years, then by a single device. Between 30 and 50 targets are targeted in and around the slide.
Variations in humidity and air temperature in the valley disturb electromagnetic waves. To correct the resulting errors, measurements are taken each time on 3 or 4 fixed targets located on the periphery of the slide. For distances ranging from 600 to 1800 m, the accuracy is estimated at between 3 and 6 mm after correction.
In addition, geodetic measurements were carried out once a year to determine the 3D displacement vectors.
2.2. Digital Differential Terrain Models
The exploitation of two digital terrain models (DTMs) taken at different dates gives an assessment of the altitude variations Dz of the surface at a given point (x,y). Serratice [4] thus compares 1970 and 1997 DTMs from aerial photographs: the (apparent) swelling in the lower part of the slide and the (apparent) subsidence in the upper part are well highlighted (several decameters), but the volume balance shows a very small variation, less than 1%.
2.3. Terrestrial and satellite images
In addition to the classic multi-date photo-interpretation, which makes it possible to identify important evolutions in the slip [5], a quantitative exploitation of aerial photos has been carried out by different authors.
Delacourt et al [6], after rectifying the aerial photographs of 1983, 1991 and 1999, estimate the horizontal displacements of the various landslide sectors; in particular, between the two extreme dates, the Iglière’s bar increased by 160 m in the NNW section and by 120 m in the SSE; the foot advanced by 115 m.
The image correlation technique was used by Delacourt et al [6] with aerial photographs from 1995 and 1999. The authors obtain a map of the horizontal displacements between these two dates.
3. Kinematic and mechanical models
3.1. The ancient deformations
The convex geometry of the slope, left by the glacier, is favourable to a destabilization of the lower part of the slope. The glacier was a foot stop and its melting caused an imbalance in the massif, as has often been observed in glacial valleys. However, destabilization seems to have started well after the melting of the Tinée glacier. A climatic factor and possibly a full-scale gypsum dissolution may have contributed to the initiation of ruptures.
Field observations and the interpretation of aerial photographs led Follacci [3] to a model of the development of the rupture, heterogeneous in time and space. The rupture first develops in the SE lobe, weakened by the nearby presence of the Rabuons valley. It then reaches the NW lobe, above Iglière’s bar and finally over the entire height (Figure 7).
It was only around 1990-1991 that the upper and lower speeds converged, indicating the transition to an overall rotational slip.
The image of a fracture surface developing as it gradually “smoothed”, as proposed by Follacci [2], can thus be retained (Figure 6). In addition, the Iglière’s bar, made of massive migmatite, was a reinforcement for the slope whose progressive rupture may have allowed the acceleration of the 1980s. It should be borne in mind that “roughness” on a sliding surface can typically have a height of 1 to 2% of its length in the direction of the slope, which represents here more than ten meters.
3.2. The recent sliding phase: a bit of mechanics
Considering the cumulative displacement, it can be assumed that after 1988 the pseudo-circular fracture surface formed. We do not have any boreholes in the slide but we can estimate the depth of the slide at about 90 m, using the dip of the vectors moving along the slope.
A backward analysis assuming a boundary equilibrium (without slick) leads to residual mechanical parameters: cohesion c‘r = 0 and friction angle φ’r = 32.5°.
The kinetic energy of the slip (½ MV²), during the 1987-8 crisis, was less than 1 Joule, but the daily potential energy loss was about 100 MJ. The enormous potential energy reserve is therefore consumed entirely in the form of deformation/rupture within the moving mass and heat along the sliding surfaces.
If we compare the morphology of the slope between 1970 and 1992 (100 m displacement, compared to a breaking length of 1000 m), the decrease in engine torque could explain, at least in part, the slowing after the 1987 peak. But a hydrogeological cause can also be invoked.
4. The importance of the hydrogeological factor

Given the complexity of hydrogeology in a rocky massif such as La Clapière, the coupling between the water supply P (rain or snow melt, even if the consideration of snow melt is probably imperfect) and the sliding speed V was simulated using different types of “black boxes” or grey boxes. To better reflect the P → V command, the process is divided into a hydrogeological part “P → H” and a mechanical part “H → V”. All models thus consider a pseudo-piezometric level H calculated as the difference between the water supply (precipitation P, or better infiltration I) and drainage. It is estimated H on day n+1 from H on day n and P on the previous days. The mechanical part of the models uses different laws that simply link speed or acceleration to height H.
All these models allow to obtain a good agreement between calculations and measurements by adjusting their parameters to the measurements, but this calibration must be renewed frequently. In addition, the models are unable to predict major changes in slope behaviour, particularly the 1987 peak speed. This seems to confirm that a significant change in hydro-mechanical behaviour has occurred. Similarly, in 2001 or 2013, the “jolts” observed (Figure 5) could be explained by temporary clogging.
This weakness of the models therefore makes it impossible to predict a catastrophic break by this type of method; however, the interest in making a forecast within a few days remains, as any discrepancy between the forecast and the measure may be an indication of a change in behaviour.
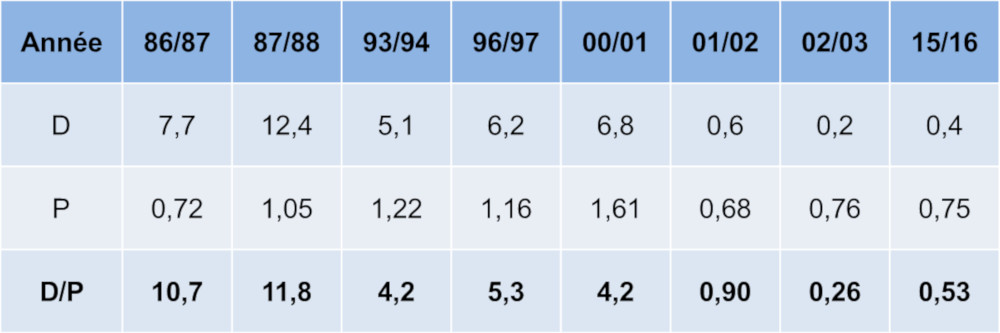
More generally, the sensitivity of the main slip to water inputs can be assessed by the ratio of annual displacement D to annual input P (Table 1). The reduction in D/P by a factor of 20 to 40 between 1986/1987 and after 2000 is remarkable.
The evolution over time of the water control can be interpreted as resulting from a deformation/permeability coupling. Thus, the deceleration after the 1987-88 peak (Figure 7) would reflect a fairly rapid opening of discontinuities, facilitating drainage. It should be noted that the secondary peak in 1996-97 could correspond, conversely, to a temporary decrease in drainage capacity (sealing of fractures, etc.).
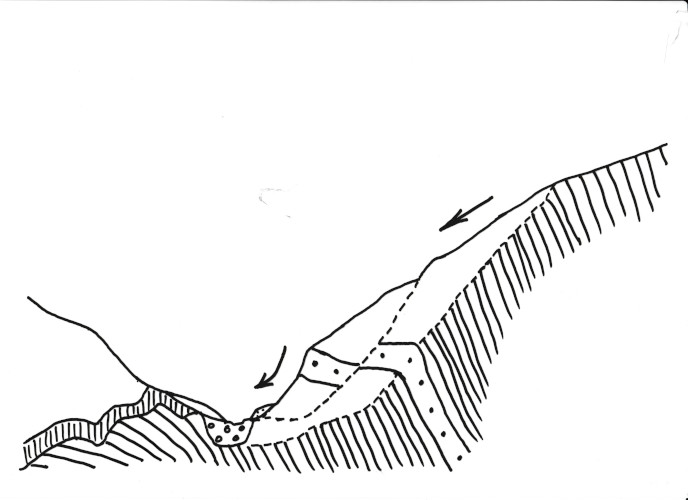
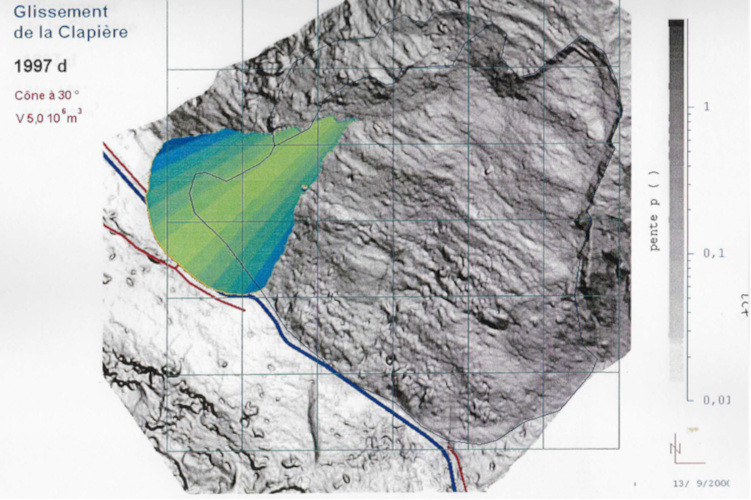
5. The propagation of a landslide

6. Messages to remember
- In France, La Clapière was the first major slope movement to benefit from dense and precise monitoring instrumentation, with the Séchilienne (Isère) site being equipped a few years later.
- While this instrumentation was mainly motivated by a concern for public safety, the scientific contribution was very rich, mainly in the analysis of hydrogeological control. It should also be mentioned that, in return, the reliability of operational monitoring is made more reliable thanks to advances in understanding phenomena.
- The history of La Clapière is now almost over, with the truly active phase now giving way to a period of slow degradation by erosion – unless there is a significant upstream decline. The striking fact of this multi-millennial history is that there was no rapid catastrophic movement in the end, mobilizing several tens of millions of cubic meters, an event that seemed very likely in 1987.
- The rather abrupt slowing of La Clapière at the end of 1987, and therefore the non-occurrence of a catastrophic landslide, are attributed to a change in hydrogeological conditions, the significant cumulative deformation having favoured a good drainage of the moving mass and at the same time reducing the influence of hydraulic pressures. To this cause, relating to the coupling between deformation and underground hydraulics, we can add the reduction of the engine torque due to the hectometric advance of the slipped mass, an advance that continues to this day, although very slow.
Notes and references
Cover photo. [Source: © J-L Durville]
[1] Follacci J.P., Guardia P. Ivladi J.P. (1988). Le glissement de La Clapière (Alpes-Maritimes) dans son cadre géodynamique. Symposium international sur les glissements de terrain, Lausanne.
[2] Follacci, J.-P. (1999). Seize ans de surveillance du glissement de La Clapière (Alpes-Maritimes). Bull. Labo. Ponts et Chaussées, 220: 35-51
[3] Follacci J.P. (1987) Les mouvements du versant de La Clapière à Saint Etienne de Tinée (Alpes Maritimes). Bulletin de Liaison des LPC, n°150-151.
[4] Serratrice, J.-F. (2006). Modélisation des grands éboulements rocheux par épandage. Application aux sites de La Clapière (Alpes-Maritimes) et de Séchilienne (Isère). Bull. Labo. Ponts et Chaussées, 263-264: 53-69.
[5] Potherat P. (1994). Photo-interprétation du glissement de la Clapière – Analyse structurale cinématique du mouvement de 1955 à 1992. 7th International IAEG Congress Paris.
[6] Delacourt C., Allemand P., Casson B., Vadon H. (2004). Velocity field or the “La Clapière” landslide measured by the correlation of aerial and Quickbird satellite images. Geophys. Res. Lett. 31, L15619, doi: 10.1029/2004GL020193.
The Encyclopedia of the Environment by the Association des Encyclopédies de l'Environnement et de l'Énergie (www.a3e.fr), contractually linked to the University of Grenoble Alpes and Grenoble INP, and sponsored by the French Academy of Sciences.
To cite this article: DURVILLE Jean-Louis, PEREZ Jean-Louis, MAURIN Patrice (August 17, 2019), La Clapière: is the largest French landslide still a major risk?, Encyclopedia of the Environment, Accessed July 27, 2024 [online ISSN 2555-0950] url : https://www.encyclopedie-environnement.org/en/soil/la-clapiere-largest-french-landslide-major-risk/.
The articles in the Encyclopedia of the Environment are made available under the terms of the Creative Commons BY-NC-SA license, which authorizes reproduction subject to: citing the source, not making commercial use of them, sharing identical initial conditions, reproducing at each reuse or distribution the mention of this Creative Commons BY-NC-SA license.