


How to feed plants while polluting less?
PDF
Is it possible to fertilize crops while respecting the environment? This question, at the heart of our society’s environmental concerns, has no simple answer. Plants have an imperious need for mineral elements to grow, live and reproduce. They draw these elements from the soil through their root system. However, the availability of mineral elements in the soil is highly variable: it depends on multiple interactions between the physico-chemical parameters of the soil, the numerous microorganisms that live in it and the biology of the plants themselves. Understanding these phenomena sheds light on agronomic practices for mineral fertilization of crops. Until recently, crop nutrition was done element by element, based on a prognosis of productivity resulting in fertilization that was often excessive and sometimes dangerous for the environment. How can more efficient fertilisation be achieved through more precise adjustments of inputs, and therefore more integrated fertilisation practices that generate less pollution?
1. Minerals essential to plant life
At the beginning of the 19th century, advances in chemistry made it possible to determine the mineral composition of many plants. In 1860, the German physiologists Pfeffer, Sachs and Knop (see Focus Pioneers in Mineral Nutrition) showed that plants can grow on an inert substrate provided they add to the water about fifteen essential mineral elements that are absorbed by the plants in the form of ions with a positive (cations) or negative (anions) charge. These techniques to cultivate plants, in which the roots are directly bathed in the nutrient solution without a solid substrate, are the origin of hydroponics (a cultivation technique without soil using renewed nutrient solutions and an inert substrate such as sand or glass beads).
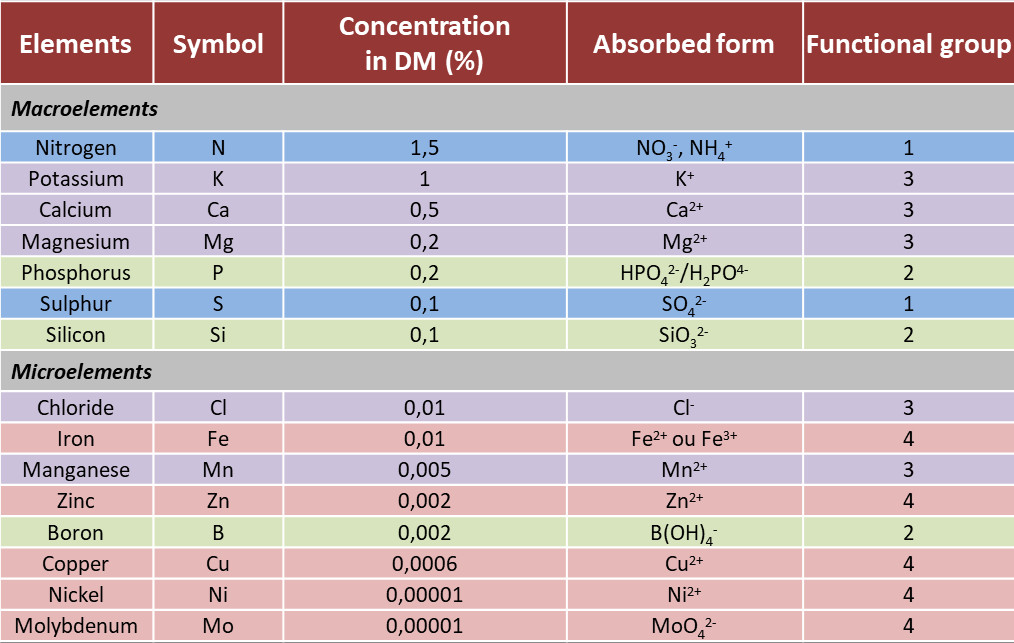
Essential mineral ions for plants have been classified according to their relative abundance into two categories, macroelements and microelements (Table 1).
- The macroelements, also called major elements, (N, P, K, S, Ca, Mg) represent for each at least 0.1% of the dry matter of the plant and generally do not exceed 2% of it.
- Microelements (Mn, Zn, Cu, Fe, Ni, Cl, B, Mo), also called trace elements, represent an insignificant part of the dry matter of plants (from 0.01% to 0.00001%), despite their essential role in plant physiology.
Table 1. Macroelements and microelements of plants. Concentration in plant dry matter (%) and absorbed form.
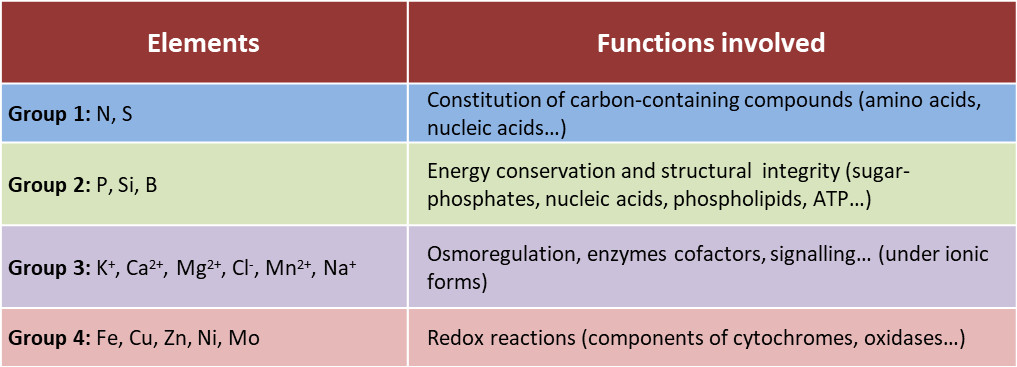
The various elements are involved in a wide variety of functions (Table 2):
- Mineral ions – such as nitrogen, phosphorus, sulphur – are assimilated by plants into the organic molecules that make up living organisms (nucleic acids, amino acids, lipids, etc.).
- Oxygen in these molecules generates negatively charged groups (carboxyl and phosphate groups for example). Nitrogen generates positive charges (amines). The quantity of oxygen atoms is much greater than that of nitrogen atoms in biomolecules. As a result, most of these molecules carry a net negative electric charge. This negative charge of organic molecules is electrically compensated by the presence of large amounts of inorganic cations, K+, Ca2+ and Mg2+.
- Potassium is the most abundant inorganic cation in the cytoplasm of plant cells. It controls their turgor pressure (pressure of the cell contents against the cell wall) and the water potential (the potential for water to leave a given compartment) of the plant. It is therefore involved in the control of cell elongation and growth and in the regulation of stomatal opening.
- Minerals are also involved in energy conservation in cells and in many enzymatic reactions as co-factors. For example, magnesium is at the heart of chlorophyll (See The colours of leaves); the iron-sulphur centres and the iron heme of certain proteins are involved in the cell oxidation-reduction processes and in the transfer of electrons from the photosynthetic and respiratory chains [1].
Table 2. Functions of mineral elements in the plant.
In both situations the physiology of the plant will be altered, causing decreases in biomass production and possibly death in extreme cases. Minerals homeostasis in the plant is therefore an essential vital process. This explains why minerals absorption by roots involves active mechanisms that are genetically controlled in response to the availability of these ions in the soil (see parts 3 and 4).
2. Historical basis of plant nutrition and its limitations
Mineral fertilization of crops is the practice of adding certain mineral elements to the soil to :
- Correct soil deficiencies in certain elements that limit plant growth and crop yield;
- Regularly returning to the soil the quantities of elements exported by crops in order to maintain soil fertility over the long term.
Fertilization can be carried out in organic form, through the application of manure or compost containing various minerals that are released into the soil through mineralization (see Figure 6). It can also be carried out with mineral fertilizers of different ionic forms. For plants, there is no fundamental difference between the two types of fertilization. Ultimately, they both result in the same ionic forms being absorbed by the plants (see Part 1).
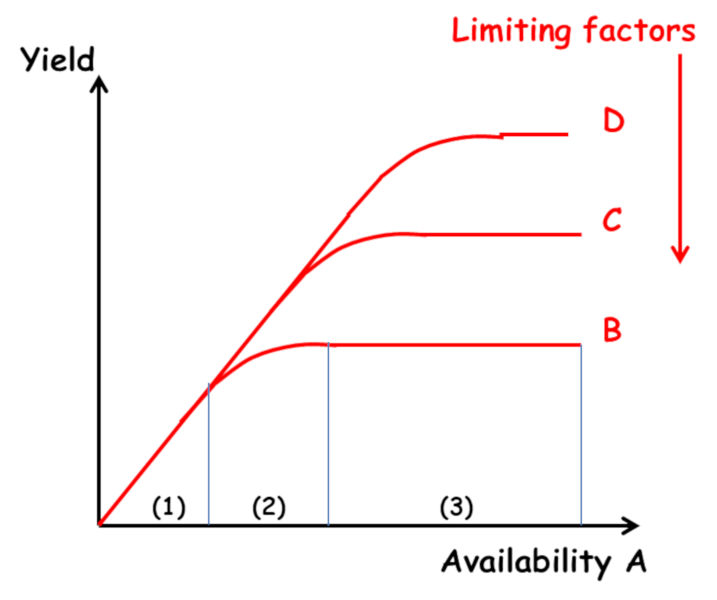
Agronomic research on mineral nutrition of crops is based on Liebig‘s “law of the minimum” (1855): “Plants grow only according to the level allowed by the the most limiting nutrient“. Its interpretation as the “law of limiting factors” gave rise to the idea that plant growth was constrained by successive limiting factors, independent of each other, manifesting themselves sequentially as one acts on the environment through corrective measures. Three areas of response to fertilizer inputs can be defined (Figure 3) [2] :
- Zone 1: a linear response which is independent of the level of other factors;
- Zone 2: a decreasing response which is a function of the level of the other factors;
- Zone 3: a lack of response due to the limitation of another factor.
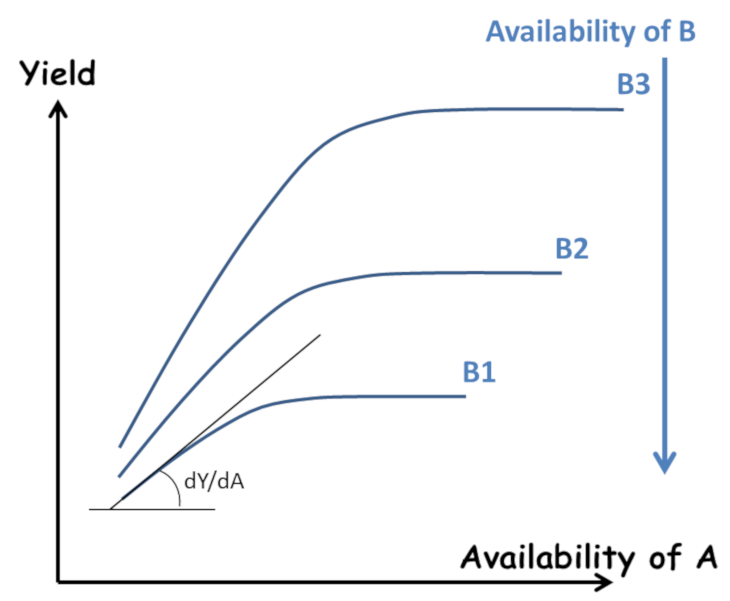
However, as early as 1885, Liebscher proposed a more complete formulation in the form of the law of the optimum: “Each nutrient is used all the more efficiently the closer the availability of the most limiting element is to its optimum” (Figure 4). This paved the way for an analysis of the interactions between elements, beyond the simple “all or nothing” effect of Liebig’s law. However, this work remained largely ignored. This resulted in an excessive division of research by compartmentalizing the plant response to each of the major elements N, P, K… and trace elements.
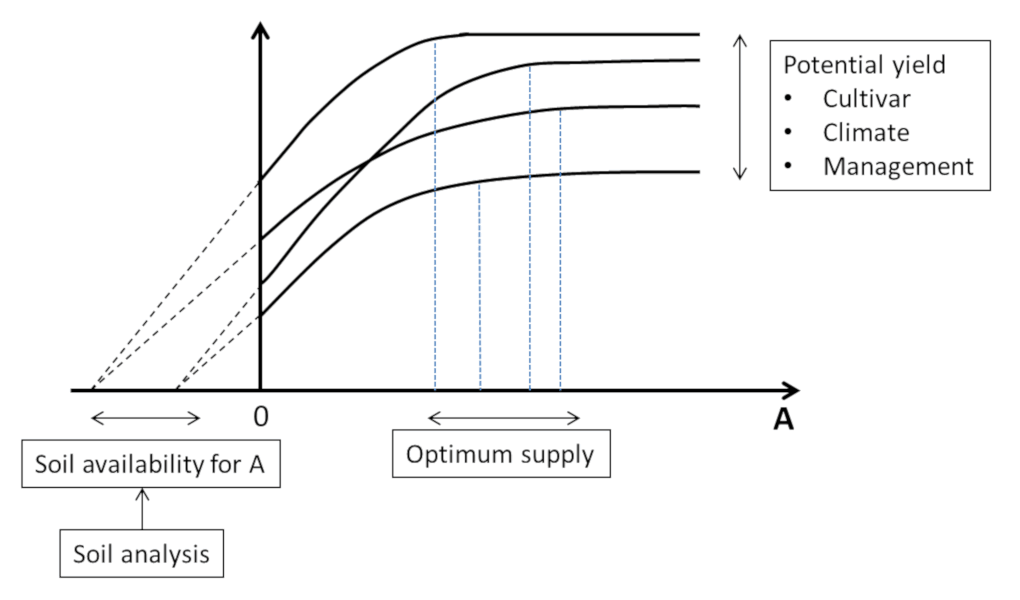
- Analysis of the physico-chemical interactions between the different nutrients and the mineral matrix of the soil made it possible to quantify the in situ “availability“ of these elements for plants.
- Thus a “soil diagnosis” (soil analysis) provides a “nutrition prognosis” of the crop to deduce possible corrections to be made by fertilisation.
- Apart from these corrections, the concept of restitution based on a balance sheet approach between exports and inputs has formed the basis of the reasoning for mineral fertilisation of crops.
The “availability” of the least mobile soil nutrients (P, K, Ca, Mg…), and most trace elements, was estimated by determining “threshold values” from soil analyses. They are supposed to reflect the capacity of plants to take up each of the elements, independently of each other, according to their more or less strong interactions with the mineral matrix of the soil. However, this predictive approach is still subject to considerable uncertainty. It often results in providing “more than necessary” to be “sure of having enough” due to farmers’ aversion to the risks of not achieving the potentially possible yields, leading to a generalized excess of fertilization.
The limitations of the response curve approach are twofold:
- The “availability” of the elements is considered separately for each of them, ignoring at the same time the interactions and co-limitations between elements;
- The “availability” of the elements is only considered as a variable external to the plant. The “availability” of the elements is considered only as a variable external to the plant. It is seen as resulting solely from the local physico-chemical properties of the soil, excluding the influence of the other components of the system, the plant itself and the biological compartment of the soil.
This linear vision of “fertilizer supply – soil availability – crop response“ proved to be too simplistic. The reality of the “soil-plant-microorganisms” system is actually more complex. Within it, many feedbacks also determine the actual availability of nutrients to plants. This availability cannot therefore be completely predicted a priori. On the contrary, it must be considered as the result of the internal dynamics of the system and as the expression of its emergent properties.
At the same time and in parallel, research in functional ecology, guided only by an understanding of the functioning of plant cover in natura, has developed the concept of co-limitation between environmental factors [3], [4]. This concept implies important links between the various limiting factors N, P, K, trace elements and water. It is therefore closer to Liebscher’s vision than to Liebig’s. It makes it possible to formally explain the many interactions and feedbacks that come into play in the functioning of the plant-soil system.
In conclusion:
- The linear and normative approach to mineral fertilisation of crops appeared sufficient as long as its sole objective was crop yield.
- However, as soon as environmental quality has become an objective of equal importance to yield, the uncertainty of “prognoses” leading to over-fertilisation is no longer acceptable.
- A more precise approach based on a better knowledge of ecosystem processes that will make it possible to avoid excesses is therefore becoming indispensable.
3. Availability of minerals in the soil
In order to be absorbed by plant roots, mineral elements must be present in the soil solution (ion-laden water that circulates in the open spaces or pores of the soil). Physico-chemical interactions exist between the different ionic forms of minerals, as well as with the mineral matrix and soil colloids (clays and organic matter):
- They determine the dynamic equilibrium between pools of soil solution elements immediately available to plants and less available pools more or less adsorbed on the matrix and colloids.
- The shift in balance between the pools of increasing availability will be more or less rapid depending on the pH, and the clay and organic matter content of the soil.
The availability of each of the mineral elements in a soil for crops can be determined from soil analyses. This makes it possible to predict the capacity of the soil to replenish the mineral pool of the solution as the plant removes it.
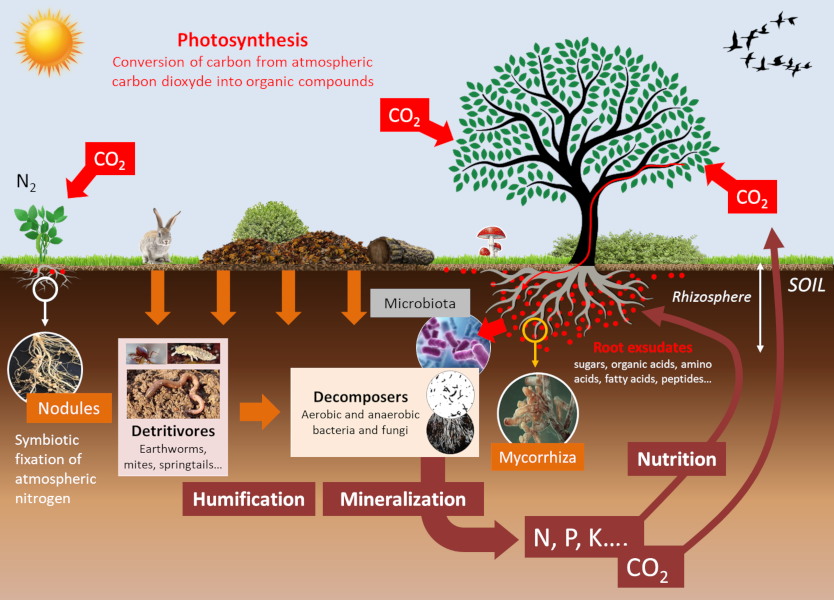
Soil living organisms influence the mineral availability of the soil. These communities of organisms, such as microbiota and micro- and macro-fauna, establish multiple trophic competitions among themselves (See Collembola: actors of soil life). As a result, the composition of these communities is modified, leading to changes in the availability of nutrients for plants. These events occur in a particular area of the soil, the rhizosphere, which is formed and influenced by roots and associated microorganisms (see Figure 6). These balances determine the availability of mineral elements in the rhizosphere, which, in a feedback loop, change the trophic balance of the soil.
In addition to their direct effects, physico-chemical parameters influence communities of soil organisms that strongly modulate the availability of minerals for plant nutrition (see Figure 6):
- For example, basic soil pH and fertilization with nitrogen or phosphorus fertilizers negatively affect the level of mycorrhization of roots by arbuscular fungi
- On the other hand, the increase in the amount of iron absorbed by plants that are highly efficient at absorbing iron depends on the concentration of organic matter and phosphate in the soils on which these plants are grown [5].
3.1. Importance of mycorrhizae and microbiota for plant nutrition
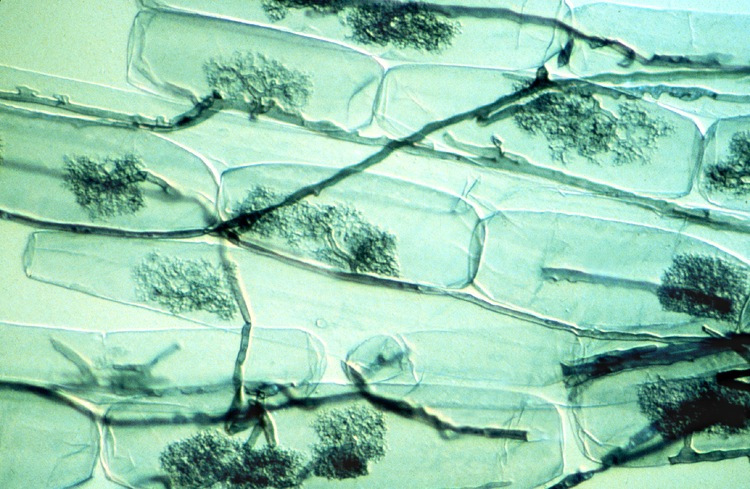
Arbuscular mycorrhizae are known to significantly improve plant phosphorus nutrition from the free orthophosphate ions, H2PO4 and HPO4 (noted Pi) from soil solution. Phosphorus is often limiting to plant growth because Pi represents only a very small fraction of total soil phosphorus, most of it being in organic form. On the other hand, a depletion zone in Pi is quickly created around the root uptake zone. The ability of plant species to explore new areas containing more Pi in solution is therefore a nutritional advantage. In this context, mycorrhizal symbioses improve plant phosphorus nutrition [7]. Indeed, the small diameter of mycelial hyphae (on average 10 μm) combined with their length, which can represent up to 1 m per millimetre of root, explains the better phosphorus nutrition of mycorrhizal plants compared to non-mycorrhizal plants.
The improvement of plant nitrogen nutrition by mycorrhizae has been shown in simplified experimental systems, but this effect does not seem to be as clear-cut as in the case of phosphorus. In any case, mycorrhizae do not supply nitrogen to plants with the same efficiency as Rhizobium-type nitrogen-fixing bacteria when they establish a symbiosis with the roots of legumes (alfalfa, peas, beans, etc.) (see Figure 6).
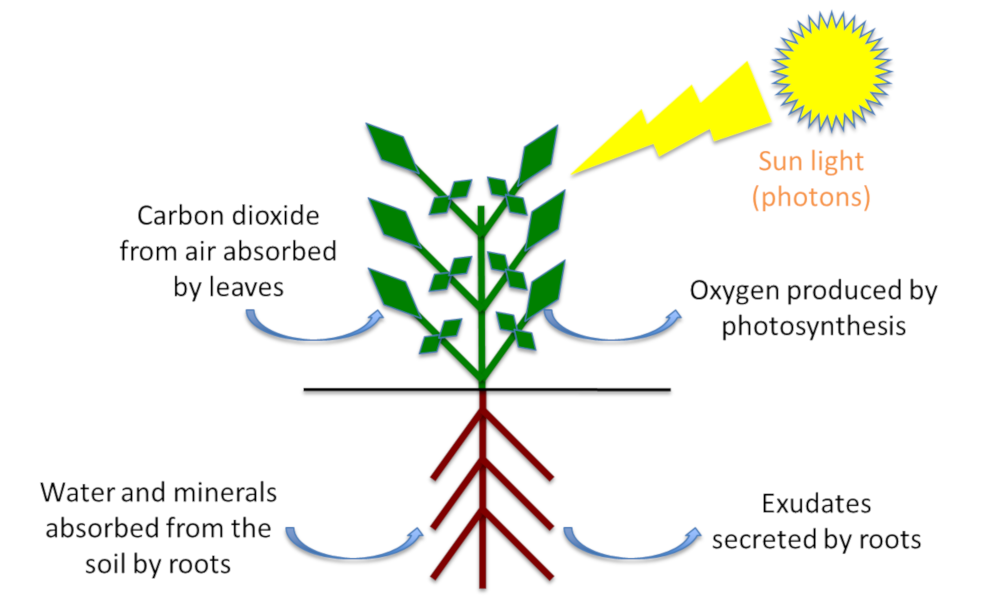
A significant part of the carbon fixed by the leaves through photosynthesis is secreted by the roots into the rhizosphere in the form of organic molecules [8]. These root exudates represent between 5 to 30% of the products of photosynthesis, i.e. between 1 and 3 tons of C/ha/year (see Figure 6). They feed a large microbial community at the soil-root interface: the root microbiota [9]. The root microbiota contains plant pathogens but also symbiotic microorganisms that help plants in their acquisition of water and minerals. Plants have the capacity to change their root environment and consequently modify their microbiota (See focus Webseries “La plante en kit“, episode 5 “La racine”, in French). This aspect has been well documented in the case of iron nutrition in plants. It has indeed been shown that plants that are more efficient than others in the acquisition of iron by the roots deplete their rhizosphere for this metal. This results in a modification of the composition of the root microbiota of these plants by a counter-selection of specific bacteria of the class of fluorescent Pseudomonas, better adapted to an iron-poor environment, and beneficial to plant health.
3.2. Interactions between soil organisms in the service of plant nutrition
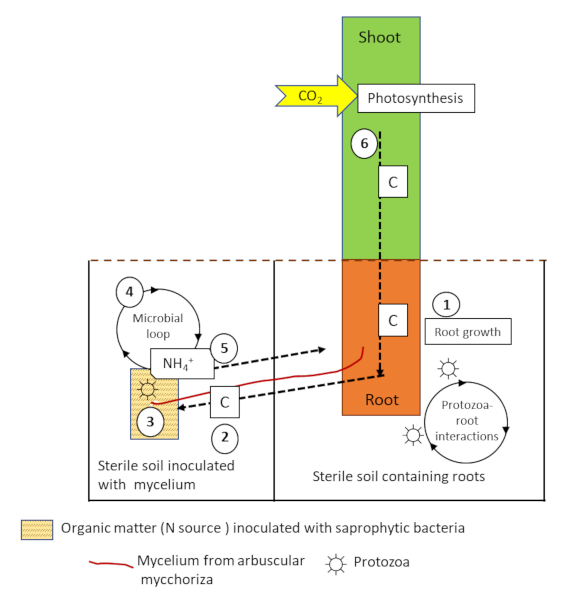
Protozoa and nematodes feed on the bacteria and mycelium of the mycorrhizae, releasing mineral nitrogen into the soil. This mechanism, known as the microbial loop [10], leads to changes in the composition of microbial communities and soil mineral nutrient fluxes (Figure 8). These interactions between protozoa, arbuscular mycorrhizae and roots lead to increased biomass and N accumulation in plants in the following process:
- The addition of protozoa to the soil containing the roots stimulates photosynthesis, carbon fixation from CO2, and the flow of carbon to the roots ;
- The increase in carbon flux will also increase the soil prospecting activity of the mycelial hyphae;
- Saprophytic bacteria are able to mineralize nitrogen from the organic matter patch;
- Protozoa feeding on the mineralizing bacteria (the microbial loop) will excrete ammonium (NH4+) into the medium;
- NH4+ will then be absorbed by the mycorrhizal fungus and transferred to the plant;
- The additional nitrogen will stimulate photosynthesis and plant growth, inducing a positive feedback leading to an increase in carbon allocation to the roots and fungal cells.
Soil organic phosphorus, mainly phytate (myo-inositol hexaphosphoric acid: C6H18O24P6), is not absorbed by the mycelium of mycorrhizal fungi. On the other hand, it can recruit certain bacteria that secrete enzymes capable of mineralizing it, called phytases. Pi will then be absorbed by the mycelium and eventually by the plants.
4. How do plants absorb minerals?
4.1. Acquisition of minerals by roots and distribution in the plant
![]()
Mineral ions can diffuse into the cell wall, called apoplasm, according to a concentration gradient, but when they reach the centre of the root, they encounter a cell barrier called the Casparian strip and diffusion can no longer be passive (Figure 9). The passage of ions, free or complexed to organic molecules, therefore requires at this level a facilitated diffusion involving transmembrane ion transport proteins (Figure 10).

- ion channels, very specific to one or a few ions, extremely fast and with regulation of their opening and closing. When open, the ion channels are crossed by the ions according to their electrochemical gradients (difference between the membrane potential of the cell and the equilibrium potential of the ion in question). Potassium uses this type of transport;
- transporters, which change their structure to move minerals from one side of the membranes to the other. Transporters differ from channels in that it is no longer the electrochemical gradient of the molecules that ensures ionic movement but the coupling of the transport to an exergonic enzymatic reaction, such as the hydrolysis of ATP. The movement of the molecule thus becomes unidirectional and can even occur against the electrochemical gradient. Transport using this type of protein is saturable and slower than with channels. Nitrogen, in the form of nitrate or ammonium, phosphorus in the form of phosphate and sulphur in the form of sulphate are transported in plants by this type of protein. Some metals such as iron or zinc can be complexed to small organic molecules to be taken up by certain transporters. Plants can also secrete organic molecules to take up metals outside the roots and carry them to their transporters.
Mineral transport proteins are positively or negatively regulated at several levels in order to absorb more or less of them, depending on their availability in the soil and the demand of the plant:
- Genetic regulation of the expression of genes encoding transport proteins is adapted to the concentration of minerals available in the soil.
- Topography of transport proteins, i.e. their precise location in the cell, is essential to their function.
- Long-distance signalling is necessary to regulate root transport proteins: the growth rate of the aerial parts of the plant defines its demand for mineral elements. Depending on this demand, signals (small organic molecules) are emitted by the leaves and transported to the roots. There, they provoke the positive or negative regulation, according to the plant’s needs, of the mineral transporters.
4.2. Interactions between minerals and plant mineral nutrition
Different mineral ions of opposite charges interact in the soil. Many of them are then less mobile and become less available to feed plants. This has negative effects on their growth and development. These interactions also exist within plants. However, we do not yet know how they control plant growth.
The perception of soil nutrient availability by plants allows them to adapt to this availability. It has been studied separately for different nutrients. However, the interaction between the homeostasis of different nutrients is a general rule and stoichiometric ratios between mineral elements are actively maintained in plants. Plant responses to simple stresses (deficiency of a single mineral element for example) or combined stresses (simultaneous deficiencies of several elements) involve different genetic programs. The study of the effect of combined stresses on plant growth reveals “emergent properties” that cannot be detected by studying the effect of each element in isolation.
Thus, there are strong relationships between plant responses to different nutrients taken in pairs. For example:
- In the case of a zinc deficiency there is an increase in phosphate concentration;
- Single iron deficiency, known to decrease chlorophyll accumulation in leaves, does not have this effect in a double deficiency of iron and phosphate;
- Root growth under phosphate deficiency conditions also depends on the availability of other nutrients such as nitrogen.
5. Towards integrated and reasoned crop fertilization: dialogue between biology and agronomy
5.1. An essential concept for improving fertilization: nitrogen dilution
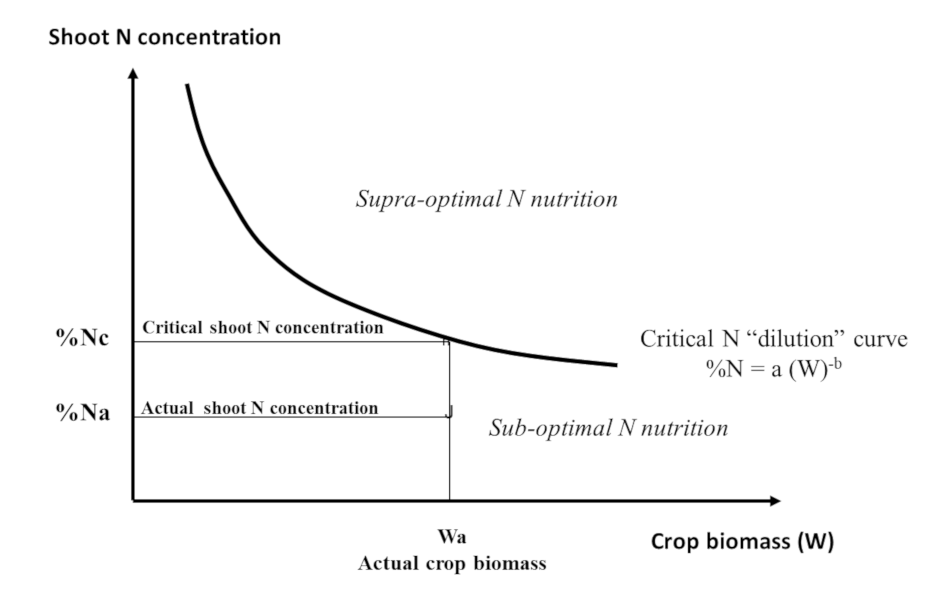
Nc = aWcb (1)
The value of coefficient “a” represents the minimum amount of nitrogen that the crop must absorb to produce a biomass of W = 1 t/ha. The coefficient “b” which is <1 indicates that the amount of N required to produce the following units of biomass decreases as the biomass of the crop increases.
This translates into an expression of the decrease in the plant’s nitrogen concentration (%N) during crop growth, a phenomenon called “nitrogen dilution”:
% Nc = a/10 Wcb-1 (2)
The factor 1/10 is used to express % Nc as a percentage of dry matter. Thus, an interpretation of the plant nitrogen concentration at a given time in a given crop (% Na) can be made with reference to a critical value (% Nc) calculated using Equation (2).
This is achieved by means of a nitrogen nutrition index INN = % Na / % Nc:
- an INN value of less than 1 (% Na being below the critical curve) indicates and quantifies a nitrogen nutrition deficit of the crop;
- an INN value greater than 1 (with % Na above the critical curve) quantifies excess or “luxury” nitrogen consumption (Figure 11). [14]
This allometric relation of Equation (1) actually translates the co-regulation of nitrogen removal by:
- the availability of mineral nitrogen in the soil;
- the growth dynamics of the plant itself according to the root uptake feedback control mechanisms described in § 4.
5.2. Biological and agronomic significance of nitrogen dilution
How can we functionally interpret this dilution of nitrogen during plant growth observed in all species? Several phenomena contribute to this dilution:
- Plants are essentially composed of two types of tissue:
- photosynthetic leaf tissues rich in nitrogen [15] which capture light and assimilate CO2 (N concentration of 4 to 5%);
- Supporting tissues that are used for plant architecture and are poor in nitrogen (N concentration of 0.5 to 0.7%).
- As the plant increases in size, the mass growth of the support tissues increases faster than that of the leaf tissues. This is all the more accentuated when the plant is in a dense plant canopy in which it has to grow more in “height” and “thickness” to be able to position its leaf surfaces in the lit strata.
- The mass of nitrogen-rich ‘metabolic’ tissues (leaf surfaces) therefore increases relatively less rapidly than the mass of nitrogen-poor ‘supporting’ tissues as the canopy develops.
- In addition, the nitrogen contained in shaded leaves is not very efficient for photosynthesis in low light conditions. It is recycled back into the plant in the young, well-lit leaves at the top of the canopy.
The result of this set of architectural adaptation phenomena for access to light is that the plant’s elementary nitrogen demand, dN, to develop an additional unit of biomass, dW, decreases as the plant allocates an increasing proportion of its biomass to nitrogen-poor “support” tissues. This results in a “nitrogen dilution” generated by the growth of the plant canopy. This is an emerging property of the plant population competing for the light that a crop provides.
This emergent property is therefore determined by the crop biomass. Consequently, to compare the mineral nutrition status of two crops, their difference in biomass must be taken into account. This is equivalent to comparing them to equivalent biomass (W)b (see Equation 1), which represents the metabolic compartment of the plant [16]. The homeostasis of plant nitrogen nutrition (i.e. the ability of a plant to maintain a constant nutritional state) is therefore not achieved at the scale of the whole plant, but of its metabolic compartment only.
Similarly, nutrition indices K or S (INK and INS) can also be determined. The availability of each element to the plant is therefore dependent on the plant’s ability to grow. However, each element can be limiting for the growth of the plant. There is therefore a strong interdependence between the different elements that must be taken into account in a global diagnosis of mineral nutrition. For example, a nitrogenous fertilization contribution resulting in an increase in plant growth increases at the same time its demand for P or K. The availability of P and K can thus prove to be insufficient, which was not the case in the absence of nitrogen supply.
In conclusion, this new approach for in situ diagnosis of mineral nutrition in crops is based on critical concentration curves that make it possible to erase the “dilution effects” caused by differences in crop biomass.
- It frees itself from the uncertainties associated with forecasts based solely on the physico-chemical component of the soil;
- INN, INP, INK or INS diagnostics… integrate de facto local variables. They make it possible to reveal the nutritional status of plants within a crop;
- According to this state, revealed by the <1 or >1 value of this index, a decision of correction by fertilization can be taken;
- The development of such diagnostic tools should enable farmers to make corrective inputs only in the event of a proven nutritional deficiency in the crop. This should limit “precautionary” fertilization excesses that are harmful to the environment.
6. Messages to remember
- Plants absorb mineral elements from the soil through membrane proteins in their roots. The minerals are then distributed in the plant by the sap carried in the conducting vessels.
- The absorption of minerals from the soil depends on their availability. This is determined by the physico-chemical parameters of the soil and by the interactions between the soil, the microorganisms it contains and the plants.
- Plant growth determines their demand for minerals and in turn controls their absorption. This regulation involves long-distance signalling from the leaves to the roots.
- The transport of mineral elements and the fertilization of crops have long been considered element by element. Crop fertilization was then based on soil analyses that (a) did not take into account the interactions between elements and (b) considered the availability of elements as a variable external to the plant.
- During its growth, the plant maintains its homeostasis only in the “metabolic” compartment (leaf surface) that determines its growth. But it is obliged to invest in its architecture (supporting tissues poor in N, P, K…) in order to have access to light. The dilution of mineral elements is therefore determined by the indispensable allometry between “metabolic tissues” (surface) and “support tissues” (height, thickness). The “larger” the plant is, the more support tissues it needs in relation to the metabolic tissues…
- The recent evolution of fertilization is based on this concept of dilution curves. They make it possible to overcome the dilution effects caused by differences in crop biomass. They should encourage the use of mineral fertilizers only in the case of a proven nutritional deficit, and thus limit excess fertilization that is detrimental to the environment.
References and Notes
Cover image. [Source : https://www.pxfuel.com]
[1] Morot-Gaudry, J.F., Moreau, F., Prat, R., Maurel, C. & Sentenac, H. (2017). Biologie Végétale : Nutrition et Métabolisme. Dunod. Paris, France. (in French)
[2] Lemaire, G. (2020). La fertilisation des cultures : des bases scientifiques renouvelées. Les mots de l’Agronomie. (in French)
[3] Bloom, A.J., Chapin, F.S. & Mooney, H.A. (1985). Resource limitations in plants – An economic analogy. The Annual Review of Ecology, Evolution, and Systematics, 16, 363-392.
[4] Kho, R.M. (2000). On crop production and the balance of available resources. Agriculture, Ecosystems and Environment, 80, 71-85
[5] Robin, A., Vansuyt, G., Hinsinger, P., et al. 2008. Iron dynamics in the rhizosphere: consequences for plant health and nutrition. Advances in Agronomy, 99, 183-225.
[6] Brundrett, M.C. (2008). Mycorrhizal Associations: The Web Resource.
[7] Duponnois, R., Sanon, A., Hafidi, M., Ndoye, I. & Bâ, A. M. (2013) Généralités sur la symbiose mycorhizienne : introduction. (in French)
[8] Agriculture de conservation des sols.com. Exsudats racinaires : l’essence même des sols. (in French)
[9] Deveau, A. & Martin, F. October 26, 2016. Microbiote : les plantes aussi ! Pour la Science N° 469. (in French)
[10] Plassard, C., Robin, A., Le Cadre, E., Marsden, C., Trap, J. et al. (2015) Améliorer la biodisponibilité du phosphore: comment valoriser les compétences des plantes et les mécanismes biologiques du sol. Innovations Agronomiques, INRA, 43, pp.115-138.
[11] Mineral Nutrition. To be found on our article “The path of carbon in photosynthesis“.
[12] Lemaire G. & Salette, J. (1984). Relationship between growth dynamics and nitrogen removal dynamics for a forage grass stand. I- Study of the effect of the environment. Agronomy, 4, 423-430.
[13] In developmental biology, allometry is the analysis of relative growths between organs, tissues or processes of a living organism.
[14] Lemaire, G., Jeuffroy, M.H. & Gastal, F., 2008. Diagnosis tool for plant and crop N status in vegetative stage: theory and pratices for crop N management. Eur. J. Agron. 28, 614–624.
[15] Thanks to the presence of the RubisCO, the most abundant protein of the leaf (it represents by mass almost half of the leaf proteins) and the main organic nitrogen reserve of the leaves (see Focus “RubisCO“)
[16] For plants, this concept corresponds to that of “metabolic weight” used in animal nutrition.
[17] Lemaire, G., Sinclair, T., Sadras, V.O. & Belanger, G. (2019). Allometric approach to crop nutrition and implications for crop diagnosis and phenotyping: A review. Agronomy for Sustainable Development.
[18] Salette, J. & Huche, L. (1991) Diagnostic de 1’état de nutrition minérale d’une prairie par l’analyse minérale du végétal: principes, mise en oeuvre, exemples. Fourrages, 125, 3–18. (in French)
The Encyclopedia of the Environment by the Association des Encyclopédies de l'Environnement et de l'Énergie (www.a3e.fr), contractually linked to the University of Grenoble Alpes and Grenoble INP, and sponsored by the French Academy of Sciences.
To cite this article: BRIAT Jean-François, LEMAIRE Gilles (January 5, 2025), How to feed plants while polluting less?, Encyclopedia of the Environment, Accessed July 21, 2026 [online ISSN 2555-0950] url : https://www.encyclopedie-environnement.org/en/life/how-to-feed-plants-while-polluting-less-2/.
The articles in the Encyclopedia of the Environment are made available under the terms of the Creative Commons BY-NC-SA license, which authorizes reproduction subject to: citing the source, not making commercial use of them, sharing identical initial conditions, reproducing at each reuse or distribution the mention of this Creative Commons BY-NC-SA license.