

如何在满足植物营养需求的同时减少污染?
是否有可能在不损害环境的同时给作物施肥?这是我们社会环境问题的核心,但是并没有简单的答案。植物的生长、生存和繁殖都需要矿物元素,而这些元素主要通过根系从土壤中获取。然而,土壤中矿物元素的可用性变化极大,取决于土壤的物理化学性质、土壤中的众多微生物和植物自身的生物学性质之间的相互作用。了解这些现象可为作物矿质肥料施用的农艺实践提供基础。直到最近,作物营养都只考虑一个元素,并且是根据预测的产量确定施肥量,导致经常过量施肥,有时会危害环境。如何通过更精准的调整投入达到更高效的施肥,从而实现污染更少的更综合的施肥措施?
1. 植物必需的矿物质
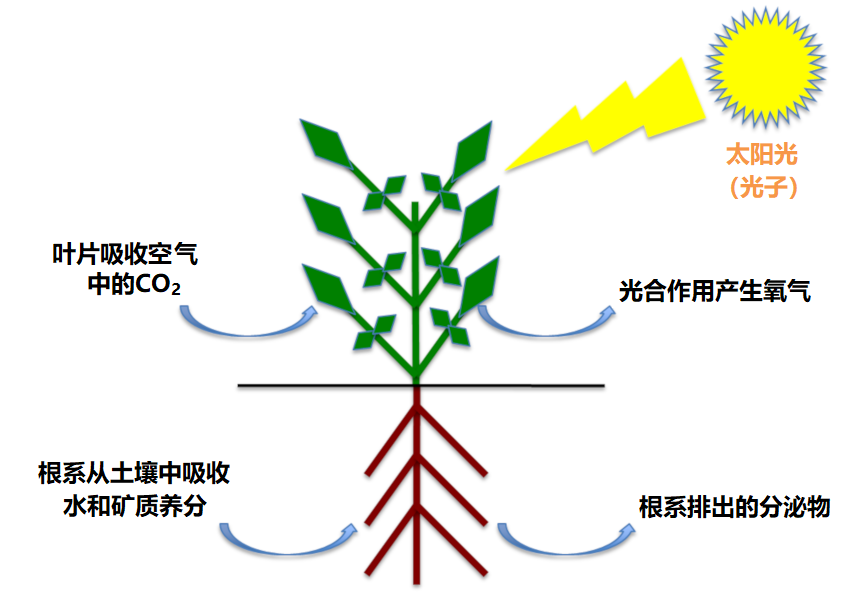
碳占植物干物质的40%,它来源于叶片通过光合作用从空气中吸收的二氧化碳(参见“光合作用的碳代谢途径”)。氧是是植物的第二大组成元素,占植物干物质的45%,植物体内的氧主要来自于根系从土壤中吸取的水分。植物也是许多矿物质进入生物圈的主要途径,它们主要由植物从土壤中吸收(图1)。虽然这些矿物质只占植物干重的10%~20%,但是对植物的生命必不可少。
19世纪初化学的进步为明确植物的矿物质组成提供了契机。1860年,德国生理学家普费弗(Pfeffer)、萨克斯(Sachs)和诺普(Knop)(参见:矿质营养学的先驱)发现,只要向水中添加大约15种必需的矿物质元素,植物就可以在惰性基质上生长,这些元素以带正电荷(阳离子)或负电荷(阴离子)离子的形式被植物吸收。这些栽培植物的技术不使用固体基质,而将植物的根部直接浸泡在营养液中,这是水培技术的起源。水培技术采用不断更新营养液的方式,一般将植物固定在沙子或玻璃珠等惰性基质上,而不使用土壤。
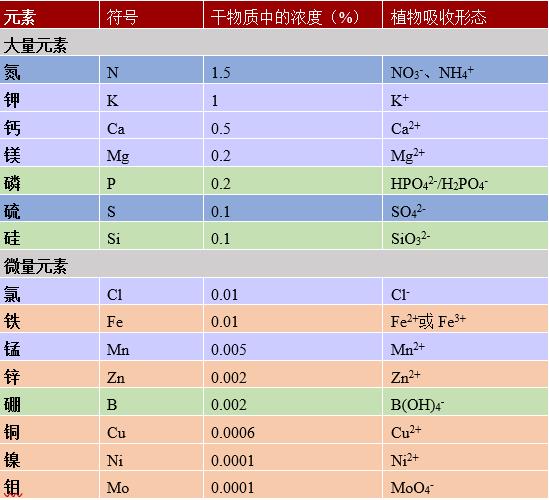
根据其在植物体内的相对丰度,可将植物必需的矿物质离子分为两类:大量元素和微量元素(表1)。
- 大量元素又称为主要元素(N、P、K、S、Ca、Mg),至少占植物干物质的0.1%,一般不超过其2%。
- 微量元素(Mn、Zn、Cu、Fe、Ni、Cl、B、Mo),也称痕量元素,占植物干重的比例微乎其微(从0.01%到0.00001%),但是对植物生理功能具有重要作用。
表1. 植物的大量元素和微量元素。表中显示了这些元素在植物干物质中的浓度(%)以及被植物吸收的形态。
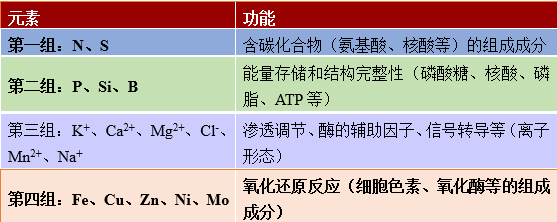
各种元素发挥着各种各样的功能(表2):
- 氮、磷、硫等矿物质离子被植物吸收,成为组成生物有机体的有机分子(核酸、氨基酸、脂类等)。
- 有机分子中的氧会形成带负电荷的官能团(如羧基、磷酸基),而氮产生能形成正电荷基团(胺类)。生物分子中氧原子的数量远远超过氮原子的数量,因此这些分子大多携带净负电荷。有机分子的这种负电荷需要大量K+、Ca2+、Mg2+等无机阳离子存在才能达到电荷平衡。
- 钾是植物细胞质中含量最丰富的无机阳离子,它控制着植物的膨压(细胞内部对细胞壁的压力)和水势(水离开某一给定隔室的潜势)。因此,钾参与控制细胞的伸长和生长,调控气孔的开闭。
- 矿质元素也参与细胞的能量存储,是许多酶促反应的辅助因子。例如,镁是叶绿素的核心(参见叶片的颜色);一些蛋白质的铁硫中心和铁血红素参与了细胞的氧化–还原过程以及光合链和呼吸链的电子转移 [1]。
表2. 矿质元素在植物体内的功能。
矿物质离子的上述功能对植物体机能的维持至关重要。为了发挥最佳功能,离子浓度必须位于一个理想的范围:过低会不足以满足植物需求,太高会导致毒性(图2)。每种植物的理想浓度范围不同,水培植物营养液中氮和钾的理想浓度大约是100~200毫克/升,磷是30~80毫克/升,铁是2~12毫克/升,锰是0.5~2毫克/升。
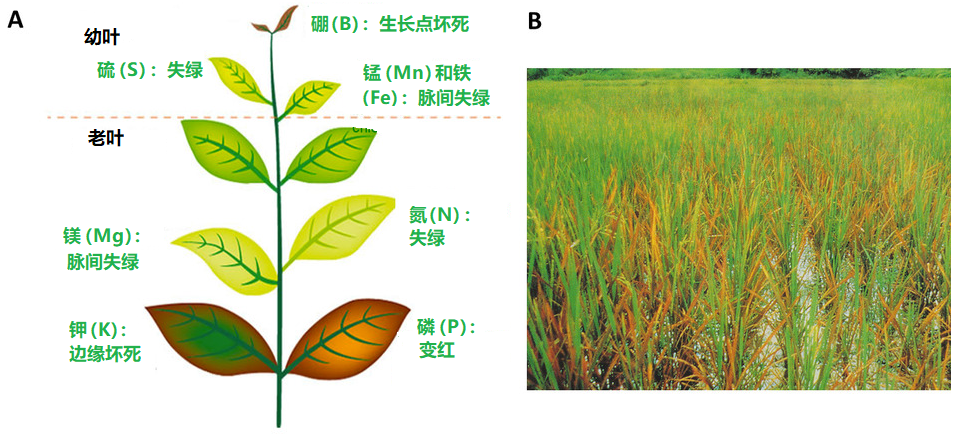
养分不足或过量都会改变植物的生理机能,导致生物生产力下降,极端情况下可能会死亡。因此,植物体内的矿物质元素浓度稳定极其重要,因此随着土壤中养分离子可利用性的变化,植物通过基因表达的调控,主动改变根系对矿质养分的吸收能力(见第3和第4部分)。
2.植物营养的研究历史及其局限性
农作物施用矿物质肥料是向土壤中添加某些矿质元素,以达到:
- 补充土壤中缺乏的营养元素,打破其对植物生长和作物产量的限制;
- 定期向土壤补充被作物吸收带走的元素,以长期维持土壤肥力。
可以施用含有矿物质元素的粪肥或堆肥等有机肥,经过微生物的矿化作用将矿物质养分释放到土壤中(见图6);也可以施用不同离子形态的矿物质肥料。对于植物来说,这两种肥料形式没有根本区别,因为这些矿物质都以相同的离子形式被植物吸收(见第1部分)。
作物矿物质营养研究的基础是李比希(Liebig)的“最小因子律”(1855):“植物生长受最缺少的那种养分控制”,这也称为“限制因子律”,由此引申可以得出:随着最为不足的因子被改善,另一个因子就会成为限制植物生长的制约因素,依次类推,而这些限制性因子彼此独立。作物对化肥投入的响应可以分为三个阶段(图3)[2]:
- 阶段1:与其他因子水平无关的线性响应;
- 阶段2:响应递减,响应程度是其他因子水平的函数;
- 阶段3:无响应,另一个因子限制了作物产量。
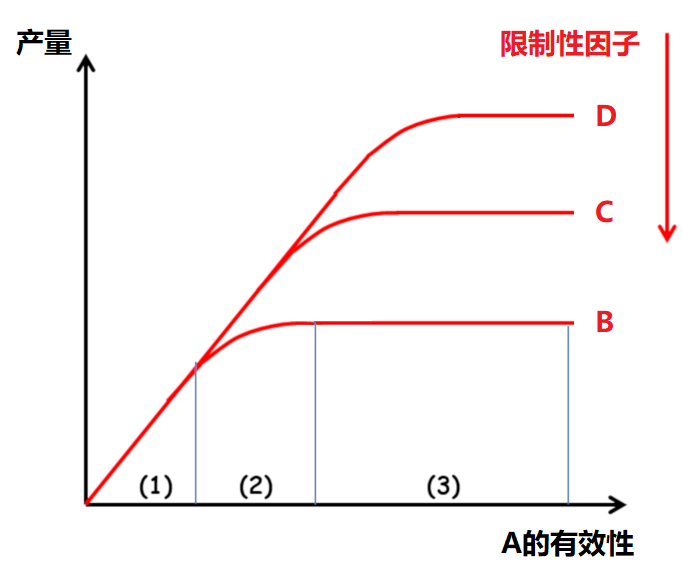
[图片来源:改编自Lemaire,参见[2]]
这一思想可以用Mistcherlich定律(1924)来表达。该定律指出,“随着投入量的增加,植物对该因子的响应程度逐渐降低,最终到达平台期”,这是作物施肥研究的概念框架。
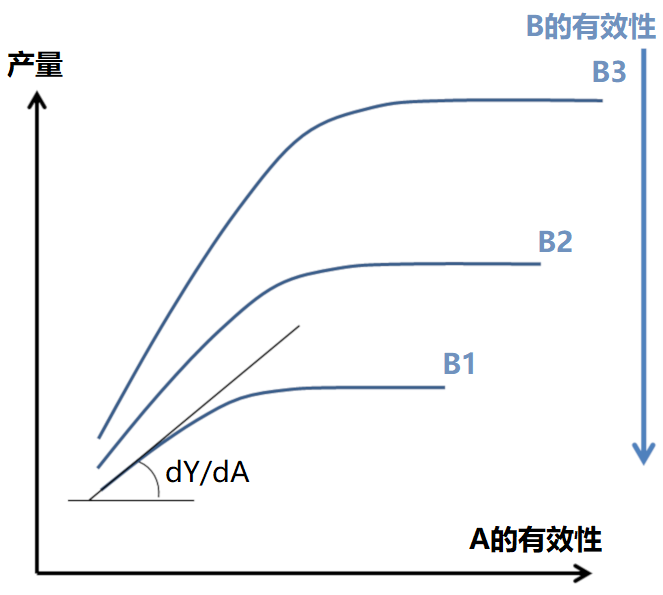
实际上,早在1885年,利布舍尔(Liebscher )提出了一个更完整的表述,即最佳定律:“当限制性因子的供应水平越接近其最佳水平,植物对各种养分的利用效率越高”(图4)。这一思想为分析元素之间的相互作用铺平了道路,超越了李比希定律中简单的“有或无”效应。然而,利布舍尔的思想几乎很大程度上被忽视了,导致此后的研究非常分散,大多仅仅分别探讨植物对氮、磷、钾等主要元素以及微量元素的响应。
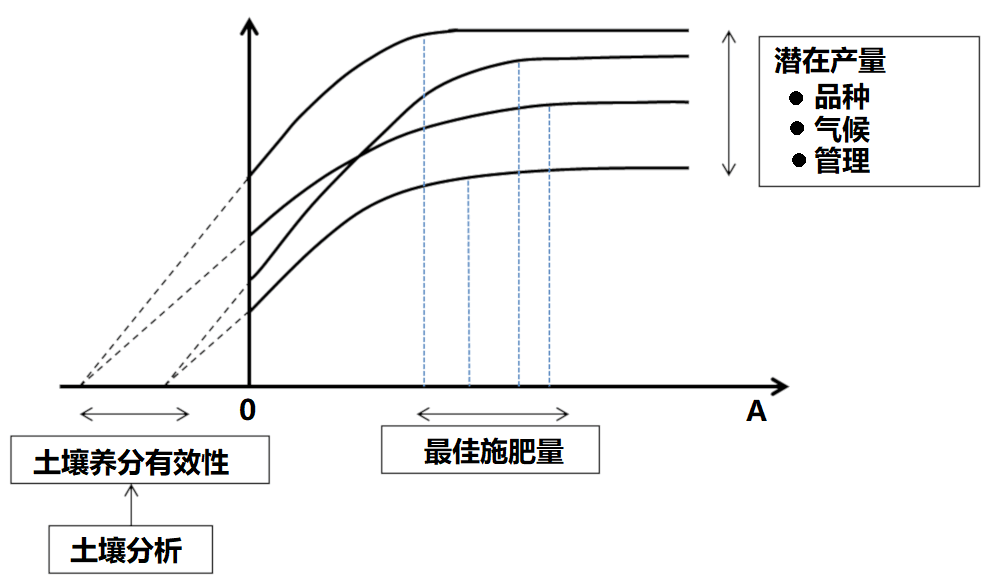
利用统计学工具分析作物对增加养分投入的响应曲线是1950-1990年农学研究的基础。研究发现,这些曲线的变化很大(图5),因此根据这些曲线得出的推荐施肥量存在很大的不确定性:
- 分析不同养分物质与土壤矿质基质之间的物理化学相互作用,可以量化土壤中养分元素的数量多少。
- 因此,“土壤诊断”(土壤分析)可以为作物提供“营养预测”,以及通过施肥改善作物营养的可能性提供重要信息。
- 除此而外,基于输出量和投入量的养分平衡表,用施肥补偿养分流失的理念已经成为矿质养分施肥的理论基础。
通过土壤分析,可以确定流动性最差的土壤养分(磷、钾、钙、镁等大量元素)和大多数微量元素的“有效性”“阈值”。各养分元素与土壤矿质基质间存在或大或小的相互作用,因此阈值反映的是植物对各元素的吸收能力,而植物对每种元素的吸收能力是相互独立的。然而,这种预测方法仍然存在相当大的不确定性。在实际应用中,由于农民不愿意出现无法达到潜在最大产量的风险,为了“确保有足够产量”,往往会“超量”施肥,从而导致普遍的施肥过量。
氮(N)和硫(S)在土壤中以硝酸盐(NO3–)和硫酸盐(SO42-)的形式存在,这也是植物可以吸收的有效形态,很难被土壤黏粒固持,这样的元素移动性很强,容易随排水带入地下水。氮还会以氨(NH3)或氧化亚氮(N2O)(一种温室效应很强的气体)的形式流失进入大气。这些流失是主要的环境污染源。因此,氮肥应该只在作物对氮肥的吸收率较高时施用,以避免氮素在土壤中过度累积。
响应曲线法的局限性有两个方面:
- 单独考虑各养分的“可用量”,忽略了养分之间的相互作用和共同限制;
- 养分的“可用量”仅被视为与植物无关的外部变量,仅仅取决于土壤的物理化学性质,而与土壤-植物系统的其他组分、植物及土壤生物无关。
这种“肥料施用–土壤有效性–作物响应”的线性观点被证明过于简单。实际上,“土壤–植物–微生物”系统复杂得多。在这个系统中,许多反馈作用也决定了植物实际可获取的养分。因此,养分可用量不能完全通过以前的知识先验性地预测,相反,必须将它视为系统内部动力学结果,是系统的涌现性特征。
在同一时期,为了理解自然界中植物盖度的作用,功能生态学研究提出了环境因子共同限制的概念[3]、[4],暗示氮、磷、钾、微量元素和水等各种限制因子之间存在重要的联系。因此,这更接近利布舍尔的观点,而与李比希的观点不同。这一理念使理解植物-土壤系统中的许多相互作用和反馈关系成为可能。
结论:
- 如果作物产量是唯一目标,那么线性和规范方法可能就足以指导对作物施用矿物肥料。
- 但是,如果我们将环境质量作为与产量同等重要的目标,那么由于“预测”的不确定性导致过度施肥就变得不可接受。
- 因此,必须发展在深入理解生态系统过程的基础上,发展更精准的方法,以避免过度施肥。
3. 土壤中矿物质的可用量
[图片来源:EEnv,改编自Salsero35 / CC BY-SA 4.0, 维基百科]
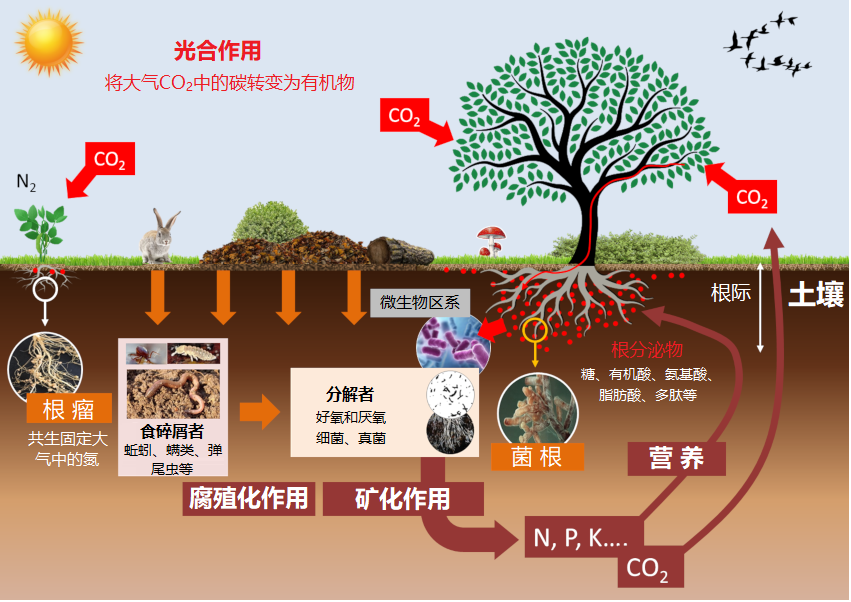
植物吸收矿质养分取决于其在土壤中的可用量,由一系列相互关联的动态平衡过程决定(图6)。
矿质元素必须在土壤溶液(溶解有离子的水,在开放空间或土壤孔隙中循环流动)中才能被植物根系吸收。不同形态的矿物质离子之间,以及矿物质离子与土壤矿质颗粒、土壤胶体(黏粒和有机质)之间存在着物理化学相互作用:
- 决定了存在于土壤溶液中的植物速效性养分库与被土壤基质和土壤胶体或强或弱地吸附的缓效养分库之间的动态平衡。
- 两类养分库之间的平衡变化速度快慢取决于土壤的pH值,以及黏粒和有机质含量。
通过土壤分析可以确定土壤中每种矿质元素对作物的可用性,进而预测在植物移除矿物质时后土壤回补养分的能力。
土壤生物会影响土壤中矿物质养分的有效性。这些生物群落包括土壤微生物区系、小型和大型土壤动物群等,它们构成了多重营养竞争(见弹尾虫:土壤生命的一员)。因此,土壤生物群落组成的变化必然导致植物养分性发生改变,这在特定的土壤区域——根际司空见惯。根际是由根系及相关微生物组成和共同影响的区域(见图6)。土壤中的各种动态平衡关系决定了根际矿质养分的可用性,后者又通过反馈回路改变土壤的营养平衡。
土壤的物理化学性质不仅直接影响土壤矿质养分对植物的有效性,还会通过影响土壤生物群落而间接控制养分有效性,这些生物群落是矿质养分有效性强有力的调控者(见图6):
- 例如,碱性的土壤pH值,或者施用氮、磷肥料都会抑制丛枝真菌与根系形成共生菌根。
- 对吸收铁效率高的植物而言,植物吸收铁的增量受土壤有机质和磷酸盐浓度的限制[5]。
3.1 菌根和微生物对植物营养的重要性
[图片来源:©L. Peterson版权所有]
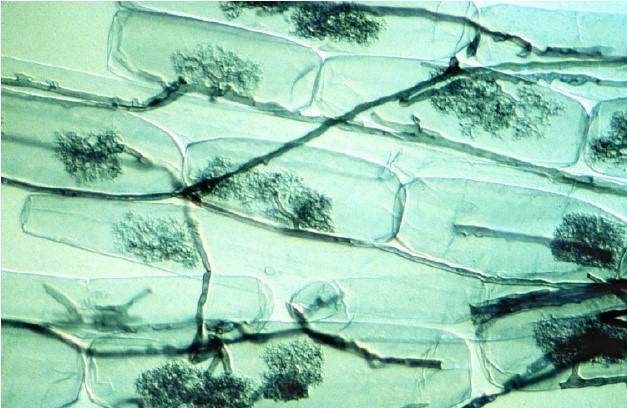
大多数具有农业价值的植物会与土壤中的球囊霉亚门真菌形成内生菌根,也称为丛枝菌根(图7)[6]。
众所周知,丛枝菌根可以帮助植物吸收土壤溶液中的游离正磷酸盐离子,即H2PO4–和HPO42-(称为Pi)而显著改善植物的磷营养。由于Pi只占土壤磷总量的很小一部分,并且主要由有机磷的形式存在,因此磷通常是植物生长的限制因素。随着植物的吸收,根系周围的土壤很快就会形成一个Pi消耗竭区。因此,植物物种探索土壤溶液中含有更多Pi的新区域的能力是一种营养优势。基于此背景,菌根共生能改善植物的磷营养[7]。的确,菌丝的直径更小(平均为10 μm),长度很长(每毫米根上的菌根长度1 m),因此菌根植物比非菌根植物具有更好的磷营养。
利用简化的实验系统已经证明菌根也有改善植物氮素营养的作用,但是效果似乎不像磷那样明显。无论如何,当菌根与苜蓿、豌豆、豆类等豆科植物建立共生关系时,菌根向植物提供氮的效率不如根瘤菌型的固氮细菌(见图6)。
通过叶片光合作用固定的碳,有相当一部分会通过根系以有机分子[8]的形式分泌到根际。这些根系分泌物占光合产物的5%~30%,即1~3吨C/(hm2 y)(见图6),养育了土壤-根系界面的巨大微生物群落:根系微生物区系[9]。这里既有植物病原体,也有帮助植物获取水和矿质营养的共生微生物。植物能改变它们的根环境,进而改变其微生物群落(参见焦点:网络系列“植物的工具箱”,第5集“根”,法语)。植物铁营养就是一个典型的案例,已有了详细记录。有确切的研究证据表明,能通过根部更高效获取铁的植物,会形成根周围的铁耗竭区。该区域又反向选择了荧光假单胞菌等更适应低铁环境的微生物,改变了植物根部微生物群落组成,这样的菌群结构有益于植物的健康。
3.2 与植物营养相关的土壤生物间的相互作用

[图片来源:© Plassard C. 和Briat J.F.]
除了上述的直接作用外,微生物区系中的细菌和菌根真菌也参与了氮和磷的矿化过程,生成的无机氮、磷最终被植物吸收(参见:什么是生物多样性?)
原生动物和线虫取食细菌和菌根真菌的菌丝,并将无机氮释放到土壤中,这一机制称为微生物食物环[10],它能改变土壤微生物群落组成和矿质养分通量(图8)。通过以下过程,原生动物、丛枝菌根和根系之间的相互作用能提高植物的生物量和氮积累:
- 在含有根系的土壤中添加原生动物,会刺激植物光合作用、提高CO2固碳的能力、促进碳向根系流动;
- 向根部分配更多的碳会提高共生真菌利用土壤的能力;
- 腐生细菌能将有机物中的氮矿化;
- 原生动物以有机质矿化细菌为食(微生物食物环),并向土壤中释放铵离子(NH4+);
- NH4+被菌根真菌吸收,并运输到植物中;
- 植物吸收氮的增加会刺激光合作用和植物生长,形成正反馈,进一步刺激向根和真菌细胞分配更多的碳。
土壤有机磷的主要成分是植酸(即肌醇六磷酸:C6H18O24P6),不能被菌根真菌的菌丝直接吸收,但是,有机磷会招引能分泌植酸酶的细菌,将植酸矿化释放出无机磷,Pi随后被菌丝、并最终被植物吸收。
4. 植物是如何吸收矿质养分的?
4.1 根系对矿质养分的获取及养分在植物体内的分布
[图片来源:EEnv]
根吸收矿质离子的机制很复杂。离子通过扩散作用从土壤中到达根部,然后被根通过径向运输从外层细胞进入位于根中心的中柱细胞。中柱包括将营养物质从根部输送到地上部分的木质部导管,以及负责从叶片向根部反向运输的韧皮部筛管。之后,养分离子通过与根内运输类似的方式分布到植物各处的细胞中[11]。
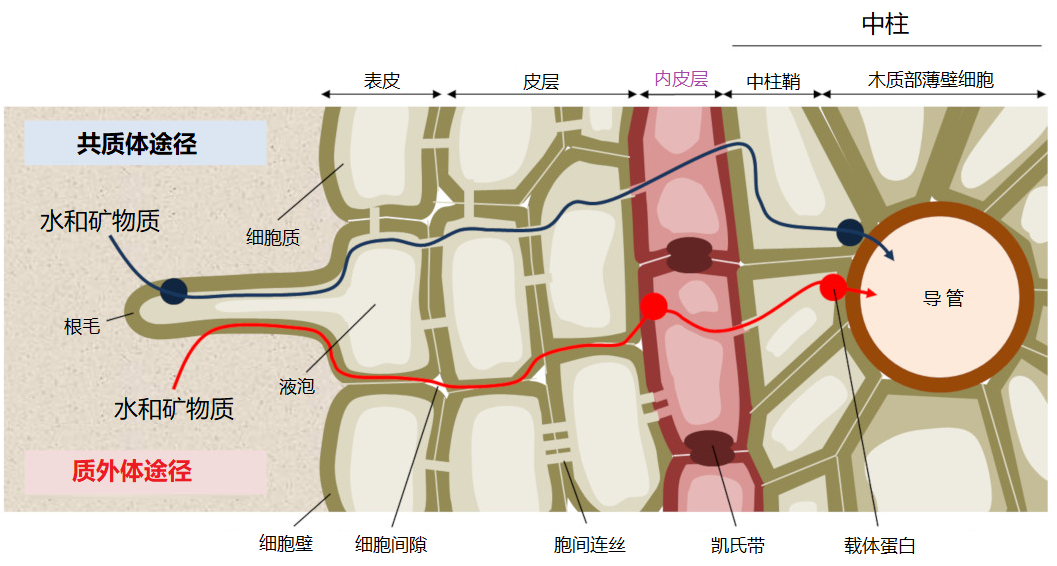
矿质离子可以顺着浓度梯度扩散进入细胞壁,细胞壁与细胞间隙合称为质外体。离子一旦到达根的中部,就会被一个称为凯氏带的细胞屏障阻隔,无法再通过被动扩散方式进入根的中柱(图9)。在这里,无论是自由离子还是与有机分子络合的离子,都需要借助于促进扩散的方法才能继续深入,这种方式需要跨膜的离子转运蛋白参与(图10)。
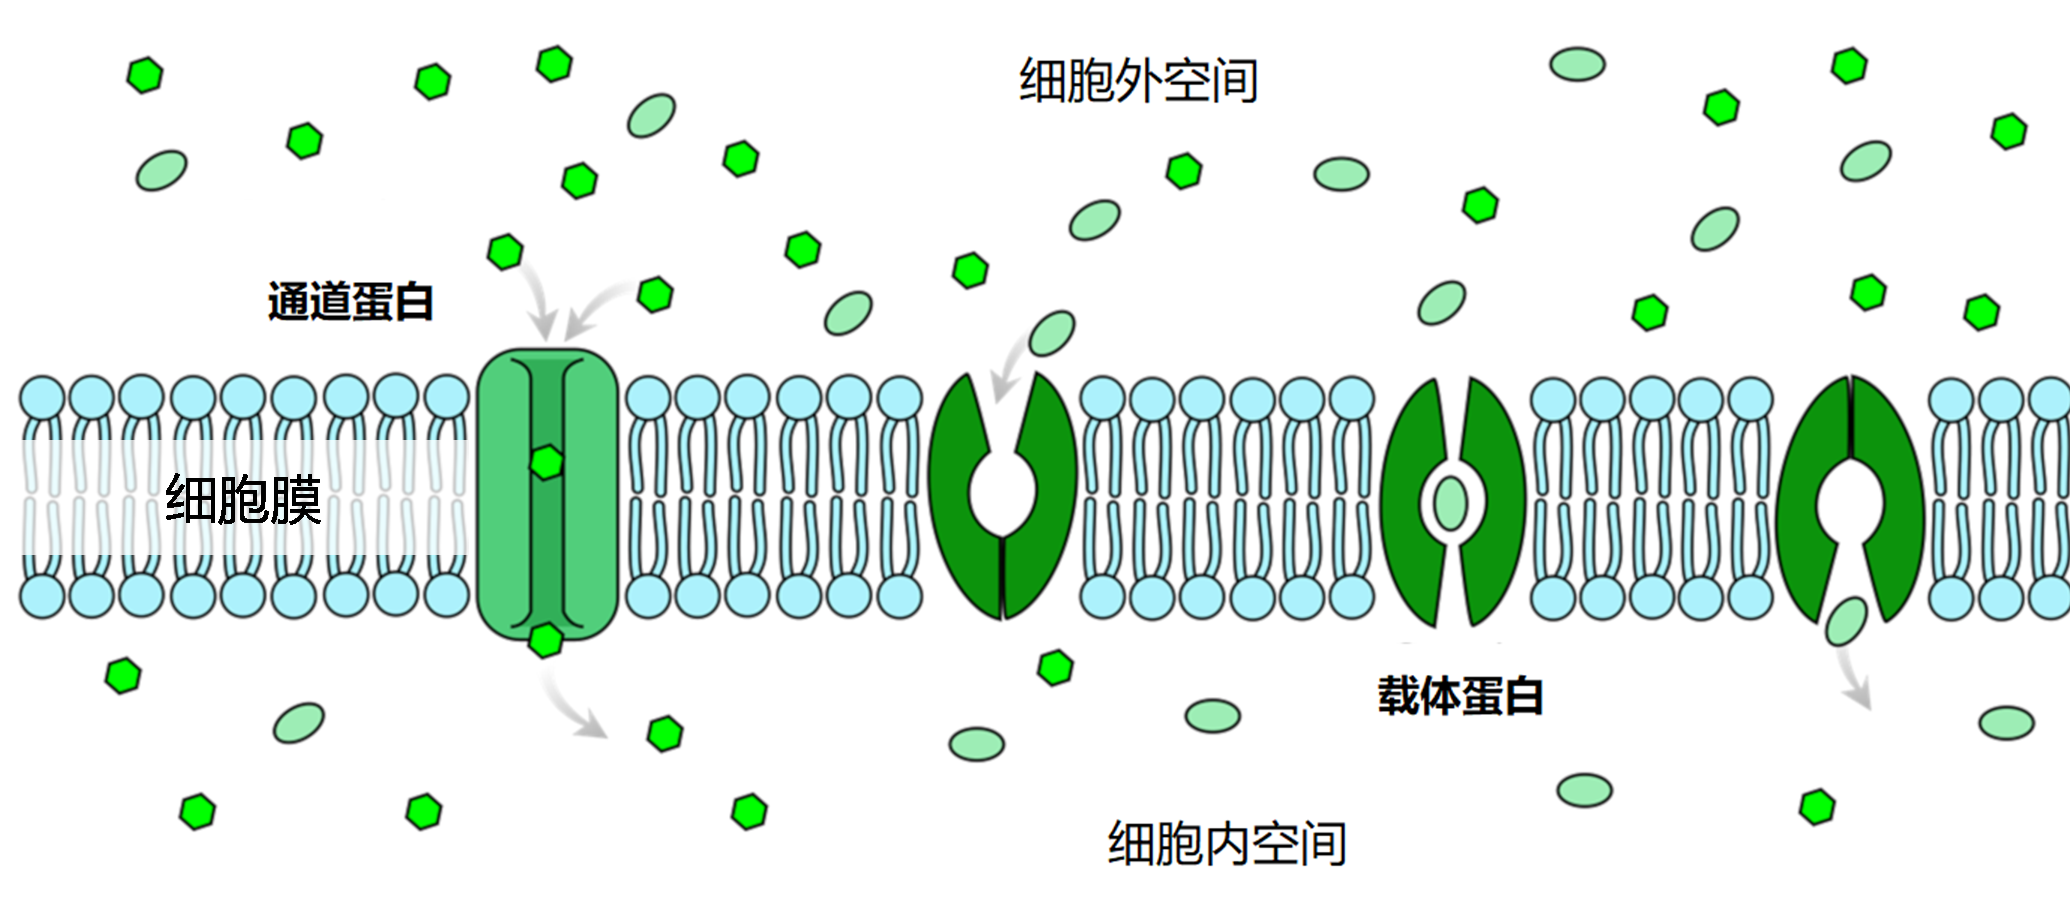
需要通道蛋白或转运蛋白等跨膜蛋白的协助,才能跨过细胞膜的脂质双分子层。[图片来源:LadyofHats /公共领域,维基百科]
一些离子是从根表皮处就进入细胞内,在原生质内的运输被称为共质体途径,存在两类离子转运蛋白:
- 离子通道:仅适用于一种或几种离子快速跨膜,可以受调控地开放和关闭。通道打开时,离子会顺着电化学梯度(细胞膜电位与该离子的平衡电位之差)跨过生物膜。钾就是通过离子通道进行跨膜运输的。
- 转运蛋白:通过蛋白的构象改变,将矿质离子从膜的一侧转移到另一侧。与通道蛋白不同,被转运蛋白运输的离子不是由电化学梯度驱动的,而是需要所耦合的酶促反应释放的能量,如ATP水解。这可以使离子定向跨膜,甚至可以逆着电化学势梯度进行,但同时也有运输速率较通道蛋白慢,离子浓度高时运输速度饱和的弱点。植物体内氮(硝酸盐或铵)、磷(磷酸盐)和硫(硫酸盐)的运输都依赖转运蛋白;铁、锌等金属离子可以与小分子有机物络合,进而通过转运蛋白吸收。植物还能够分泌有机小分子,与土壤中的金属离子结合,然后通过转运蛋白将金属离子吸收到体内。
植物可以根据矿质离子在土壤中的可用量以及自身需求,通过在不同层次上正向或反向调控矿质离子转运蛋白,提高或降低吸收速率:
- 遗传调控:改变转运蛋白编码基因的表达,以适应土壤有效养分的水平。
- 拓扑调控:改变转运蛋白在细胞中的位置,对其功能至关重要。
- 长距离信号传导:是调控根系转运蛋白活性的必要成分。植物地上部分的生长速度决定了植物对矿质元素的需求,叶片会根据不同需求发出相应的信号物质(有机小分子)并运输到根部,进而正向或负向调控矿质例子转运蛋白,以适应植物的需求。
4.2 矿物质与植物矿质营养的相互作用
带相反电荷的不同矿质离子在土壤中会发生相互作用,降低它们的移动性和对植物的有效性,进而影响植物的生长和发育。在植物体内也存在类似的相互作用,但是对这种相互作用如何调控的植物生长,我们尚不清楚。
植物能感知土壤养分的可用量,进而加以调整适应。以往的研究大多是针对不同养分分别开展,但是需要指出的是,各元素内稳态之间的相互作用是一个普遍规律,植物通过主动调节维持不同矿质元素的化学计量比。植物应对单一胁迫(如一种矿质元素缺乏)与复合胁迫(如几种元素同时缺乏)的遗传机制不同,研究复合胁迫对植物生长的影响发现:植物在复合胁迫下的变化具有“涌现性”特征,不能根据对单一胁迫的认知来推绎。
因此,植物对同时摄入的不同营养元素的反应有着很强的关联。例如:
- 在缺锌的情况下,植物体内磷酸盐的浓度会增加;
- 只缺铁时,植物叶片的叶绿素含量会降低,而如果铁和磷同时缺乏,就不会出现这样的现象;
植物根系在缺磷时如何生长取决于氮等其他营养物质的可用性。
5. 迈向综合合理的作物施肥:生物学和农学之间的对话
5.1 优化施肥的一个基本概念:氮稀释
[图片来源:改编自Lemaire等,参考[14]]
研究[12]表明,作物的临界脱氮量(称为Nc,单位为kg N/hm2,即作物达到最大生物量所必需的最小需氮量)与干物质最大积累量(称为Wc,单位为t/hm2表示)之间存在异速生长关系[13]:
Nc=aWcb (1)
式中系数a的值即作物的生物量W = 1 t/hm2时需要吸收的最少氮量;系数b若小于1,则说明单位生物量所需的氮随着作物生物量的增加而逐渐减少。
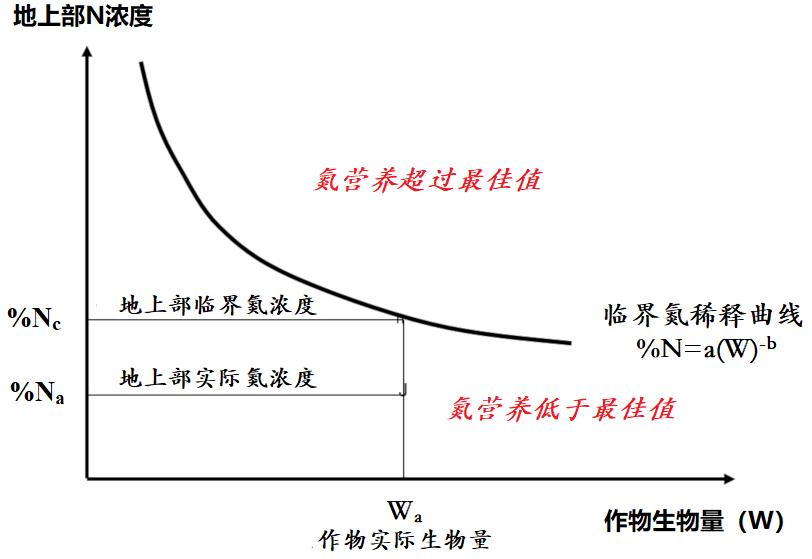
上式可以理解为随着作物的生长,体内氮浓度(%N)逐渐下降,即“氮稀释”:
%Nc=a/10*Wcb-1 (2)
上式中的1/10指氮浓度% Nc占干物质的百分比。基于上式,可以根据临界值(%Nc)来判定给定作物在给定时间的植物氮浓度(%Na)
这是氮营养指数INN = %Na / %Nc:
- INN值小于1(%Na在临界曲线之下)表明作物氮营养不足,该值的大小还量化了氮缺乏的程度;
- INN值大于1(%Na在临界曲线上方)表示氮素过剩或“奢侈”吸收,值越大越严重(图11)[14]
式(1)的这种异速生长关系表明,植物对氮的吸收受下述因子的共同调控:
- 土壤中矿质态氮的可用性;
- 基于第4部分阐述的根系吸收反馈控制机制,植物自身的生长动态。
5.2 氮稀释的生物学和农艺意义
对于在所有植物中都观察到的氮浓度随着生长而降低的现象,该如何从功能上加以解释呢?原因可能有以下几个方面:
- 从根本上看,植物都是由以下两种组织构成的:
-
- 富含氮素的叶片组织,它们捕获光能并吸收CO2(N浓度为4%~5%)[15];
- 构建植物体的支持组织,含氮较低(N浓度为0.5%~0.7%)。
- 随着植物生长,支持组织生物量的增长速度超过叶片组织。当植被冠层茂密时,植物必须长得“更高”、“更壮实”才能使叶片稳固地处于可接受阳光的冠层上部,这种情况就更加明显了。
- 因此,随着冠层生长,富含氮素的“代谢”组织(叶片)生物量增长速度比含氮低的“支持”组织慢一些。
- 此外,遮荫叶片处在弱光环境中,其所含氮素的光合效率低,因此植物会将这些叶片中的氮转移到冠层顶部光照良好的幼嫩叶片中。
植物为获取光照而采取上述一系列适应性构型变化,其结果是,随着植物将更多的生物量分配给含氮低的“支持”组织,植物单位新增生物量(dW)所需的氮需求量(dN)逐渐减少,即植物冠层生长过程中的“氮稀释”现象。这是一个植物种群的涌现性特征,是个体间争夺光资源的结果。
由此可见,这种涌现性特征受作物的生物量控制。因此,要比较两种作物的矿物质营养状况,必须考虑它们生物量的差异,以等量生物量(Wb)为基础(见公式1),Wb表示的是植物的代谢活性组织[16]。之所以采用代谢活性组织作为比较的基础,是因为植物只在其代谢活性组织中维持氮营养的内稳态(即植物稳定其氮素营养状况的能力),而不是在植株整体尺度上保持氮营养内稳态。
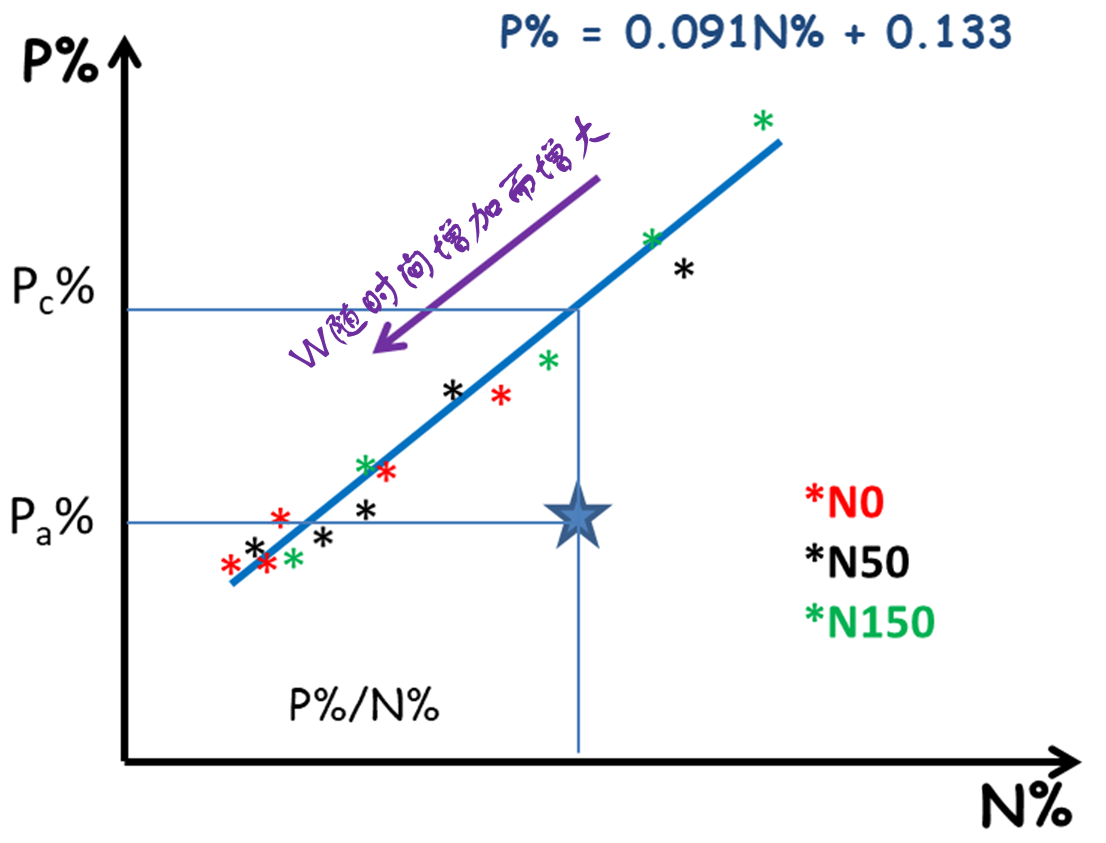
研究与植物新陈代谢组织密切相关的其他元素也得到了类似的结果,如P、K和S的稀释现象 [17]。另一方面,植物体内钙(Ca)的含量随着生物量的增加而增加,这一现象合乎逻辑,因为钙是细胞壁的组成成分,因而会在支持组织中积累。此外,N和P、K或S的临界浓度之间存在着密切的关联(图12) [18],这就为原位多元素营养诊断,以及对不同元素之间的相互作用进行更综合的分析奠定了基础。
采用同样的方法还可以确定植物的K或S 营养指数(INK和INS)。上述分析表明,每种元素对植物的可用量取决于植物的生长能力,同时每种元素都可能成为植物生长的限制因子。因此,在对植物的矿质营养进行综合诊断时,必须考虑到不同元素之间强烈的相互依赖关系。例如,施用氮肥会促进植物生长,同时也增加了植物对磷或钾的需求量,可能导致磷和钾的可用量不足,但在不施氮肥的时候可能不会出现这种情况。
综上所述,这种作物矿质营养原位诊断的新方法基于临界浓度曲线,可以消除作物生物量差异造成的“稀释效应”。
- 消除了仅仅依靠土壤理化分析进行预测的不确定性;
- INN、INP、INK或INS诊断……整合这些指标可以反映作物的营养状况全貌;
- 根据指数b<1或>1的值确定植物状态,可以采取适当的施肥管理措施;
- 这种诊断工具使农民只在确证作物出现营养不足的情况下才予以施肥纠正,可以避免“预防性”过量施肥对环境的危害。
6. 本文重点
- 植物通过根部的膜蛋白从土壤中吸收矿质元素,然后通过输导组织的汁液分布到植物体内各处。
- 植物从土壤中吸收矿质养分受其可用性的控制,这又取决于土壤的理化性质,以及土壤与土壤微生物、植物之间的相互作用。
- 植物的生长决定它们对矿质养分的需求,进而又控制着对养分的吸收,从叶子到根部的长距离信号传导起着重要的作用。
- 长期以来,植物体内矿质养分运输和作物施肥的研究一直考虑单个元素。作物施肥的依据是土壤分析,并且不考虑元素之间的相互作用,并把土壤养分可用性视为与植物自身无关的外部变量。
- 植物在其生长过程中,只在决定生长的“代谢”组织(叶片)中维持内稳态,与此同时,又必须投资构建获取光照的机体结构(氮、磷、钾等含量低的支持组织)。“代谢组织”(与光合面积相关)和“支持组织”(与植株高度、支撑结构的厚度有关)之间天然的异速生长导致随着植株长大,体内矿质元素浓度降低的稀释现象。相对于代谢组织,植物越“大”,需要的支持组织就越多。
- 最新的施肥管理理念基于稀释曲线这一概念,可以克服作物生物量差异产生的稀释效应。根据这种方法,只在有确实证据证明作物营养不良时才施用矿质肥料,因而能够控制过量施肥,减少对环境的危害。
参考文献以及注释:
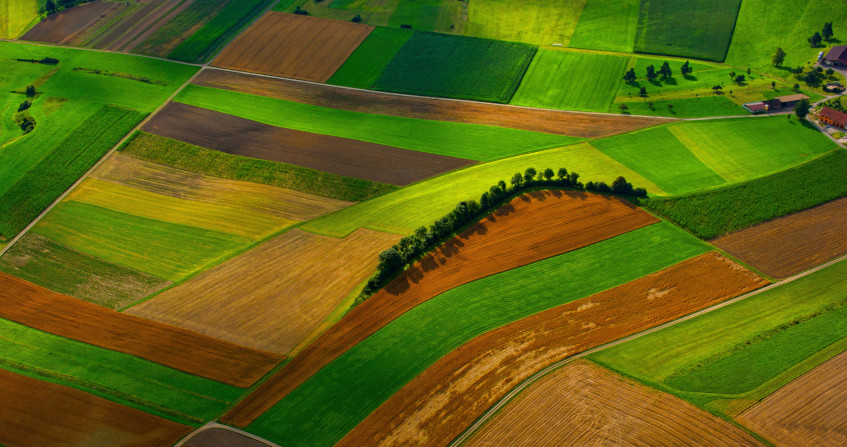
封面图片。[来源:https://www.pxfuel.com]
[1] Morot-Gaudry, J.F., Moreau, F., Prat, R., Maurel, C. & Sentenac, H. (2017). Biologie Végétale : Nutrition et Métabolisme. Dunod. Paris, France. (in French)
[2] Lemaire, G. (2020). La fertilisation des cultures : des bases scientifiques renouvelées. Les mots de l’Agronomie. (in French)
[3] Bloom, A.J., Chapin, F.S. & Mooney, H.A. (1985). Resource limitations in plants – An economic analogy. The Annual Review of Ecology, Evolution, and Systematics, 16, 363-392.
[4] Kho, R.M. (2000). On crop production and the balance of available resources. Agriculture, Ecosystems and Environment, 80, 71-85
[5] Robin, A., Vansuyt, G., Hinsinger, P., et al. 2008. Iron dynamics in the rhizosphere: consequences for plant health and nutrition. Advances in Agronomy, 99, 183-225.
[6] Brundrett, M.C. (2008). Mycorrhizal Associations: The Web Resource.
[7] Duponnois, R., Sanon, A., Hafidi, M., Ndoye, I. & Bâ, A. M. (2013) Généralités sur la symbiose mycorhizienne : introduction. (in French)
[8] Agriculture de conservation des sols.com. Exsudats racinaires : l’essence même des sols. (in French)
[9] Deveau, A. & Martin, F. October 26, 2016. Microbiote : les plantes aussi ! Pour la Science N° 469. (in French)
[10] Plassard, C., Robin, A., Le Cadre, E., Marsden, C., Trap, J. et al. (2015) Améliorer la biodisponibilité du phosphore: comment valoriser les compétences des plantes et les mécanismes biologiques du sol. Innovations Agronomiques, INRA, 43, pp.115-138.
[11] Mineral Nutrition. 参阅文章 “The path of carbon in photosynthesis“.
[12] Lemaire G. & Salette, J. (1984). Relationship between growth dynamics and nitrogen removal dynamics for a forage grass stand. I- Study of the effect of the environment. Agronomy, 4, 423-430.
[13] 在发育生物学中,异速生长指对生物体器官、组织或过程之间相对生长的分析。
[14] Lemaire, G., Jeuffroy, M.H. & Gastal, F., 2008. Diagnosis tool for plant and crop N status in vegetative stage: theory and pratices for crop N management. Eur. J. Agron. 28, 614–624.
[15] 原因在于存在RubisCO (二磷酸核酮糖氧合酶)。RubisCO 是叶片中最丰富的蛋白质(按质量几乎占叶片蛋白质的一半),也是叶片的主要有机氮储备(参见 “RubisCO“)
[16] 对于植物来说,这一概念与动物营养学中的“代谢重量”概念相对应。
[17] Lemaire, G., Sinclair, T., Sadras, V.O. & Belanger, G. (2019). Allometric approach to crop nutrition and implications for crop diagnosis and phenotyping: A review. Agronomy for Sustainable Development.
[18] Salette, J. & Huche, L. (1991) Diagnostic de 1’état de nutrition minérale d’une prairie par l’analyse minérale du végétal: principes, mise en oeuvre, exemples. Fourrages, 125, 3–18. (in French)
环境百科全书由环境和能源百科全书协会出版 (www.a3e.fr),该协会与格勒诺布尔阿尔卑斯大学和格勒诺布尔INP有合同关系,并由法国科学院赞助。
引用这篇文章: BRIAT Jean-François, LEMAIRE Gilles (2024年3月15日), 如何在满足植物营养需求的同时减少污染?, 环境百科全书,咨询于 2026年7月28日 [在线ISSN 2555-0950]网址: https://www.encyclopedie-environnement.org/zh/vivant-zh/how-to-feed-plants-while-polluting-less/.
环境百科全书中的文章是根据知识共享BY-NC-SA许可条款提供的,该许可授权复制的条件是:引用来源,不作商业使用,共享相同的初始条件,并且在每次重复使用或分发时复制知识共享BY-NC-SA许可声明。