Lichens and environmental quality
PDF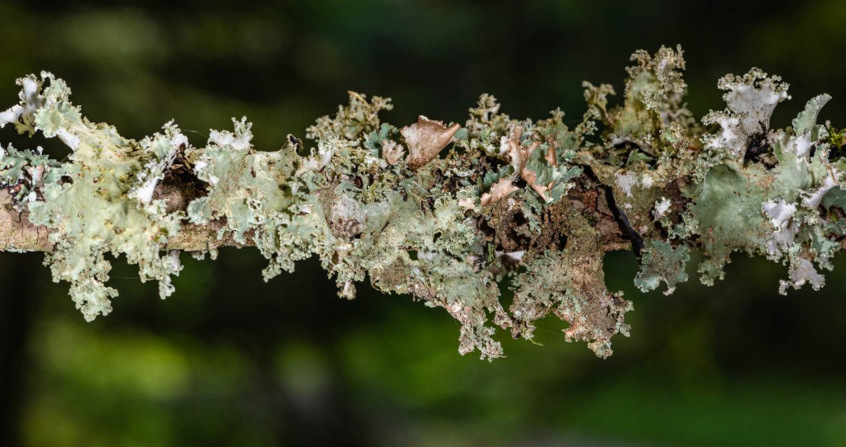
Without structures insuring physical protection, like the plant cuticle, lichens are directly exposed to their environment. Rainwater and air directly enter the organism, dust is trapped between mycelium filaments and the specific compounds formed by lichens can fix pollutants. Because of their ability to react to air pollutants at different levels, their low growth rate, their longevity and their ability to indicate the presence of these pollutants, lichens are true “sponges” which recover compounds present in the atmosphere throughout the year and throughout their life cycle. These particularities have led scientists to use certain lichens to monitor the quality of the environments in which they live. They provide an interesting contribution to the assessment of environmental and health risks.
1. Why lichens?
Lichens are organisms that are very well adapted to the study of gaseous or particulate air pollution because of various and particularly favourable anatomical and physiological characteristics (See The lichens, surprising pioneering organisms; Figure 1):
- absence of cuticle, stomata and conductive vessels,
- presence of a mucilage-rich cortex [1],
- reviviscence,
- photosynthetic activity all year round,
- slow growth.

- From the observation of the lichenic flora on tree trunks, it is possible to establish the level of ambient air quality (bioindicator lichens);
- some species can accumulate different pollutants and are used as sensors (bioaccumulators lichens);
- the achievement of physiological functions can be demonstrated (biomarker lichens).
2. Bioindicator lichens
2.1. From estimating air pollution by SO2 to establishing an environmental quality index
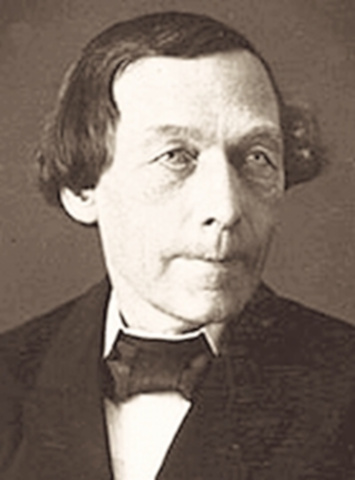
Between 1866 and 1896, Nylander noted the total disappearance of lichens in the Jardin du Luxembourg in Paris whereas about thirty species were initially present [2]. Only green algae of the genus Desmococcus remained. This was found to be the result of the effect of sulphur dioxide (SO2), a pollutant produced when using coal for heating, instead of wood, and changes in industry.
From the second half of the 19th century, the scarcity of lichens increased over the years, in cities and near industrial sites, marked by the disappearance of sensitive lichen species such as Usnea and the persistence of tolerant species.
Different methods for estimating air pollution have been developed:
- Qualitative methods: development of lichen-pollution/air quality correspondence levels,
- Quantitative methods: calculation of an air quality index.
2.2. Qualitative methods
At the end of the 1980s, the amount of atmospheric sulphur dioxide decreased significantly, lichens began to reappear on the trees of the Jardin du Luxembourg, [4] then in other cities in France (Figure 3).
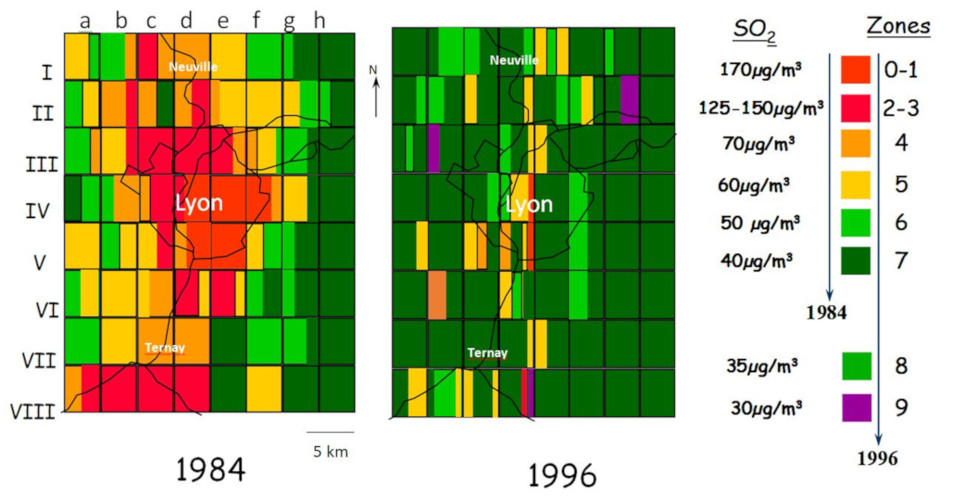
The Hawksworth and Rose method could therefore no longer be used. It was at this time that an approach no longer based on lichen species, but on the observation of species communities, was introduced, making it possible to establish an eco-diagnostic score, where lichens no longer appear as indicators of a single pollutant but as indicators of air quality. In this method, about 30 species are divided into 7 zones ranging from zone A (very poor air quality) to zone G (very good air quality). This procedure has been applied in the northern half of France, in the Lyon region, etc.
2.3 Quantitative methods
Subsequently, the study of lichen diversity as an indicator of environmental quality was introduced. In 2000, 11 European scientists met to develop a single protocol, defined on a sampling strategy in accordance with statistical rules and avoiding any subjectivity of the observer. [7]
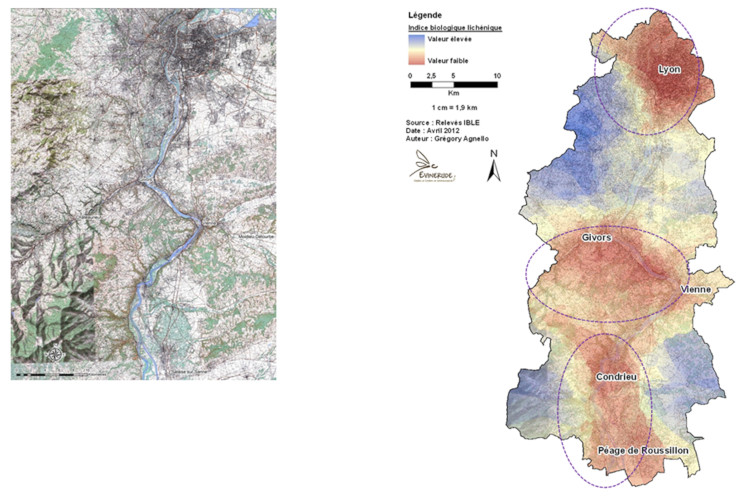
Since then, a lichen indicator score has been developed as an AFNOR standard, first at a French level and then at a European level. [8] This new methodology monitoring epiphytic lichen biodiversity is based on an index (Biological Index of Epiphytic lichens) calculated from the assessment of presence/absence, frequency and recovery of species (Figure 5). [5]
2.4. Nitrogen & Ozone Pollution
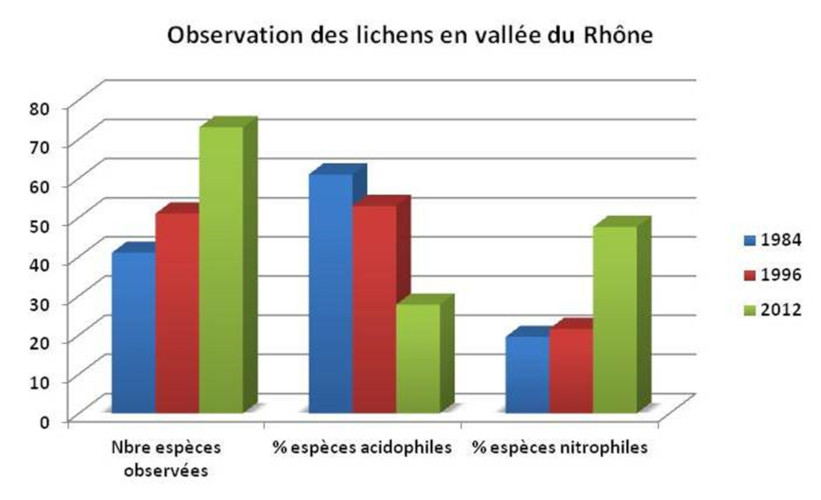
Nitrogen oxide pollution favours the development of more or less nitrophilous species, at the expense of acidophilic species. One of the first studies was carried out on the basilica of Notre-Dame de l’Epine (Marne), whose walls were gradually covered with numerous nitrophilous lichen species, following a change in cultural practices in the surrounding environment.
An identical methodology has been established for ozone for which a sensitivity scale of 4 classes has been established in the Grenoble region [10], in Switzerland and also in the USA (Ohio)…
3. Bioaccumulation and biomarking

The accumulation of fluoride emitted by aluminium plants in the Alpine valleys was particularly sought after by lichens in the 1970s and 1990s. The work made it possible to highlight the distribution of fluoride in space (maps) and time (Figure 7). [11]

Discharges from industrial activities, such as incineration plants, have been well observed in the department of Isère [13] and on the Dunkirk coast. [14]
Atmospheric mercury deposition from a chlor-alkali plant was measured in Xanthoria parietina. The results showed that mercury concentrations decreased as one moved away from the plant with a contamination radius of 2 km (Figure 9). [15]

Radioactive elements can also accumulate in lichens. The first work was carried out in the 1950s and 1970s, during which nuclear tests were carried out mainly in the former USSR and the fallout of radioelements into the atmosphere (mainly 90Sr and 137Cs) was analysed. [17]
After the 1986 Chernobyl accident, reindeer herds were contaminated as a result of the ingestion of lichens contaminated with radioactive elements. In order to prevent the human population that consumed reindeer meat from becoming contaminated in turn, entire herds were slaughtered.
Through their “memory” effect of human activities, herbarium samples can also be successfully used to analyse various organic or inorganic pollutants, radioactive elements, etc.
In areas where lichens are rare or absent, the transplant technique [18] can be applied effectively, especially in the case of corticose lichens. Indeed, it can be used for air pollution monitoring, for example in household waste landfill sites.
An AFNOR standard has also been developed for the use of bioaccumulators. It describes the method to be used for sampling and preparing in situ lichen samples for the bioaccumulation of substances characterizing air pollution.
4. Other types of pollution
4.1. Marine pollution
At sea, various pollutants such as hydrocarbons and anionic surfactants spread by forming a thin film of a few micrometers on the sea surface. On the coast, pollutants can reach lichens that show various types of damage. Lichens can be used as bioindicators and bioaccumulators of marine aerosol pollution on the Mediterranean coast.
4.2. Freshwater pollution
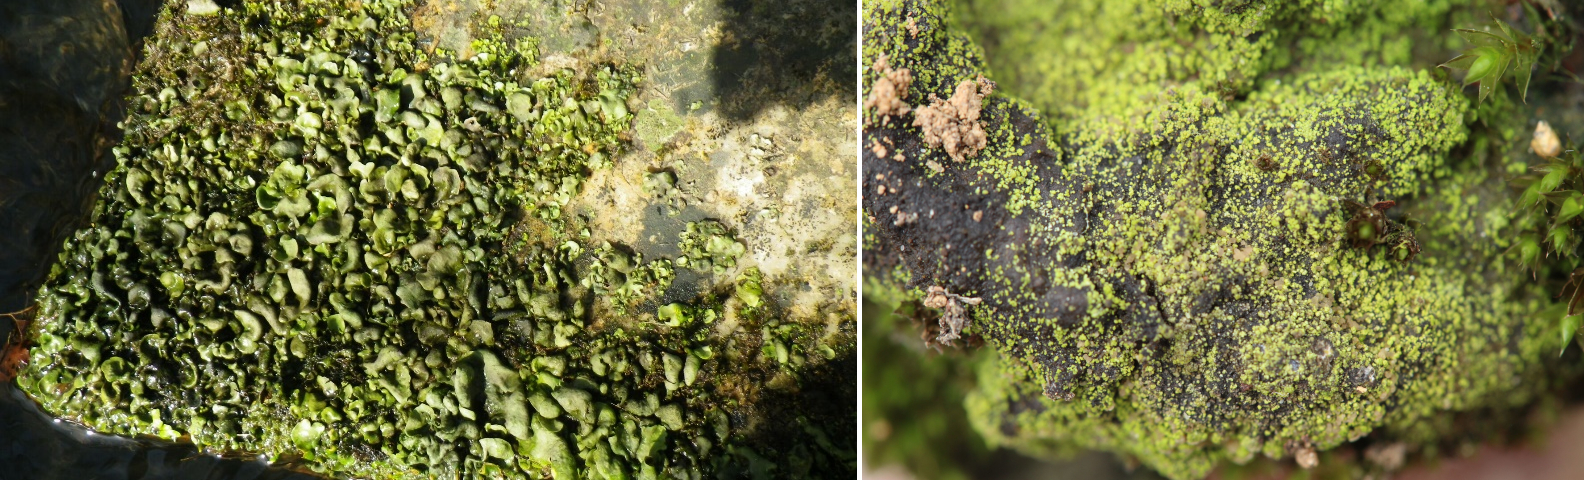
4.3. Soil pollution
Some tolerant soil lichens can grow on soils containing metallic elements and are therefore indicative of the presence of these metals. Thus Diploschistes muscorum, Cladonia and Stereocaulon, among others, tolerate high levels of metals in the soil. Vezdaea leprosa is a species particularly vulnerable to the presence of zinc because it is often found near road safety zinc slides. (Figure 10B).
5. Model systems for environmental and health risk assessment?
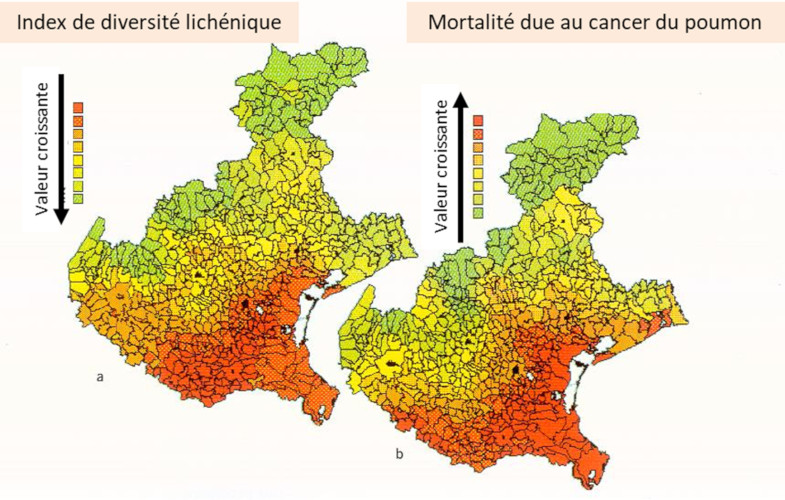
- Research conducted in Italy (Veneto) [20] has shown a close correlation between lung cancer mortality in men under 55 years of age and the lichen biodiversity index. Thus, by comparing the two maps in the Figure, we can see that the region where there is a high lichen diversity index, i.e. many lichens (green zone) and therefore a good environment, there are few lung cancers. When the index is low, so few lichens (red zone), environmental quality is poor and the mortality rate from lung cancer is higher.
- More recently, based on a study conducted in the industrial basin of Dunkirk, researchers were able to highlight a relationship between a lichen impregnation ratio (characterizing the socio-economic situation of the population) and the level of contamination of lichens with metallic trace elements. The results obtained in this way demonstrated the environmental and social inequalities in health at the scale of a territory. [21] (See Environmental Inequalities).
6. Messages to remember
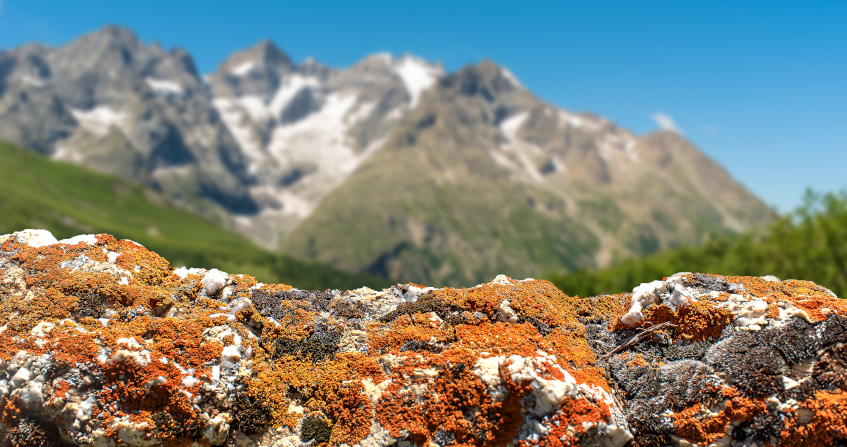
- Lichens grow in all environments except the high seas, on the tissues of live animals and in highly polluted areas.
- Nylander, a Finnish lichenologist, from the end of the 19th century, through observations made in Paris on the trees of the Luxembourg Garden, was the first to suggest that lichens were sensitive to air pollution. The disappearance of lichens was found to be the result of the presence of sulphur dioxide (SO2), emitted by coal combustion and industrial development at the time.
- Various methods based on lichen observation have emerged to detect the effect of air pollution and map its effects.
- Since the years 89-90, the decrease in SO2 emissions has allowed the return of lichens sensitive to this pollutant. But other pollutants persist, such as nitrogen oxides, which cause the spread of so-called nitrophilic lichen species.
- Lichens are capable of accumulating various pollutants such as metals, organic elements, radioelements, etc. and can be used as sensors of pollutants from the atmosphere, water or soil for analysis.
- Standards have been developed for lichen bioindication and sample preparation for analysis.
- Lichens are excellent biological models for assessing environmental and health risks.
Notes and references
Cover image. Platismatia glauca (A foliose thallus species growing on branches and trunks of deciduous and coniferous trees; it seeks a humid atmosphere and light. Avoids pollution. Frequent from collinean to subalpine). [Source: © J. Joyard]
[1] Substances, consisting of polysaccharides, which swell on contact with water to a viscous, sometimes sticky, gelatin-like consistency.
[2] Nylander, W. 1866 – The lichens of the Luxembourg Garden. Bull. Soc. Bot. Fr.,13, 364-372 : Nylander, W. 1896 – The lichens of the surroundings of Paris. Ed. Schmidt, 142p.
[3] Hawksworth, DL. Rose, F. 1970 – Qualitative scale for estimation sulphur dioxide air pollution in Great Britain and Wales using epiphytic lichens. Nature, 227, 145-148.
[4] Khalil K. 2000 – Use of plant bioindicators (lichens and tobacco) in the detection of air pollution in the Lyon region. Thesis University Grenoble. 284p.
[5] Agnello, G., Catinon, M., Ayrault, S., Boudouma, O., Asta, J., Reynaud, S. & Tissut, M. 2014 – Monitoring the evolution of cumulative air pollution in an area of the Rhône Valley. International Workshop. Air quality biomonitoring using plants and fungi. Lille New Century October 13-14, 23p.
[6] Leblanc, F. and De Sloover, J. 1970. Relation between industrialization and the distribution and growth of epiphytic lichens and mosses in Montreal. Can. J. Bot., 48, 1485-1496.
[7] Asta, J. Erhardt, W., Ferretti, M., Forasier, F., Kirschbaum, U. Nimis, P.L., Purvis, W., Pirintsos, S. Sheidegger, C. Van Haluwyn, C. & Wirth, V. 2002. Mapping Lichen diversity as an indicator of environmental quality. In P.L. Nimis, C. Sheidegger & P.A. Wolseley (Eds). Monitoring with lichens-Monitoring lichens. Kluwer, 273-279.
[8] European Standard CEN NF-EN-16413. 2014 – Biomonitoring using lichens: assessment of epiphytic lichen diversity
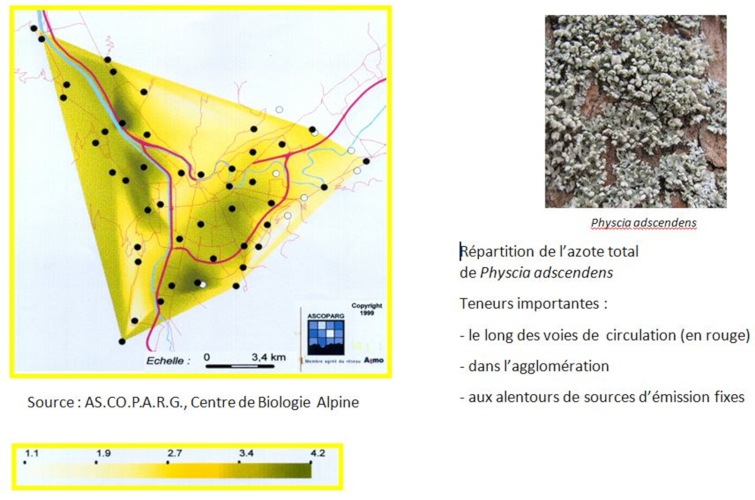
[9] Gombert, S., Asta, J. & Seaward, MRD. 2003- Correlation between the nitrogen concentration of two epiphytic lichens and the traffic density in an urban area. About. Pollut. 123, 281-290.
[10] Gombert, S., Asta, J. & Seaward, MRD. 2006 – Lichens and tobacco plants as complementary biomonitors of air pollution in the Grenoble area (Isère, southeast France). School. Indic, 6, 429-443.
[11] Belandria, G. Asta, J. & Garrec, JP. 1991 – Diminutions of fluorine contents in lichens due to a regression of pollution in an alpine valley (Maurienne, Savoie, France) from 1975 to 1985. Rev. Ecol. Alp. Grenoble, volume 1, 45-58.
[12] Veschambre, S., Amouroux, D., Moldovan, M., Etchelecou, A., Asta, J. & Donard, O.F.X. 2003. Determination of metetallic pollutants in atmospheric parties, wet deposition and epiphytic lichens in the Pyrenees mountains (Aspe Valley). J. Phys. IV, 107, 1341-1344.
[13] Agnello, G. Study Report. Lycene bioaccumulation. In BIO-TOX. 2017 monitoring campaign around the Bourgoin-Jallieu incineration plant (38). Appendix 2. 46p.
[14] Cuny, D., Denayer, F.O., De Foucault, B., Schumacker, R., Colein, P. & Van Haluwyn, C., 2004. Patterns of metal soil contamination and changes in terrestrial cryptogamic communities. About. Pollut, 129, 391-401.
[15] Grangeon, S., S. Guédron, J. Asta, J., J., G. Sarret & L. Charlet. 2012- Lichen and soil as indicators of an atmospheric mercury contamination in the vicinity of a chlor-alkali plant (Grenoble, France). – School. Indic. 13(1): 178-183.
[16] Augusto S., Máguas C. M., & Branquinho C. 2013 – Guidelines for biomonitoring persistent organic pollutants (POPs), using lichens and aquatic mosses -a review. About. Pollut, 180, 330-338.
[17] Analyses carried out in France in 1996, ten years after the Chernobyl disaster, still showed significant levels of Cesium 134 and 137 in samples of Pseudevernia furfuracea from Col de Porte (in Chartreuse, Isère) (J. Asta. com. pers.)
[18] The transplant technique consists in taking lichens from a healthy region and placing them in a polluted site to be monitored spatially and temporally. Healthy lichens are installed in several locations on the site for varying lengths of time (1 month, 3 months, 1 year, etc.) depending on the protocol chosen to perform the analyses of accumulated pollutants.
[19] Monnet, F., Bordas, F., Deluchat, V., Chatenet, P., Botineau, M., & Baudu, M. (2005), Use of the aquatic lichen Dermatocarpon luridum as bioindicator of copper pollution: Accumulation and cellular distribution tests. About. Pollut, 138,3, 455-461
[20] Cislaghi, C. & Nimis, P.L. 1997 – Lichens, air pollution and lung cancer. Nature, 387, 463-464.
[21] Occelli, F., Bavdek, R., Deram, A., Hellequin, A.P., Cuny, M.A., Zwarterook, I. & Cuny, D. (2016) Using lichen biomonitoring to assess environmental justice at a neighbourhood level in an industrial area of Northern France. School. Indic, 60, 781-788.
The Encyclopedia of the Environment by the Association des Encyclopédies de l'Environnement et de l'Énergie (www.a3e.fr), contractually linked to the University of Grenoble Alpes and Grenoble INP, and sponsored by the French Academy of Sciences.
To cite this article: ASTA Juliette (April 22, 2023), Lichens and environmental quality, Encyclopedia of the Environment, Accessed May 1, 2024 [online ISSN 2555-0950] url : https://www.encyclopedie-environnement.org/en/life/lichens-environmental-quality/.
The articles in the Encyclopedia of the Environment are made available under the terms of the Creative Commons BY-NC-SA license, which authorizes reproduction subject to: citing the source, not making commercial use of them, sharing identical initial conditions, reproducing at each reuse or distribution the mention of this Creative Commons BY-NC-SA license.