Lichens and environmental quality

PDF
lichens

Without structures insuring physical protection, like the plant cuticle, lichens are directly exposed to their environment. Rainwater and air directly enter the organism, dust is trapped between mycelium filaments and the specific compounds formed by lichens can fix pollutants. Because of their ability to react to air pollutants at different levels, their low growth rate, their longevity and their ability to indicate the presence of these pollutants, lichens are true “sponges” which recover compounds present in the atmosphere throughout the year and throughout their life cycle. These particularities have led scientists to use certain lichens to monitor the quality of the environments in which they live. They provide an interesting contribution to the assessment of environmental and health risks.

1. Why lichens?

Lichens are organisms that are very well adapted to the study of gaseous or particulate air pollution because of various and particularly favourable anatomical and physiological characteristics (See The lichens, surprising pioneering organisms; Figure 1):

  • absence of cuticle, stomata and conductive vessels,
  • presence of a mucilage-rich cortex [1],
  • reviviscence,
  • photosynthetic activity all year round,
  • slow growth.

lichens - thalles
Figure 1. Lichens and their thallus are directly exposed to their surrounding environment. On the left, Pseudevernia furfuracea, a lichen with a fruticose thallus growing on hardwood or coniferous bark; on the right, vertical section of foliose thallus of Phaeophyscia orbicularis. [Source: left, © J. Asta / right, © Danièle Gonnet]
Lichens do not have any physical means of defence against the environment, so they behave like real “sponges” all year round and throughout their lives. The rainwater supply and the absorption of air – essential for gas exchanges for photosynthesis and respiration – are done by the entire thallus, the mucilages of the walls absorb water, the dust is trapped between mycelium filaments and lichenic acids fix pollutants. This is particularly true for fruticose lichens which, because of their bushy structure, have a higher surface-to-volume ratio than other types of lichens and could better recover air pollutants present as aerosols (see Air Pollution). Foliose lichens, with their leaf-shape aspect, with only the upper surface exposed to ambient air, are more efficient in recovering compounds whose deposition is mainly gravitational (i.e. particles, Air pollutants: what is it?). These characteristics make lichens true “sentinels” of the environmental changes due to human activities (see Plants and Air Quality Sentinels Lichens).

Wilhelm Nylander
Figure 2. Wilhelm Nylander (1822-1899) is considered one of the leading researchers on lichens in the second half of the 19th century. He described 3,000 species. [Source: A. Barrès derivative work: Bff (Public domain)]
During his stay in Paris in the second half of the 19th century, Wilhelm Nylander -a Finnish lichenologist (Figure 2)- was the first to suggest that lichens could be considered as “hygiometers” (the term he used and meaning bioindicators) of air quality and provide information on atmospheric pollution. Unlike a physico-chemical sensor that reflects the content of the pollutant for which it was designed, lichens take everything into account and can serve as a global control of air pollution. Different strategies have been implemented:

  • From the observation of the lichenic flora on tree trunks, it is possible to establish the level of ambient air quality (bioindicator lichens);
  • some species can accumulate different pollutants and are used as sensors (bioaccumulators lichens);
  • the achievement of physiological functions can be demonstrated (biomarker lichens).

2. Bioindicator lichens

2.1. From estimating air pollution by SO2 to establishing an environmental quality index

Between 1866 and 1896, Nylander noted the total disappearance of lichens in the Jardin du Luxembourg in Paris whereas about thirty species were initially present [2]. Only green algae of the genus Desmococcus remained. This was found to be the result of the effect of sulphur dioxide (SO2), a pollutant produced when using coal for heating, instead of wood, and changes in industry.

From the second half of the 19th century, the scarcity of lichens increased over the years, in cities and near industrial sites, marked by the disappearance of sensitive lichen species such as Usnea and the persistence of tolerant species.

Different methods for estimating air pollution have been developed:

  • Qualitative methods: development of lichen-pollution/air quality correspondence levels,
  • Quantitative methods: calculation of an air quality index.

2.2. Qualitative methods

pollution atmospherique lyon - pollution lyon
Figure 3. Detection of air pollution around Lyon (France) based on the observation of lichens using the Hawksworth and Rose method (see ref. 3) Estimation of SO2 levels in µg/m3. Between 1984 and 1996, lichens recolonized the study area as a result of the reduction in atmospheric SO2 [4]. [Source: Thesis Khalil 2000 – DR]
The first methods were based on field observation of lichens (estimation of the number of species and percentage recovery). Subsequently, mapping scales were developed between the lichen species and the SO2 content. The most widely used was created by Hawksworth and Rose in England in 1970. [3] In this method, about 80 species are classified into 11 pollution levels ranging from 0 to 10, with level 0 corresponding to the maximum pollution level (> 170µg/m3), level 10 to the maximum purity level. This method was widely used throughout France in many studies between the 1970s and 1980s, during which SO2 was truly the tracer of air pollution.

At the end of the 1980s, the amount of atmospheric sulphur dioxide decreased significantly, lichens began to reappear on the trees of the Jardin du Luxembourg, [4] then in other cities in France (Figure 3).

lichens rhone
Figure 4. Number of lichens observed between 1984 and 2012 and percentage of nitrophilous species during the same period in the Rhône Valley (from ref. 5). Between 1984 and 1996, there was an increase in the number of species observed and a sharp increase in nitrophilic species due to the presence of nitrogen oxides pollutants. [Source: © J. Asta]
However, in parallel with the decrease in SO2, other air pollutants have increased: nitrogen oxides (NOx) related to automobile traffic, ammonia compounds in rural areas related to agricultural activities, organic compounds (Figure 4). [5]

The Hawksworth and Rose method could therefore no longer be used. It was at this time that an approach no longer based on lichen species, but on the observation of species communities, was introduced, making it possible to establish an eco-diagnostic score, where lichens no longer appear as indicators of a single pollutant but as indicators of air quality. In this method, about 30 species are divided into 7 zones ranging from zone A (very poor air quality) to zone G (very good air quality). This procedure has been applied in the northern half of France, in the Lyon region, etc.

2.3 Quantitative methods

methode ILBE - lichens - lichens lyon
Figure 5. Application of the IBLE method (Biological Index of Lichens Epiphytes) around Lyon (France) and the northern Rhône Valley. (after Ref. [5]). The IBLE values reflect air quality: low values correspond to low to poor air quality, high values to medium to very good air quality. It can be seen that the majority of the population is located in the sectors where the IBLE is lowest. [Source: © J. Asta]
These methods are based on the calculation of a pollution index calculated from a mathematical formula that uses different parameters related to corticolous lichenical flora. The best known is the I.P.A. method (atmospheric purity index) by Leblanc and Sloover (1970). [6] This approach has been used frequently in France (in the Paris, Lyon [4] and Grenoble regions) and in Canada, Italy, Spain, Switzerland….

Subsequently, the study of lichen diversity as an indicator of environmental quality was introduced. In 2000, 11 European scientists met to develop a single protocol, defined on a sampling strategy in accordance with statistical rules and avoiding any subjectivity of the observer. [7]

Since then, a lichen indicator score has been developed as an AFNOR standard, first at a French level and then at a European level. [8] This new methodology monitoring epiphytic lichen biodiversity is based on an index (Biological Index of Epiphytic lichens) calculated from the assessment of presence/absence, frequency and recovery of species (Figure 5). [5]

2.4. Nitrogen & Ozone Pollution

Nitrogen oxide pollution favours the development of more or less nitrophilous species, at the expense of acidophilic species. One of the first studies was carried out on the basilica of Notre-Dame de l’Epine (Marne), whose walls were gradually covered with numerous nitrophilous lichen species, following a change in cultural practices in the surrounding environment.

concentration azote grenoble - azote grenoble
Figure 6. Total nitrogen concentration (%) in Physcia adscendens in the Grenoble region (according to Ref. [9]). (Photo Physcia adscendens). [Source: © Photo J. Asta]
Nitrogen dioxide (NO2) pollution from motor traffic has been studied in the Grenoble region (Figure 6) and a scale of 3 lichen-sensitivity classes has been established. [9],[10] This scale is based on the characterization of lichen species according to their ecological parameters, summer NO2 levels and the environmental characteristics of the region.

An identical methodology has been established for ozone for which a sensitivity scale of 4 classes has been established in the Grenoble region [10], in Switzerland and also in the USA (Ohio)…

3. Bioaccumulation and biomarking

concentration fluor lichens vallee maurienne
Figure 7. Decrease in the fluoride concentration of various lichens measured in the Maurienne Valley (Savoie) between 1975 and 1985. Hypogymnia physodes, a foliose lichen, and Pseudevernia furfuracea, a fruticulose lichen [Source: Adapted from ref. [11] & Photos J. Asta & C. Remy]
Lichens are tested for accumulated pollutants (bioaccumulators lichens) or physiological or cellular effects (biomarkers lichens).

The accumulation of fluoride emitted by aluminium plants in the Alpine valleys was particularly sought after by lichens in the 1970s and 1990s. The work made it possible to highlight the distribution of fluoride in space (maps) and time (Figure 7). [11]

Cladonia stellaris - recolte Cladonia stellaris canada
Figure 8. Harvesting of Cladonia stellaris contaminated with atmospheric iron from mining operations (Quebec, Canada). [Source: © G. Agnello]
Similarly, lichens allow the accumulation of metallic trace elements to be monitored. The detection of pollution due to road traffic by lead has been extensively studied in the Paris region in northern France or by other metals in the Pyrenees [12], the Alps or other regions of the world (Figure 8).

Discharges from industrial activities, such as incineration plants, have been well observed in the department of Isère [13] and on the Dunkirk coast. [14]

Atmospheric mercury deposition from a chlor-alkali plant was measured in Xanthoria parietina. The results showed that mercury concentrations decreased as one moved away from the plant with a contamination radius of 2 km (Figure 9). [15]

concentration mercure lichens - usine chlore Chlore-Alcali jarrie
Figure 9. Mercury concentrations in soils and lichens around the Jarrie Chlor-Alcali plant (after Ref. [15], with permission). [Source © Elsevier]
Environmental biomonitoring using lichens has provided valuable information on organic compounds (PCBs, dioxins, polycyclic aromatic hydrocarbons, etc.) that have a very high concentration factor compared to concentrations in the atmosphere. This work has led to the development of a strategy to be followed when using bioindicators such as lichens to assess environmental pollution by persistent organic pollutants in the atmosphere. [16]

Radioactive elements can also accumulate in lichens. The first work was carried out in the 1950s and 1970s, during which nuclear tests were carried out mainly in the former USSR and the fallout of radioelements into the atmosphere (mainly 90Sr and 137Cs) was analysed. [17]

After the 1986 Chernobyl accident, reindeer herds were contaminated as a result of the ingestion of lichens contaminated with radioactive elements. In order to prevent the human population that consumed reindeer meat from becoming contaminated in turn, entire herds were slaughtered.

Through their “memory” effect of human activities, herbarium samples can also be successfully used to analyse various organic or inorganic pollutants, radioactive elements, etc.

In areas where lichens are rare or absent, the transplant technique [18] can be applied effectively, especially in the case of corticose lichens. Indeed, it can be used for air pollution monitoring, for example in household waste landfill sites.

An AFNOR standard has also been developed for the use of bioaccumulators. It describes the method to be used for sampling and preparing in situ lichen samples for the bioaccumulation of substances characterizing air pollution.

4. Other types of pollution

4.1. Marine pollution

At sea, various pollutants such as hydrocarbons and anionic surfactants spread by forming a thin film of a few micrometers on the sea surface. On the coast, pollutants can reach lichens that show various types of damage. Lichens can be used as bioindicators and bioaccumulators of marine aerosol pollution on the Mediterranean coast.

4.2. Freshwater pollution

lichens - Dermatocapon luridum - Vezdaea leprosa
Figure 10. Lichens in water. Left: Dermatocapon luridum; right: Vezdaea leprosa. [Source: © J. Lagrandie]
Lichens such as Dermatocarpon luridum are used as bioaccumulators of metallic elements in water (Figure 10A). [19] Recently, a more manageable “biosensor” than those used from bacteria has been developed to detect the presence of benzene in the aquatic environment following industrial or accidental releases to the environment (Figure 10A).

4.3. Soil pollution

Some tolerant soil lichens can grow on soils containing metallic elements and are therefore indicative of the presence of these metals. Thus Diploschistes muscorum, Cladonia and Stereocaulon, among others, tolerate high levels of metals in the soil. Vezdaea leprosa is a species particularly vulnerable to the presence of zinc because it is often found near road safety zinc slides. (Figure 10B).

5. Model systems for environmental and health risk assessment?

lichens
Figure 11. Left, Lichen Biodiversity Map (a) calculated by adding the frequency values of all lichens recorded in a 10 unit sampling grid and (b) lung cancer mortality map for young male residents (expressed as expected x 100) in the Veneto region, Italy. [Source: Based on Cislaghi & Nimis (1997), with permission]
Why are lichens excellent biological models for environmental and health risk assessment? In a given region, the abundance of lichens indicates good air and environmental quality and therefore few or no pollutants, while when lichen vegetation is scarce, it is a sign of poor air and environmental quality linked to the presence of atmospheric pollutants, which can lead to disturbances to human health and poor living conditions. Air and environmental quality links lichen vegetation to health impacts, often related to the social conditions of the population. Health problems or socio-economic conditions can be identified through lichens. Hence the interest of the work carried out on lichens. Two examples support this proposition:

  • Research conducted in Italy (Veneto) [20] has shown a close correlation between lung cancer mortality in men under 55 years of age and the lichen biodiversity index. Thus, by comparing the two maps in the Figure, we can see that the region where there is a high lichen diversity index, i.e. many lichens (green zone) and therefore a good environment, there are few lung cancers. When the index is low, so few lichens (red zone), environmental quality is poor and the mortality rate from lung cancer is higher.
  • More recently, based on a study conducted in the industrial basin of Dunkirk, researchers were able to highlight a relationship between a lichen impregnation ratio (characterizing the socio-economic situation of the population) and the level of contamination of lichens with metallic trace elements. The results obtained in this way demonstrated the environmental and social inequalities in health at the scale of a territory. [21] (See Environmental Inequalities).

6. Messages to remember

  • Lichens grow in all environments except the high seas, on the tissues of live animals and in highly polluted areas.
  • Nylander, a Finnish lichenologist, from the end of the 19th century, through observations made in Paris on the trees of the Luxembourg Garden, was the first to suggest that lichens were sensitive to air pollution. The disappearance of lichens was found to be the result of the presence of sulphur dioxide (SO2), emitted by coal combustion and industrial development at the time.
  • Various methods based on lichen observation have emerged to detect the effect of air pollution and map its effects.
  • Since the years 89-90, the decrease in SO2 emissions has allowed the return of lichens sensitive to this pollutant. But other pollutants persist, such as nitrogen oxides, which cause the spread of so-called nitrophilic lichen species.
  • Lichens are capable of accumulating various pollutants such as metals, organic elements, radioelements, etc. and can be used as sensors of pollutants from the atmosphere, water or soil for analysis.
  • Standards have been developed for lichen bioindication and sample preparation for analysis.
  • Lichens are excellent biological models for assessing environmental and health risks.

Notes and references

Cover image. Platismatia glauca (A foliose thallus species growing on branches and trunks of deciduous and coniferous trees; it seeks a humid atmosphere and light. Avoids pollution. Frequent from collinean to subalpine). [Source: © J. Joyard]

[1] Substances, consisting of polysaccharides, which swell on contact with water to a viscous, sometimes sticky, gelatin-like consistency.

[2] Nylander, W. 1866 – The lichens of the Luxembourg Garden. Bull. Soc. Bot. Fr.,13, 364-372 : Nylander, W. 1896 – The lichens of the surroundings of Paris. Ed. Schmidt, 142p.

[3] Hawksworth, DL. Rose, F. 1970 – Qualitative scale for estimation sulphur dioxide air pollution in Great Britain and Wales using epiphytic lichens. Nature, 227, 145-148.

[4] Khalil K. 2000 – Use of plant bioindicators (lichens and tobacco) in the detection of air pollution in the Lyon region. Thesis University Grenoble. 284p.

[5] Agnello, G., Catinon, M., Ayrault, S., Boudouma, O., Asta, J., Reynaud, S. & Tissut, M. 2014 – Monitoring the evolution of cumulative air pollution in an area of the Rhône Valley. International Workshop. Air quality biomonitoring using plants and fungi. Lille New Century October 13-14, 23p.

[6] Leblanc, F. and De Sloover, J. 1970. Relation between industrialization and the distribution and growth of epiphytic lichens and mosses in Montreal. Can. J. Bot., 48, 1485-1496.

[7] Asta, J. Erhardt, W., Ferretti, M., Forasier, F., Kirschbaum, U. Nimis, P.L., Purvis, W., Pirintsos, S. Sheidegger, C. Van Haluwyn, C. & Wirth, V. 2002. Mapping Lichen diversity as an indicator of environmental quality. In P.L. Nimis, C. Sheidegger & P.A. Wolseley (Eds). Monitoring with lichens-Monitoring lichens. Kluwer, 273-279.

[8] European Standard CEN NF-EN-16413. 2014 – Biomonitoring using lichens: assessment of epiphytic lichen diversity

[9] Gombert, S., Asta, J. & Seaward, MRD. 2003- Correlation between the nitrogen concentration of two epiphytic lichens and the traffic density in an urban area. About. Pollut. 123, 281-290.

[10] Gombert, S., Asta, J. & Seaward, MRD. 2006 – Lichens and tobacco plants as complementary biomonitors of air pollution in the Grenoble area (Isère, southeast France). School. Indic, 6, 429-443.

[11] Belandria, G. Asta, J. & Garrec, JP. 1991 – Diminutions of fluorine contents in lichens due to a regression of pollution in an alpine valley (Maurienne, Savoie, France) from 1975 to 1985. Rev. Ecol. Alp. Grenoble, volume 1, 45-58.

[12] Veschambre, S., Amouroux, D., Moldovan, M., Etchelecou, A., Asta, J. & Donard, O.F.X. 2003. Determination of metetallic pollutants in atmospheric parties, wet deposition and epiphytic lichens in the Pyrenees mountains (Aspe Valley). J. Phys. IV, 107, 1341-1344.

[13] Agnello, G. Study Report. Lycene bioaccumulation. In BIO-TOX. 2017 monitoring campaign around the Bourgoin-Jallieu incineration plant (38). Appendix 2. 46p.

[14] Cuny, D., Denayer, F.O., De Foucault, B., Schumacker, R., Colein, P. & Van Haluwyn, C., 2004. Patterns of metal soil contamination and changes in terrestrial cryptogamic communities. About. Pollut, 129, 391-401.

[15] Grangeon, S., S. Guédron, J. Asta, J., J., G. Sarret & L. Charlet. 2012- Lichen and soil as indicators of an atmospheric mercury contamination in the vicinity of a chlor-alkali plant (Grenoble, France). – School. Indic. 13(1): 178-183.

[16] Augusto S., Máguas C. M., & Branquinho C. 2013 – Guidelines for biomonitoring persistent organic pollutants (POPs), using lichens and aquatic mosses -a review. About. Pollut, 180, 330-338.

[17] Analyses carried out in France in 1996, ten years after the Chernobyl disaster, still showed significant levels of Cesium 134 and 137 in samples of Pseudevernia furfuracea from Col de Porte (in Chartreuse, Isère) (J. Asta. com. pers.)

[18] The transplant technique consists in taking lichens from a healthy region and placing them in a polluted site to be monitored spatially and temporally. Healthy lichens are installed in several locations on the site for varying lengths of time (1 month, 3 months, 1 year, etc.) depending on the protocol chosen to perform the analyses of accumulated pollutants.

[19] Monnet, F., Bordas, F., Deluchat, V., Chatenet, P., Botineau, M., & Baudu, M. (2005), Use of the aquatic lichen Dermatocarpon luridum as bioindicator of copper pollution: Accumulation and cellular distribution tests. About. Pollut, 138,3, 455-461

[20] Cislaghi, C. & Nimis, P.L. 1997 – Lichens, air pollution and lung cancer. Nature, 387, 463-464.

[21] Occelli, F., Bavdek, R., Deram, A., Hellequin, A.P., Cuny, M.A., Zwarterook, I. & Cuny, D. (2016) Using lichen biomonitoring to assess environmental justice at a neighbourhood level in an industrial area of Northern France. School. Indic, 60, 781-788.


The Encyclopedia of the Environment by the Association des Encyclopédies de l'Environnement et de l'Énergie (www.a3e.fr), contractually linked to the University of Grenoble Alpes and Grenoble INP, and sponsored by the French Academy of Sciences.

To cite this article: ASTA Juliette (April 22, 2023), Lichens and environmental quality, Encyclopedia of the Environment, Accessed July 27, 2024 [online ISSN 2555-0950] url : https://www.encyclopedie-environnement.org/en/life/lichens-environmental-quality/.

The articles in the Encyclopedia of the Environment are made available under the terms of the Creative Commons BY-NC-SA license, which authorizes reproduction subject to: citing the source, not making commercial use of them, sharing identical initial conditions, reproducing at each reuse or distribution the mention of this Creative Commons BY-NC-SA license.

地衣与环境质量

PDF
lichens

  地衣没有植物角质层等物理保护结构,而是直接暴露于环境中,直接吸收雨水和空气,并通过菌丝捕集灰尘。因此,由地衣构成的特定混合物能够固集污染物。地衣对不同程度的空气污染物反应极为敏感,因而能够反映空气中是否存在某类污染物;除此之外,地衣还具有生长缓慢、寿命长的特性,因此在一年四季,甚至整个生命周期内都能积累大气中存在的各种化合物(包括污染物),可谓真正的“海绵”。科研人员正充分利用上述特性,借助特定地衣物种来监测人居环境质量。地衣为环境和健康风险评估作出了重要贡献。

1. 为什么是地衣?

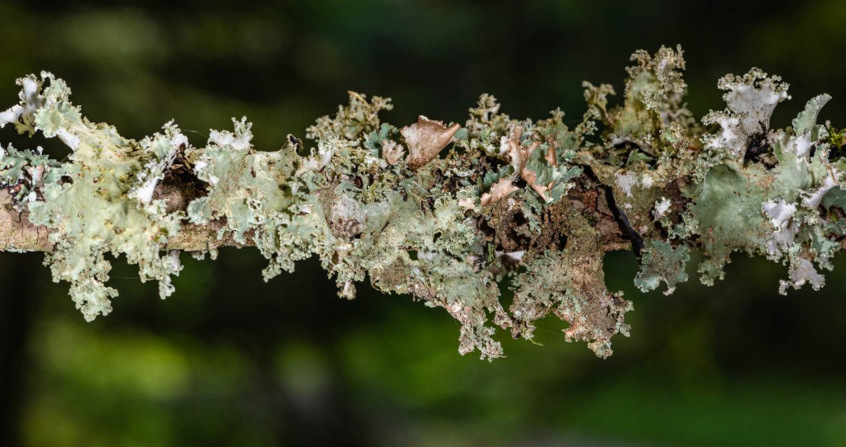
  地衣是一类非常适用于研究大气气体或微粒污染的生物体,具有多种极为有利的解剖结构和生理特征(图1)(详见《地衣,令人惊叹的开拓者》):

  • 无角质层(cuticle)、气孔(stomata)和导管(conductive vessels),
  • 富含粘液(mucilage)的皮层[1]
  • 再生性,
  • 持续全年的光合活性,
  • 生长缓慢。
环境百科全书-地衣与环境质量-地衣的地衣体
图1. 地衣体直接暴露于周围环境中。左侧是糠秕假扁枝衣(Pseudevernia furfuracea),一种生长在阔叶或针叶树树皮上的枝状地衣;右侧是轮状褐藻(Phaeophyscia
orbicularis)叶状地衣体的垂直剖面图。[图源:左图:© J. Asta;右图:© Danièle Gonnet](图1.Cortex supérieur 上皮层;Couche algale 藻层;Médulle 髓层;Cortex inférieur 下皮层;Rhizine 假根)

  面对环境,地衣没有任何物理防御方式,因此其一年四季乃至整个生命周期的行为都像真正的“海绵”——整个地衣体都是雨水和空气的直接吸收器官,只有这样地衣才能完成光合和呼吸作用必需的气体交换;此外,其表皮上的粘液也可以储水;菌丝体表面能够固集灰尘;地衣酸会捕获污染物并与之反应。其中,枝状地衣因其结构浓密,拥有比其他地衣类型更高的表面积体积比,因而可以吸收更多以气溶胶形式存在于空气中的污染物(详见《空气污染》)。叶状地衣的树叶形外观决定了其只有上表面暴露于周围大气中,因而更擅长吸收在重力作用下沉积的化合物(即空气中的污染微粒,详见《空气污染颗粒究竟是什么?》),这些特性使地衣成为人类活动引起的环境变化的真实“哨兵”(详见《植物和地衣——空气质量的哨兵》)。

环境百科全书-地衣与环境质量-威廉·尼兰德
图2. 威廉·尼兰德(Wilhelm Nylander)(1822-1899),被认为是19世纪下半叶地衣研究领域的领军人物之一,命名了3000个物种。[图源:A .Barrès的衍生作品:Bff(公共领域)]

  19世纪下半叶,芬兰地衣学家威廉·尼兰德(Wilhelm Nylander)(图2)在暂居巴黎期间,首次提出地衣可用作空气质量的“卫生计”(hygiometers),即生物指示器(bioindicator),为人类提供有关大气污染的信息。不同于为直接反映污染物含量而设计的物理化学传感器,地衣涉及的因素更为全面,不仅可以作为指示物使用,还可用来控制全球空气污染。目前,多种不同策略已得到实施:

  • 地衣生物指示器(bioindicator):通过观察树干上的地衣群落,可以确定附近环境的空气质量水平;
  • 地衣生物富集物(bioaccumulator):特定种类的地衣可以积累不同的污染物,成为反映污染程度的传感器;
  • 地衣生物标志物(biomarker):地衣可以直观展现生理功能的运行过程。

2. 地衣生物指示器

2.1. 从估算SO2对空气的污染到建立环境质量指数

  从1866年到1896年,尼兰德注意到,短短30年间,原本栖息于巴黎卢森堡公园的约30种地衣已经完全消失[2]。其组分中只有绿藻属(Desmococcus)生物存活下来。研究发现,之所以会出现这种现象,是因为人们在使用煤代替木材取暖,以及改造工业流程的过程中产生了污染物二氧化硫(SO2)。

  从19世纪下半叶开始,城市和工业区附近的地衣便逐年减少,主要表现为松萝属(Usnea)地衣等敏感物种消失,仅剩耐受性物种持续存活。

  目前,学界已经制定了不同的空气污染评估方法:

  • 定性方法:规定地衣与污染水平/空气质量的对应级别;
  • 定量方法:估算空气质量指数。

2.2. 定性方法

环境百科全书-地衣与环境质量-霍克斯沃思和罗斯方法对地衣的观察
图3. 法国里昂周边的空气污染监测结果,该检测基于霍克斯沃思和罗斯的方法(Hawksworth and Rose method)(详见参考文献及说明[3])对地衣进行观察,以微克每立方米(μg/m3)为单位,估算大气中的SO2含量。1984年至1996年间,由于大气中SO2含量有所减少,地衣重新在监测区定居[4]。[图源:论文,Khalil 2000-DR](图3.Zones区域)

  第一种方法首先基于对地衣的实地观察,估测总物种数及恢复再生物种的占比,而后构建地衣种类和SO2含量之间对应关系的尺度。目前使用最广泛的方法是由英国的霍克斯沃思和罗斯于1970年发明的。[3]该方法涉及约80种地衣,将污染分为11个等级(0-10级),0级为最高污染等级(污染物含量>170 μg/m3),10级为最低污染等级。1970年至1980年间,这种方法广泛应用于法国的许多研究。在此期间,SO2含量是最重要的指标,能够反映空气污染的整体水平。

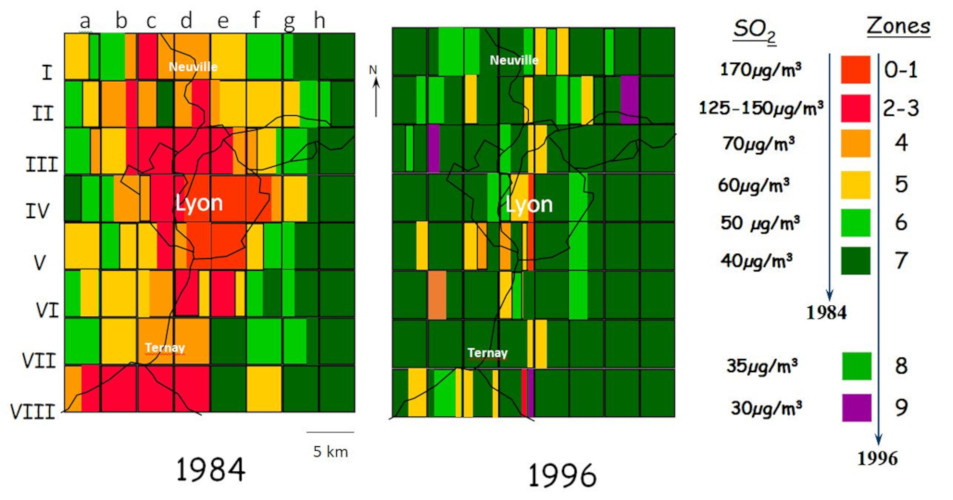
  20世纪80年代末,大气中SO2含量显著下降,卢森堡公园的树木[4]和法国其他城市先后开始重新出现地衣(图3)。

环境百科全书-地衣与环境质量-1984年至2012年期间观察到的地衣数量
图4. 1984年至2012年间观察到的地衣数量,以及同时期罗讷河流域的嗜氮地衣物种百分比(详见参考文献及说明[5])。1984年至1996年间,虽然观察到的地衣物种总数有所增加,但这一现象其实是因为大气中氮氧化物含量升高,导致嗜氮物种数量激增。[图源:© J. Asta](图4. Observation des lichens en vallée du Rhône 罗讷河山谷的地衣观察结果;Nbre espèces observées 观察到的物种数量;especes acidophiles 嗜酸物种;especes nitrophiles 嗜氮物种)

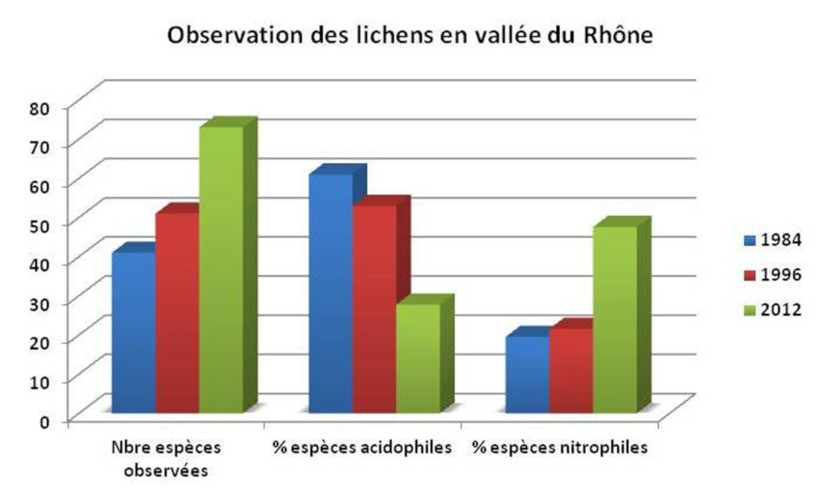
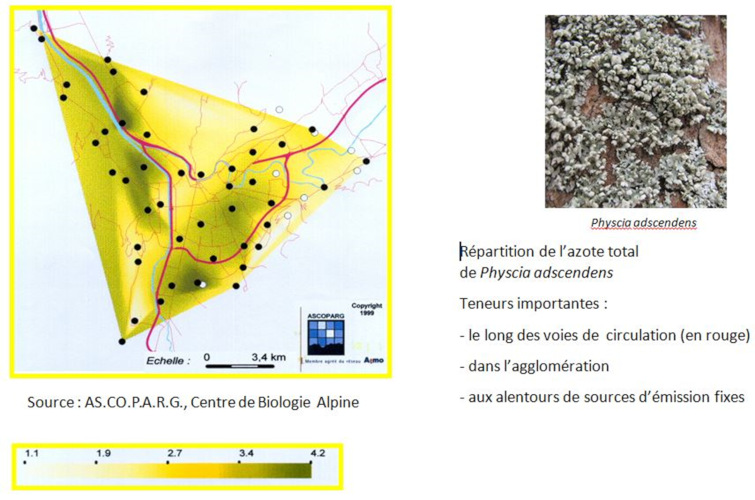
  然而,在SO2减少的同时,其他大气污染物却有所增加,其中包括与汽车交通有关的氮氧化物(NOx)、农村地区与农业活动相关的氨类化合物及有机化合物[5](图4)。

  在这种情况下,霍克斯沃思和罗斯的方法显然不再适用。学界于是引入了一种新方法,该方法不再基于地衣物种,而是基于物种群落进行观察,这使得建立生态诊断评分(eco-diagnostic score)机制成为可能。在该机制中,地衣不再是单一污染物的指标,而是空气质量的指标。这一方法涉及约30种地衣,将污染分为7种区域(A-G区),A区代表空气质量非常差,G区则代表空气质量非常好。该方法已在法国北半部、里昂地区等地得到应用。

2.3. 定量方法

环境百科全书-地衣与环境质量-地衣生物指数IBLE 方法在法国里昂及罗讷河谷北部地区的应用
图5. 附生地衣生物指数(Biological Index of Lichens Epiphytes,IBLE)方法在法国里昂及北罗讷河谷地区的应用。(详见参考文献及说明[5]) IBLE数值能够反映空气质量:低值表示空气质量较差或极差,高值表示空气质量中等或较好。由图可见,大部分人口都生活在IBLE数值最低的地区。[图源:© J. Asta]
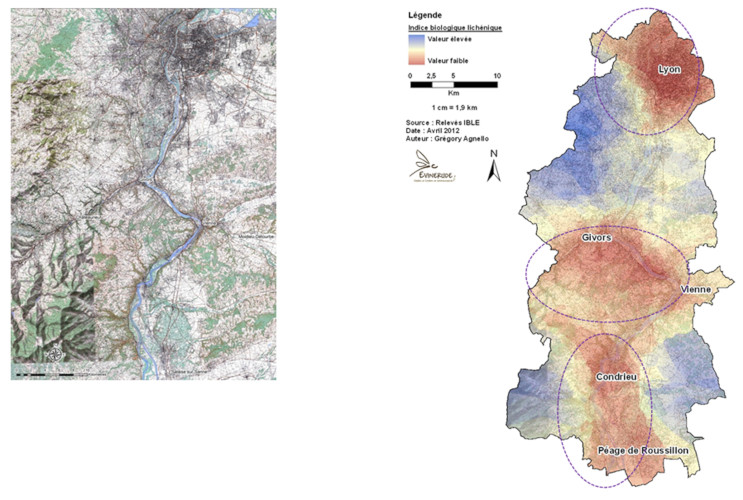
(图5.Lyon 里昂;Givors 日沃尔;Vienne 维埃纳;condrieu 孔德里约;Peage de Roussillon 鲁西永)

  这些方法的基础是根据数学公式计算的污染指数,该公式涉及与皮质地衣群落有关的不同参数。其中最著名的方法是勒布朗(Leblanc)和斯洛弗(Sloover)于1970年提出的I.P.A.(大气纯度指数)方法。[6]这种方法在法国,特别是巴黎、里昂[4]和格勒诺布尔地区,以及加拿大,意大利,西班牙,瑞士等国家均经常使用。

  相关研究随后也引入地衣多样性作为环境质量指标之一。2000年,11名欧洲科学家共同制定了一项单独协议,根据统计规则规定了抽样策略,该策略可以避免任何观察者的主观性。[7]

  此后,地衣指标打分规则先后在法国和欧洲得到完善,形成AFNOR标准。[8]这种监测附生地衣生物多样性的新方法以附生地衣生物指数IBLE为基础,该指数是根据物种的存在与否、出现频率和恢复情况计算得出的[5](图5)。

2.4. 氮和臭氧污染

  氮氧化物污染或多或少有利于嗜氮物种的生长,但对嗜酸物种不利。最早的相关研究之一是在法国马恩(Marne)省莱皮讷(l’Epine)圣母院的教堂中进行的,随着周围环境中菌落的变化,教堂的墙壁逐渐被大量的嗜氮地衣所覆盖。

环境百科全书-地衣与环境质量-格勒诺布尔地区翅叶蜈蚣衣总氮浓度(%)
图6. 格勒诺布尔(Grenoble)地区翅叶蜈蚣衣总氮浓度(%)(详见参考文献及说明[9]),右图为翅叶蜈蚣衣(Physcia Adscendens)。[照片来源:©J. Asta](图6. Source: AS.CO.P.A.R.G., Centre de Biologie Alpine 来源:AS.CO.P.A.R.G.,高山生物中心;Givors 日沃尔;Vienne 维埃纳;Physcia Adscendens 翅叶蜈蚣衣;Répartition de l’azote total de Physcia adscendens Teneurs importantes:- le long des voies de circulation (en rouge)- dans ‘agglomération- aux alentours de sources d’émission fixes 翅叶蜈蚣衣的总氮分布 含量最高的地区:-交通沿线(红色部分) -城市地区 -固定排放源附近)

  科研人员对格勒诺布尔地区机动车交通造成的二氧化氮(NO2)污染进行了研究(图6),并建立了相关量表,根据敏感性将指示地衣分为三类[9][10]。该量表是以地衣的生态参数、夏季NO2水平和当地的环境特征为基础的。

  针对臭氧污染,科研人员采取相同方法,并在格勒诺布尔地区[10]、瑞士和美国俄亥俄州等地建立了包含四个敏感性类别的量表。

3. 生物体内富集和生物标志

环境百科全书-地衣与环境质量-1975年至1985年期间在莫里安谷(萨瓦)测量的各种地衣中氟浓度的下降
图7. 1975年至1985年间在法国萨瓦省莫里耶讷山谷的各种地衣中监测到的氟浓度下降。两条曲线分别代表叶状地衣袋衣(Hypogymnia physodes)和枝状地衣糠秕假扁枝衣(Pseudovernia furfuracea)[图源:改编自参考文献及说明[11];照片来源:J. Asta & C. Remy](图7.Teneur en Fluor (ppm) 氟含量(ppm);Hypogymnia physodes 袋衣;Pseudovernia furfuracea 糠秕假扁枝衣)

  地衣可作为生物富集物,用来检测累积污染物;或作为生物标志物,用来反映生理或细胞效应。

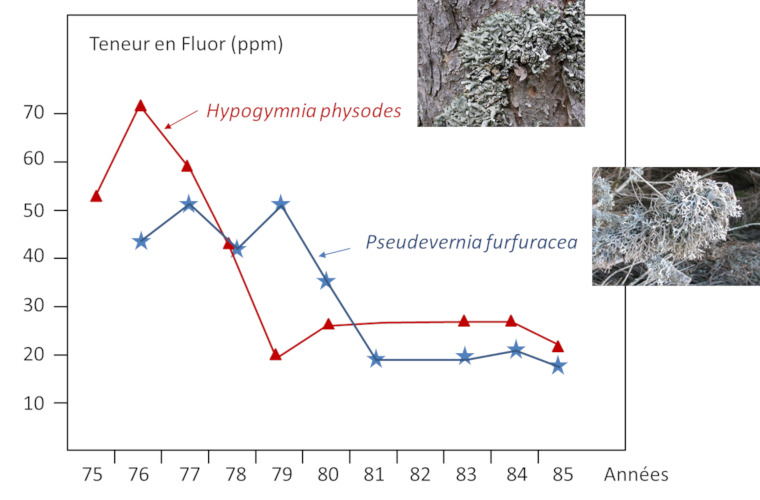
  20世纪70年代和90年代,阿尔卑斯山谷的铝厂排放的氟化物被地衣大量吸收并蓄积。相关研究显示了氟化物在空间和时间上的分布[11](图7)。

环境百科全书-地衣与环境质量-从采矿作业中采集的受大气铁污染的雀石蕊
图8. 加拿大魁北克省的采矿作业导致雀石蕊(Cladonia stellaris)受到大气中的铁污染,图为工作人员采集受污染的地衣。[图源:© G. Agnello]

  此外,地衣还可以监测金属微量元素的蓄积情况。科研人员广泛研究了法国北部巴黎地区道路交通造成的铅污染,并在比利牛斯山脉[12]、阿尔卑斯山脉及全球其他地区研究了其他金属的污染(图8)。

  在伊泽尔(Isère)[13]和敦刻尔克(Dunkirk)的海岸,可以很好地观察到焚烧厂(incineration plant)等工业设施的废气排放活动。[14]

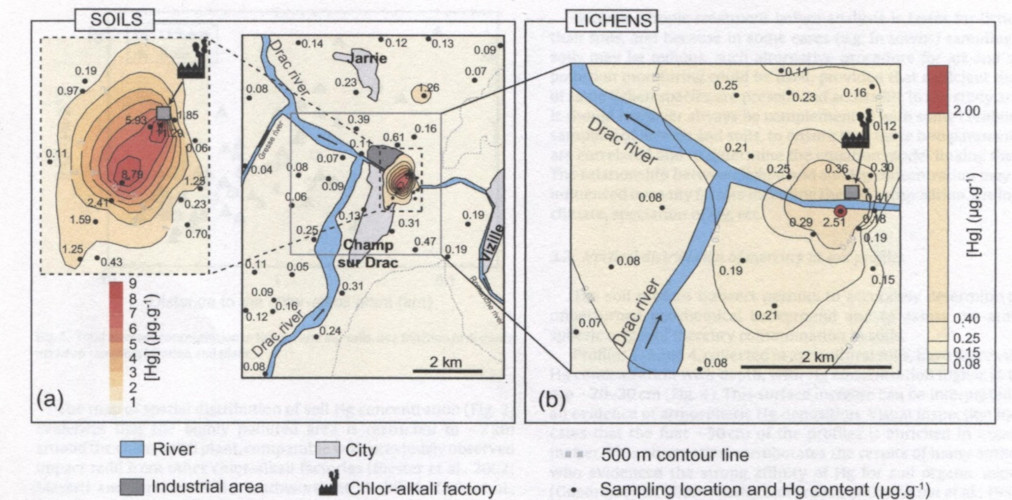
  氯碱厂会向大气排放汞,该元素沉降后会被黄鳞地衣(Xanthoria parietina)吸收。对该地衣的测定结果表明,在污染工厂周围半径2公里以外的区域,汞浓度会降低(图9)。[15]

环境百科全书-地衣与环境质量-贾里(Jarrie)氯碱厂周围的土壤和地衣中的汞浓度
图 9. 贾里(Jarrie)氯碱厂周围的土壤和地衣中的汞浓度(详见参考文献及说明[15],已授权)[图源:© 爱思唯尔](图7.River 河流; City 城市区;500 m contour line 等高线;Industrial area 工业区;Chlor-alkali factory 氯碱厂; Sampling location and Hg content /ug·g-1 取样点与汞浓度(ug·g-1);Soils 土地;Lichens 地衣)

  利用地衣进行的环境生物监测提供了关于氯化联苯(PCBs)、二恶英、多环芳烃等有机化合物的宝贵信息。这些化合物在地衣中的浓度系数远高于大气。一项战略因此制定,该战略可在使用地衣等生物指标,评估大气中持久性有机污染物对环境的污染时作为遵循。[16]

  放射性元素也会在地衣中累积。从20世纪50年代到70年代,在前苏联进行了首批核试验,将放射性元素(主要是锶-90和铯-137)排入大气层。在这些元素沉降后,科研人员对其进行了分析。[17]

  1986年切尔诺贝利事故后,驯鹿群因摄入被放射性元素污染的地衣而受到污染。为了防止人们食用受污染的驯鹿肉,整个鹿群被宰杀。

  通过对人类活动的“记忆”效应,地衣植物标本(herbarium samples)还可用于分析各种有机或无机污染物、放射性元素等。

  在地衣稀少或缺乏的地区,可以有效地应用移植技术[18]种植地衣,特别是树生地衣。在家庭垃圾填埋场等地也可以种植地衣,来监测空气污染。

  此外,针对生物蓄积物的使用,有关部门也制定了AFNOR标准。该标准描述了地衣原位取样和制备样品的方法,这些样品主要用于蓄积空气污染特征物质。

4. 其他类型的污染

4.1. 海洋污染

  碳氢化合物、阴离子表面活性物质等各种污染物能够在海洋中扩散,在海面上形成几微米的薄膜。这些污染物可以接触到海岸上的地衣,造成各种类型的损害。地衣可用作地中海沿岸海洋气溶胶污染的生物指示器和生物富集物。

4.2. 淡水污染

环境百科全书-地衣与环境质量-水中的地衣
图10. 水中的地衣。左:皮果衣(Dermatocapon luridum);右:癞叶衣(Vezdaea leprosa)。[图源:©J. Lagrandie]

  地衣中的皮果衣可用作水中金属元素的生物富集物(图10A)。[19]最近,一种比细菌更易于使用的“生物传感器”被开发出来,用于检测通过工业途径或意外排放到水生环境中的苯(图10A)。

4.3. 土壤污染

  一些耐受性较强的土壤地衣可以在含有金属元素的土壤上生长,因此可以表明这些金属的存在。藓生双缘衣(Diploschistes muscorum)、石蕊属(Cladonia)和珊瑚枝属(Stereocaulon)地衣等都对土壤中的高含量金属有耐受性。例如,癞叶衣(Vezdaea leprosa)就格外依赖锌,因而经常出现在道路安全的锌滑道附近。(图10B)。

5. 评估环境和健康风险的模型系统

环境百科全书-地衣与环境质量-地衣生物多样性与当地年轻男性居民肺癌死亡率
图11. 左图:意大利威尼托地区的地衣生物多样性(a),图中所用数据为10个单位抽样网格记录的所有地衣的频率值之和;(b)当地年轻男性居民肺癌死亡率(表示为预期x100)。[图源:基于Cislaghi & Nimis (1997)的研究结果,已授权](图11.Index de diversité lichénique 地衣生物多样性指数;Mortalité due au cancer du poumon肺癌死亡率)

  为什么说地衣是评估环境和健康风险的优秀生物模型?在特定地区,丰富的地衣表明空气和环境质量良好,少有或没有污染物。然而,如果地衣植被稀疏,则表明此处空气和环境质量较差,存在大气污染物,可能影响人类健康、降低生活质量。空气和环境质量将地衣植被与人类健康,乃至人口社会条件联系到了一起。仅凭地衣,我们便可小见大,一窥居民健康问题或社会经济状况。正因如此,人们才会对地衣研究饶有兴趣。以下两个例子就是这一观点的真实写照:

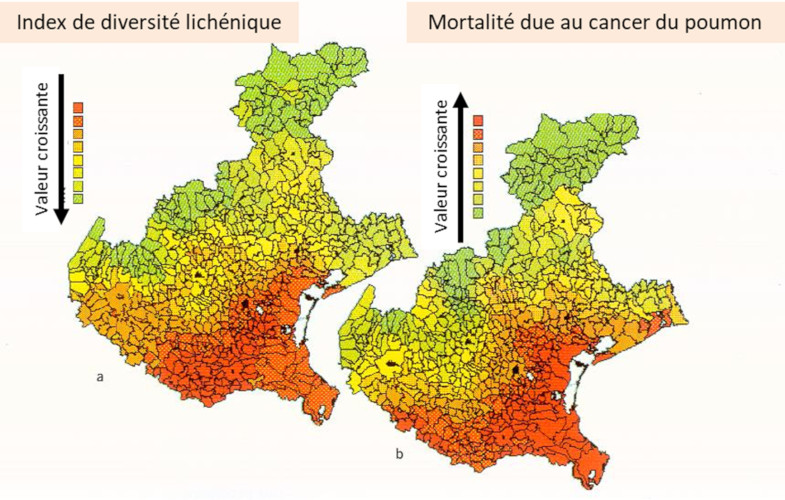
  • 在意大利威尼托进行的研究表明[20], 55岁以下男性肺癌死亡率与地衣生物多样性指数密切相关。对比图11中两张地图可知,地衣多样性指数高的地区(绿色地带),地衣数量较多,环境较好,肺癌发病率也较低。而在地衣多样性指数低的地区(红色区域),地衣数量较少,环境较差,肺癌死亡率也较高。
  • 最近在敦刻尔克工业区进行的一项研究表明,地衣浸渍比率(表征人口的社会经济状况)和地衣受金属微量元素污染程度之间存在着较为显著的关系。该研究结果表明,该地在卫生方面存在环境和社会不平等。[21](详见《环境不平等》)。

6. 总结

  • 除了深海、活体动物组织和严重污染地区,地衣可以在所有环境中生长。
  • 尼兰德是一位19世纪末的芬兰地衣学家,他通过观察巴黎卢森堡公园的树木,首次提出了地衣对空气污染敏感的观点。当时,燃煤和工业发展产生二氧化硫(SO2)并排入大气,人们认为,正是这一原因导致了地衣的消失。
  • 目前已有多种基于地衣的检测方法,可以通过对地衣的观察,检测空气污染的影响,并绘制影响图。
  • 自1989-1990年以来,随着SO2排放量的减少,对该污染物敏感的地衣也重出江湖。然而,其他污染物,如氮氧化物仍然存在,“亲硝基”地衣也因此泛滥。
  • 地衣不仅能够积累金属、有机元素、放射性元素等各种污染物,而且可作为生物传感器使用,对大气、水或土壤中的污染物进行分析。
  • 地衣生物指示和分析样品制备标准现已制定。
  • 地衣是评估环境和健康风险的优良生物模型。


参考资料及说明

封面照片:海绿宽叶衣(Platismatia glauca),一种生长在落叶和针叶树枝干上的叶状地衣,具有喜湿、喜光、规避污染的特点,常见于丘陵和亚高山地带。[图源:©J. Joyard]

[1] 由多糖组成的一种物质,遇水膨胀后稠度与明胶相似,质地浓厚,偶有黏性。

[2] Nylander, W. 1866 – The lichens of the Luxembourg Garden. Bull. Soc. Bot. Fr.,13, 364-372 : Nylander, W. 1896 – The lichens of the surroundings of Paris. Ed. Schmidt, 142p.

[3] Hawksworth, DL. Rose, F. 1970 – Qualitative scale for estimation sulphur dioxide air pollution in Great Britain and Wales using epiphytic lichens. Nature, 227, 145-148.

[4] Khalil K. 2000 – Use of plant bioindicators (lichens and tobacco) in the detection of air pollution in the Lyon region. Thesis University Grenoble. 284p.

[5] Agnello, G., Catinon, M., Ayrault, S., Boudouma, O., Asta, J., Reynaud, S. & Tissut, M. 2014 – Monitoring the evolution of cumulative air pollution in an area of the Rhône Valley. International Workshop. Air quality biomonitoring using plants and fungi. Lille New Century October 13-14, 23p.

[6] Leblanc, F. and De Sloover, J. 1970. Relation between industrialization and the distribution and growth of epiphytic lichens and mosses in Montreal. J. Bot., 48, 1485-1496.

[7] Asta, J. Erhardt, W., Ferretti, M., Forasier, F., Kirschbaum, U. Nimis, P.L., Purvis, W., Pirintsos, S. Sheidegger, C. Van Haluwyn, C. & Wirth, V. 2002. Mapping Lichen diversity as an indicator of environmental quality. In P.L. Nimis, C. Sheidegger & P.A. Wolseley (Eds). Monitoring with lichens-Monitoring lichens. Kluwer, 273-279.

[8] 欧洲标准CEN NF-EN-16413.2014 -地衣生物监测:附生地衣多样性评估

[9] Gombert, S., Asta, J. & Seaward, MRD. 2003- Correlation between the nitrogen concentration of two epiphytic lichens and the traffic density in an urban area. Pollut. 123, 281-290.

[10] Gombert, S., Asta, J. & Seaward, MRD. 2006 – Lichens and tobacco plants as complementary biomonitors of air pollution in the Grenoble area (Isère, southeast France). Indic, 6, 429-443.

[11] Belandria, G. Asta, J. & Garrec, JP. 1991 – Diminutions of fluorine contents in lichens due to a regression of pollution in an alpine valley (Maurienne, Savoie, France) from 1975 to 1985. Ecol. Alp. Grenoble, volume 1, 45-58.

[12] Veschambre, S., Amouroux, D., Moldovan, M., Etchelecou, A., Asta, J. & Donard, O.F.X. 2003. Determination of metetallic pollutants in atmospheric parties, wet deposition and epiphytic lichens in the Pyrenees mountains (Aspe Valley). Phys. IV, 107, 1341-1344.

[13] Agnello, G. Study Report. Lycene bioaccumulation. In BIO-TOX. 2017 monitoring campaign around the Bourgoin-Jallieu incineration plant (38). Appendix 2. 46p.

[14] Cuny, D., Denayer, F.O., De Foucault, B., Schumacker, R., Colein, P. & Van Haluwyn, C., 2004. Patterns of metal soil contamination and changes in terrestrial cryptogamic communities. Pollut, 129, 391-401.

[15] Grangeon, S., S. Guédron, J. Asta, J., J., G. Sarret & L. Charlet. 2012- Lichen and soil as indicators of an atmospheric mercury contamination in the vicinity of a chlor-alkali plant (Grenoble, France). – Indic.13(1): 178-183.

[16] Augusto S., Máguas C. M., & Branquinho C. 2013 – Guidelines for biomonitoring persistent organic pollutants (POPs), using lichens and aquatic mosses -a review. Pollut, 180, 330-338.

[17] 1996年,切尔诺贝利灾难发生10年后,科研人员在位于法国伊泽尔(Isère)省查尔特勒(Chartreuse)山脉的科尔德波特(Col de Porte)山进行了分析,结果显示,该地的糠枇假扁枝衣(Pseudevernia furfuracea)样本中,铯134和137的含量仍然很高。(委员会成员J. Asta)

[18] 移植技术是指从健康区域提取地衣,将其置于污染地点,而后进行空间和时间上的监测。根据所选的协议不同,不同污染点位上的健康地衣的监测时长也不同,可持续1个月、3个月或1年不等。在此期间收集到的监测数据将用于对累积污染物进行分析。

[19] Monnet, F., Bordas, F., Deluchat, V., Chatenet, P., Botineau, M., & Baudu, M. (2005), Use of the aquatic lichen Dermatocarpon luridum as bioindicator of copper pollution: Accumulation and cellular distribution tests. Pollut, 138,3, 455-461

[20] Cislaghi, C. & Nimis, P.L. 1997 – Lichens, air pollution and lung cancer. Nature, 387, 463-464.

[21] Occelli, F., Bavdek, R., Deram, A., Hellequin, A.P., Cuny, M.A., Zwarterook, I. & Cuny, D. (2016) Using lichen biomonitoring to assess environmental justice at a neighbourhood level in an industrial area of Northern France. Indic, 60, 781-788.


The Encyclopedia of the Environment by the Association des Encyclopédies de l'Environnement et de l'Énergie (www.a3e.fr), contractually linked to the University of Grenoble Alpes and Grenoble INP, and sponsored by the French Academy of Sciences.

To cite this article: ASTA Juliette (March 13, 2024), 地衣与环境质量, Encyclopedia of the Environment, Accessed July 27, 2024 [online ISSN 2555-0950] url : https://www.encyclopedie-environnement.org/zh/vivant-zh/lichens-environmental-quality/.

The articles in the Encyclopedia of the Environment are made available under the terms of the Creative Commons BY-NC-SA license, which authorizes reproduction subject to: citing the source, not making commercial use of them, sharing identical initial conditions, reproducing at each reuse or distribution the mention of this Creative Commons BY-NC-SA license.