Weather Extremes and Climate Change
PDF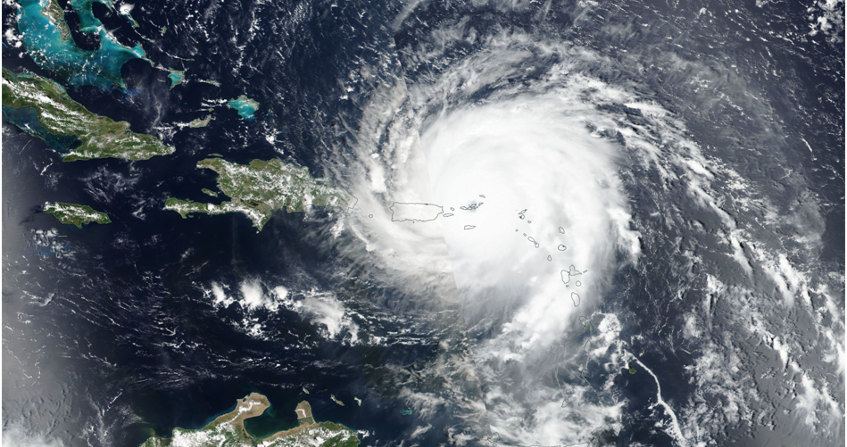
How do extreme weather events change with climate change? Are they becoming more frequent? More intense? Is it man’s responsibility? This article presents the state of scientific knowledge on this subject. Recent and future trends in temperature extremes, hydrological extremes, tropical cyclones and extra-tropical storms are discussed, accounting for the uncertainties associated with natural climate variability and numerical modelling. Climate change is already modifying and will continue to modify the probabilities of weather hazards, making some extreme events more frequent and/or intense, and others less so. However, one should not want to hold humans alone responsible for any meteorological event, but rather wonder, in probabilistic terms, how human activities have changed the risk of the occurring event.
1. A difficult link between weather and climate
Heat waves, cold spells, heavy rains, droughts, hurricanes, storms and other extreme weather events are regularly in the news, particularly because of their significant impacts on societies and the environment. The question of the link between the occurrence of such events and climate change is legitimately asked to scientists, and is the subject of increasing work. The answer is not always trivial, especially since the increasingly systematic media coverage of these phenomena and the sometimes increased vulnerability of populations to weather hazards can give a false impression of climate trends.

The study of recent or future trends in extreme weather events is generally done for each type of event. Thus, this article will focus successively on temperature extremes, hydrological extremes, tropical cyclones (generic term including hurricanes and typhoons) and extra-tropical storms. We will see that several studies show that changes are already detectable in the frequency and/or the intensity of some types of extreme events, and that others may appear or increase during the 21st century. These qualitatively robust results should not mask two major difficulties in the study of extreme events:
- The first is the predominant role of natural climate variability in these phenomena, which tends to make the anthropogenic signal unclear and requires high quality observations and/or a large number of simulations to be able to detect changes.
- The second is the imperfect nature of climate models, hence the need to further develop and evaluate them and to rely on a multiplicity of models that are as independent as possible.
2. Temperature extremes
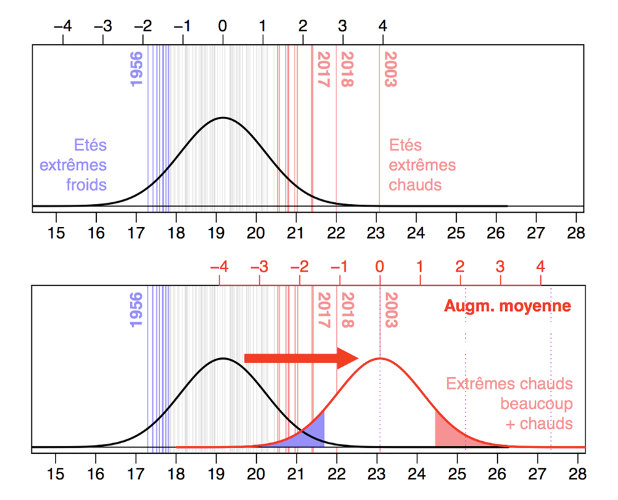
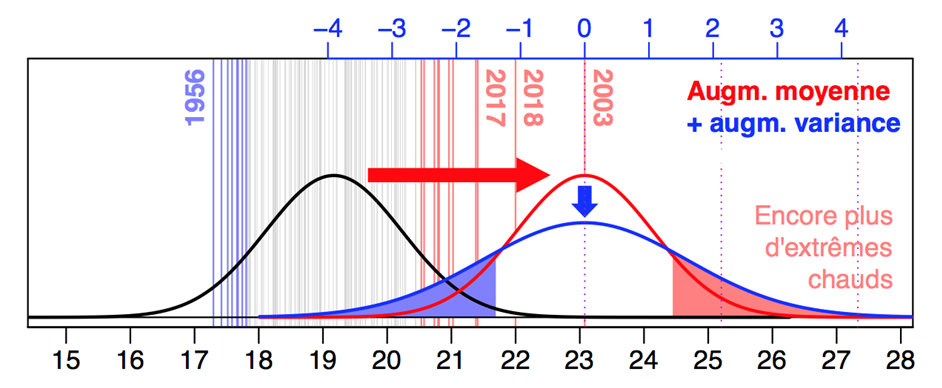
The global warming observed over more than a century affects not only the average temperature, but also the entire statistical distribution of temperatures, i.e. the entire range of possible temperatures in one place and one moment. At the extremes of this distribution are the rarest events – the cold and hot extremes – whose occurrence is generally accompanied by significant socio-environmental impacts. Extremes are traditionally defined in terms of their frequency of occurrence, or, in statistical terms, by the quantiles of their distribution. For example, it is common practice to describe a day as unusually hot when its temperature is in the top 10% of the expected values for that day (i.e., it is said to “exceed the 90th percentile – or 9th decile – of the distribution”). By construction, over the period used as a reference, 10% of the days are considered unusually hot. A symmetrical definition is used for abnormally cold days, and the seasonal temperature cycle is generally taken into account, so that we can talk about warm days in winter or cold days in summer. To study the evolution of these extremes, we consider either the evolution of their frequency (number of days below or above the current temperature decile) or the evolution of their intensity, defined for example as the average temperature of the 10% of extreme days.
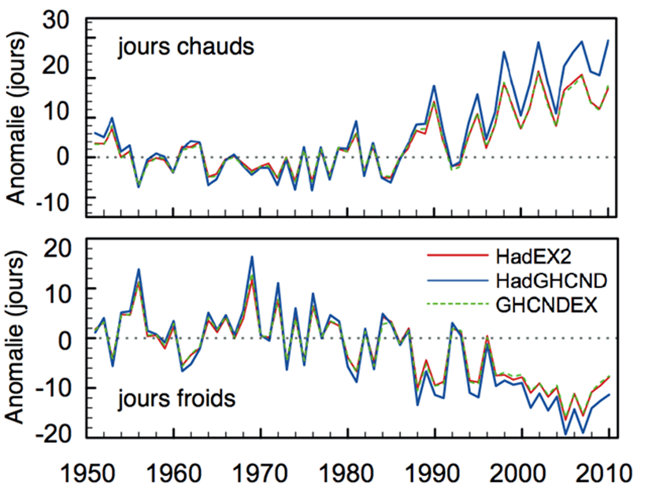
2.1. Occurrence of extreme days
2.2. Heat and cold waves
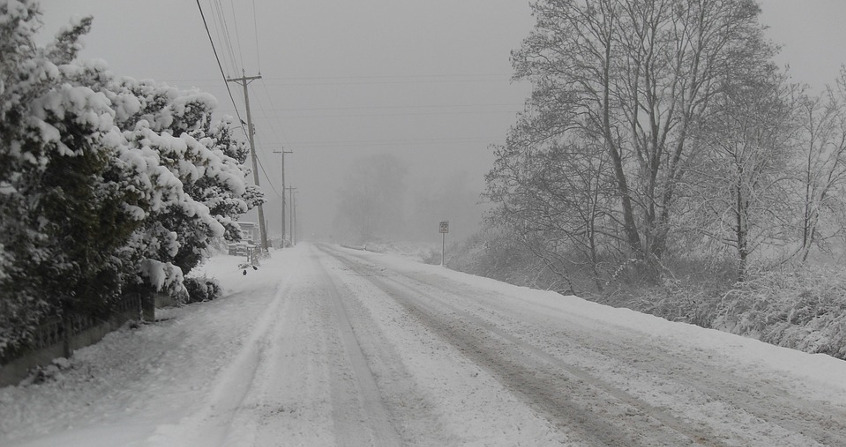
Beyond daily statistics, heat waves – several consecutive hot days – tend to be more frequent, more intense and/or longer, while the number of cold waves has decreased substantially since 1950. While recent heat waves, such as the one in August 2003 in Western Europe, correspond qualitatively to what is expected from a warmer climate, the few recent winter cold spells observed in Europe (winter 2009/10, December 2010, February 2012) may seem to contradict the idea of global warming.
There is in fact no paradox in the fact that cold episodes can occur locally and occasionally in a context of global warming. This is the difference between meteorological hazard and a climate trend on the long term.
Warming is a background process, superimposed on the noise of the natural internal variability of the climate system [read Climate Variability: the example of the North Atlantic Oscillation]. Though variability may continue to cause cold weather events, they are expected to be less frequent and/or less intense due to the global warming [see focus Attribution of singular weather events to climate change: the 2003 heat wave]. Once again, this is exactly what we are seeing: the coolness of recent cold waves is only relative compared to the freezing winters of 1939/40 and 1962/63, which were similar in terms of atmospheric circulation.
Finally, it cannot be ruled out that the warming of recent years, which has been particularly pronounced in the Arctic, may have temporarily disrupted the circulation of air masses at our latitudes, and increased the probability of weather situations producing cold waves over Europe. However, this point is still very much debated within the scientific community.
2.3. Evolutions over the 21st century
Whatever the scenario, global warming will continue – more or less strongly – during the 21st century. Thus, not surprisingly, the trends in temperature extremes observed over the recent period are confirmed in climate projections: hot extremes increasingly frequent and intense, and cold extremes increasingly rare and less marked. However, the magnitude of these changes is largely dependent on the choice of the greenhouse gas emission scenario. It also varies from one model to another for a given scenario and remains strongly modulated by internal climate variability.

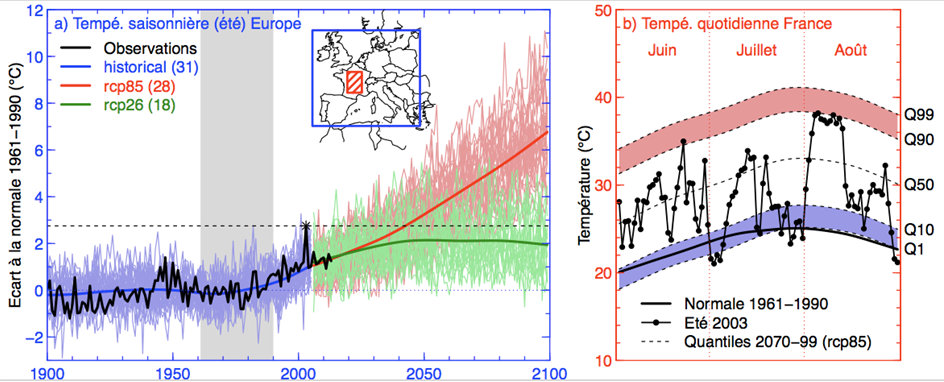
In addition to the uncertainties associated with the scenario selection and with the internal climate variability, the future evolution of temperature extremes is sensitive to the choice of the numerical climate model, particularly at regional and seasonal scales. In Europe, in the RCP8.5 scenario, the probability of exceeding the current 90th percentile (or 9th decile) of summer temperature – which is by construction 10% on the current climate – ranges from 30% to 90% depending on the model on average over the future summers 2070-2100.
These uncertainties also affect the characteristics of multi-day events. For example, although future projections agree on the increase in the frequency, intensity and duration of European summer heatwaves, their evolution by 2100 varies by a factor of three, for a given scenario, depending on the numerical model considered.
3. Hydrological extremes
Apart from the temperature increase, the increase in the greenhouse effect is likely to disrupt the global hydrological cycle (water exchanges between the atmosphere, the ocean and continents; read: Are we at risk of water shortage? ) and its extreme events (heavy rainfall and droughts in particular), for several reasons:
- Surface warming promotes evaporation, especially in regions where water is always available (oceans and humid continents).
- In accordance with the Clausius-Clapeyron relationship (read Thermodynamics a plot of a rising air parcel in a cumulonimbus), a warmer atmosphere has its maximum water vapour content increased by about 7% per degree of warming, potentially allowing a larger atmospheric water reservoir to be mobilized in a warm climate when weather conditions are favourable to precipitation.
- Finally, rainfall patterns can be impacted by possible changes in atmospheric circulation since it is this circulation that transports most of the water vapour that will contribute to precipitation in a given location.
The response of hydrological extremes is particularly difficult to understand because of its spatio-temporal heterogeneity and of the direct influence (apart from climate change) of humans on continental water flows and storage.
Available in situ observations show that there is already an increase in the number and/or intensity of heavy rainfall in some regions of the world, particularly in Europe and North America where relatively long measurement series are available. For France, no systematic assessment of extreme precipitation trends is yet available.
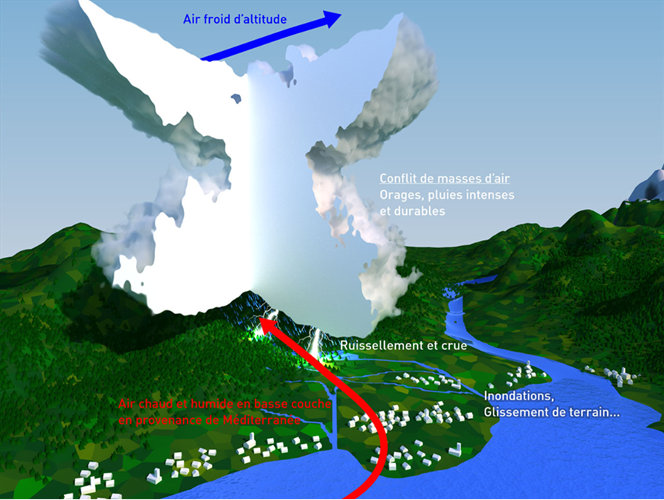
3.1. “Mediterranean events”
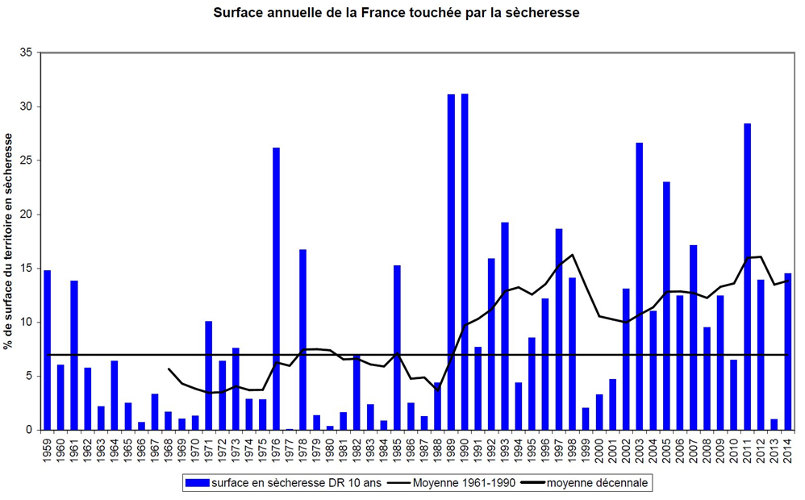
3.2. Droughts
3.3. Future global hydrological changes
Future projections suggest some qualitatively robust changes, including an increase in spatial and temporal contrasts in precipitation around the globe, often summarized by the motto “wet get wetter, dry get drier“. If this pithy motto is still the subject of debate within the scientific community, the drying up of the Mediterranean basin and more generally a poleward expansion of arid and semi-arid zones seems inevitable. As a result, the contrast between the European North (wettest) and South (driest) is expected to increase, and some recent work even suggests that most numerical climate models underestimate the summer drying of the northern hemisphere mid-latitudes.
These models also indicate a relatively widespread intensification of heavy precipitation events in response to global warming, including in areas that will experience an average drying. The exceptions to this increase in extreme rainfall are mainly in subtropical regions. In the simulations, this intensification of heavy rainfall is all the more pronounced as the scenario of increasing greenhouse gas concentrations is high. Also, the shorter the period of analysis of precipitation accumulation (daily to hourly accumulations), the more frequent and intense heavy precipitation is projected to be. This intensification occurs at a rate that sometimes exceeds the 7% per degree of average warming predicted and observed for atmospheric water vapour. However, these numerical results should be considered with caution due to the limited horizontal resolution of most models and their simplified representation of the processes associated with these extreme events.
The expected intensification of the hydrological cycle in warmer climates also results in an increased risk of drought in many parts of the world, including some regions where the average annual precipitation increases during the 21st century. This is due both to an increase in the temporal variability of precipitation (increase in the number of consecutive days without rain) and to an increase in evapotranspiration (evaporation of continental surfaces and transpiration from plants to the atmosphere). In summary, global warming therefore affects both ends of the precipitation distribution, making both intense rainfall events and drought episodes more likely.
Mediterranean-type climates (around the Mediterranean, but also some regions of Australia, South Africa, or America) are likely to be particularly affected by these hydrological changes, while more generally, a shift of arid zones towards mid-latitudes is expected. Although oversimplified, the paradigm “rich get richer, poor get poorer” thus reflects a predictable increase in inequalities in the climatic water supply. In France, a decrease in the quantity of water available in the soil is expected, as well as a decrease in the low levels of most rivers.
4. Tropical Cyclones
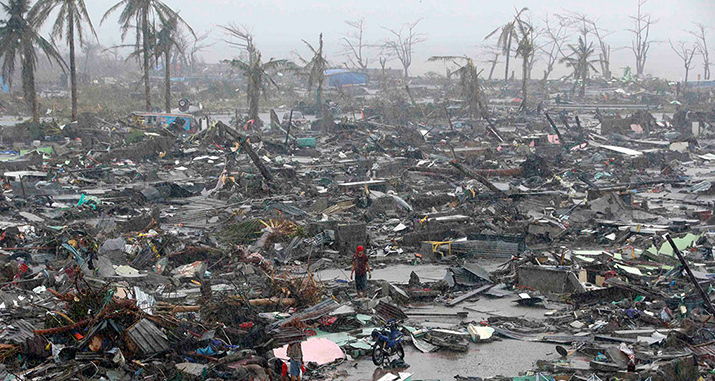
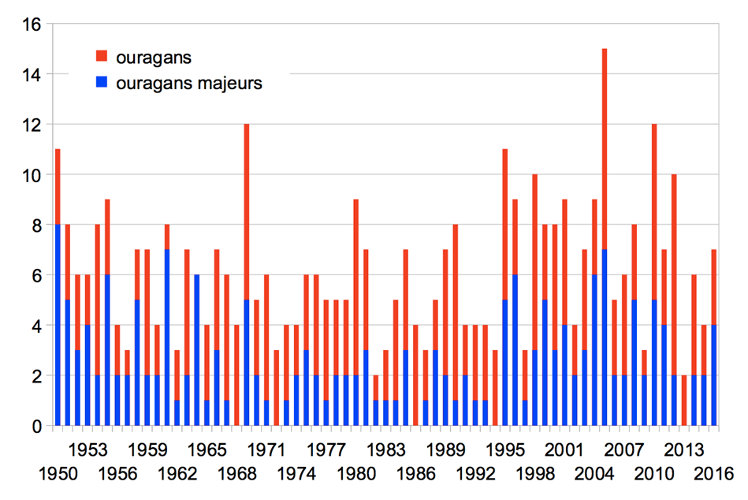
Tropical cyclones, also known as hurricanes (in the Atlantic) or typhoons (in the Pacific), are by far the most devastating meteorological events, both in terms of their power and of the population affected (read Tropical Cyclones: development and organization and Tropical Cyclones: impacts and risks). It was only since the 1970s that a systematic observation of cyclones has been possible with the advent of satellites. Thus, any trend estimated over the entire 20th century is questionable (Figure 9).
Modelling tropical cyclones faces the difficulty of representing these phenomena in numerical climate models. Indeed, their small size (from a few tens to several hundred kilometres) requires the use of climate simulations on very fine calculation grids (around 50 km) in order to represent them realistically. The grid of a model can be thought of as a network of points of which the mutual distance limits the size of the smallest phenomenon that can be simulated.
Despite this limitation on their simulation, the work carried out to date converges on the trend of cyclonic activity for the end of the 21st century. Thus, climate models suggest that the total number of tropical cyclones would remain stable or even decrease in warmer climates, as conditions conducive to their onset would become somewhat rarer. On the other hand, once triggered, cyclones draw their energy from the heat content of the first 50 metres of the surface ocean. In a warmer world, the strongest cyclones would therefore see their intensity increase: stronger maximum winds and more intense associated rains. Cyclone Irma, which hit the islands of Barbuda, St. Martin and St. Barthélemy in 2017 as a category 5 cyclone (cover image), is a good example of these most intense cyclones, whose probability of occurrence is expected to increase with warming in the Atlantic basin. The most recent work also indicates a possible extension towards the poles (beyond the tropics) of regions affected by tropical cyclones.
It should also be borne in mind that the damage caused by cyclones does not only depend on their intrinsic characteristics (intensity, trajectory, etc.), but also on associated phenomena, such as storm surge. The observed sea-level rise, projected for the 21st century, thus makes coastal regions increasingly vulnerable to cyclonic phenomena by submersion, such as the one caused by Cyclone Pam in 2015 in Vanuatu. In addition, a trend that seems to be well marked in climate projections concerns the intensity of rainfall associated with cyclonic phenomena. This intensity shows a significant increase in models for the end of the 21st century, sometimes beyond the 7% per degree of warming suggested by the Clausius-Clapeyron formula. The latter aspect of tropical cyclones is particularly important in a context where coastal cities are becoming denser and thus more vulnerable to flood risks. Recently, Cyclone Harvey (August 17 to September 2, 2017) dramatically illustrated the effects of heavy cumulative rainfall over the life of the system, worsened by the stagnation of the system over the city of Houston.
5. Extra-tropical storms
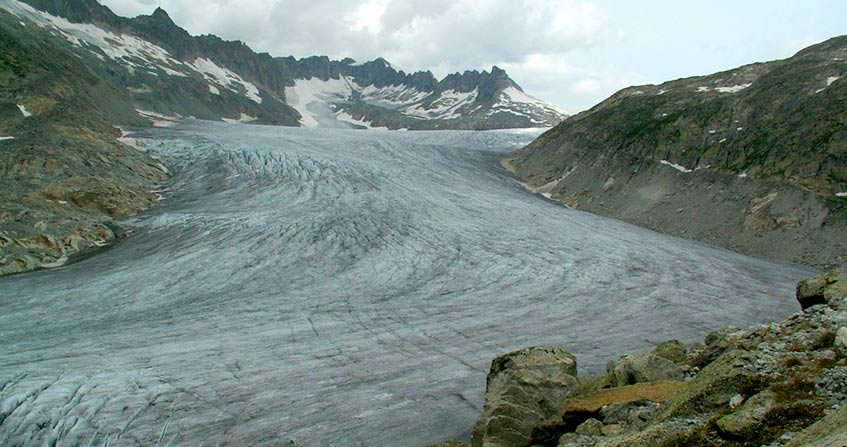
Storms – and more generally atmospheric circulation – in mid-latitudes are related to the temperature difference between the equator and the poles (read Atmospheric circulation: its organization). Their recent and future evolution therefore depends on the meridional contrasts of global warming. In the Northern Hemisphere, at the surface, the recent and projected melting of the Arctic ice pack results in a more pronounced warming at the pole, which reduces the temperature gradient between the pole and the equator. On the other hand, warming peaks at the top of the troposphere (about 10 km above sea level), reinforce this same gradient. The evolution of the atmospheric dynamics of the mid-latitudes, including depressions and storms, therefore depends on the competition in warming between these two regions, i.e. the upper tropical troposphere against the lower Arctic troposphere. More regional factors, such as the distribution of warming over the North Atlantic, can also modulate the evolution of lows over Europe. If we add to this the great natural variability of the climate system at these latitudes (read Climate variability: the example of the North Atlantic Oscillation), and the fact that only a fraction of the depressions evolve into real storms, we can understand that with the current state of knowledge, the effect of global warming on these phenomena remains very uncertain.

6. Conclusions: More frequent or intense extreme phenomena
The study of extreme weather events is a major scientific and societal challenge. Climate change is already modifying and will continue to modify the probabilities associated with weather hazards. But these changes do not always go in the same direction, as some oversimplified, alarmist or climatosceptical messages sometimes suggest. Thus, while global warming makes some extreme events more frequent and/or intense (heat waves, intense rainfall episodes, droughts), others are less likely (cold waves). The scientific message may even be more complicated:
- For cyclones, the state of knowledge suggests a slight decrease in the total number but an increase in the number of cyclones of the strongest categories.
- As for mid-latitude storms, their evolution with climate change remains largely uncertain (which does not mean “misunderstood”).
Beyond the knowledge already acquired, many scientific questions remain. The World Climate Research Programme has made this topic one of its priorities for the next decade. This challenge has multiple dimensions such as the establishment, operation and/or homogenization of the observation network, the improvement of numerical climate models and the evaluation of their ability to simulate extreme events, the development of statistical tools to detect, attribute and understand their climatic evolution, and research on their predictability at different time scales (season, decade, etc.).
Finally, it should be reiterated that even though climate change is expected to affect extreme weather events, it should not be systematically blamed when an event occurs. More specifically, we should not want to hold humans alone responsible for some meteorological event, but rather wonder, in probabilistic terms, how human impacts have changed the risk of the event.
7. Take home messages
- Human-induced climate change is already modifying and will continue to modify the probability of weather hazards.
- Most extreme events (e.g. heat waves, heavy rains, cyclones) become more frequent and/or intense, some become less likely (e.g. cold waves), while for others, the signals are contrasted (e.g. storms).
- Humans cannot be held solely responsible for any observed event; on the other hand, we can estimate how human impacts have modified the probability of the event.
- Climate variability and the heterogeneity of historical data make it difficult to detect trends in observations.
- Improved numerical climate modelling tools will reduce the uncertainties associated with the future evolution of extreme events.
Notes and references
Cover image. Hurricane Irma on the Lesser Antilles (Sept. 6, 2017) [Source: © NASA/Goddard Space Flight Center Earth Science Data and Information System (ESDIS) project.]
[1] Intergovernmental Panel on Climate Change (IPCC), 2013, Fifth Assessment Report, Scientific Elements, Contribution of Working Group I (http://ipcc.ch/report/ar5/wg1/).
[2] Boucher et al (2015) Projection of future climate change, La Météorologie, n°88, p.56-68. Doi: 10.4267/2042/56362
[3] ClimSec project. See Soubeyroux et al (2012) Soil droughts in France and climate change: Results and applications of the ClimSec project. La Météorologie nº78, p.21-30. doi: 10.4267/2042/47512 and CNRM website: https://www.umr-cnrm.fr/spip.php?article605&lang=en
The Encyclopedia of the Environment by the Association des Encyclopédies de l'Environnement et de l'Énergie (www.a3e.fr), contractually linked to the University of Grenoble Alpes and Grenoble INP, and sponsored by the French Academy of Sciences.
To cite this article: CATTIAUX Julien, CHAUVIN Fabrice, DOUVILLE Hervé, RIBES Aurélien (January 5, 2025), Weather Extremes and Climate Change, Encyclopedia of the Environment, Accessed July 25, 2026 [online ISSN 2555-0950] url : https://www.encyclopedie-environnement.org/en/climate/extreme-weather-events-and-climate-change-2/.
The articles in the Encyclopedia of the Environment are made available under the terms of the Creative Commons BY-NC-SA license, which authorizes reproduction subject to: citing the source, not making commercial use of them, sharing identical initial conditions, reproducing at each reuse or distribution the mention of this Creative Commons BY-NC-SA license.