


极端天气和气候变化
极端天气事件是如何随着气候变化而变化?它们是否越发频繁?更加剧烈?这是人类的责任?这篇文章介绍了与这一主题相关的科学知识,探讨了极端温度、极端水文、热带气旋和特大热带风暴最近及未来的发展趋势,解释了自然气候变化和数字模拟的不确定性。气候变化已经在改变并将继续影响气象灾害出现的可能性,使一些极端事件发生得更加频繁且/或激烈;另一些极端事件则不然。然而,我们不应把任何气象事件的发生全部归因于人类活动,而是要用概率角度思考人类活动是如何改变事件发生的风险的。
1. 天气和气候之间很难联系起来
热浪、寒潮、大雨、干旱、飓风、风暴以及其他极端天气事件经常出现在新闻中,特别是因为它们对社会和环境的巨大影响。极端天气事件与气候变化之间存在何种联系是应该向科学家提出的问题。越来越多的研究也在关注这一主题。问题的答案并不是容易得到,特别是由于媒体对这些天气现象越来越系统化的报道以及人们对气象灾害脆弱性的增加,可能会给人们对气候变化趋势产生错误的印象。
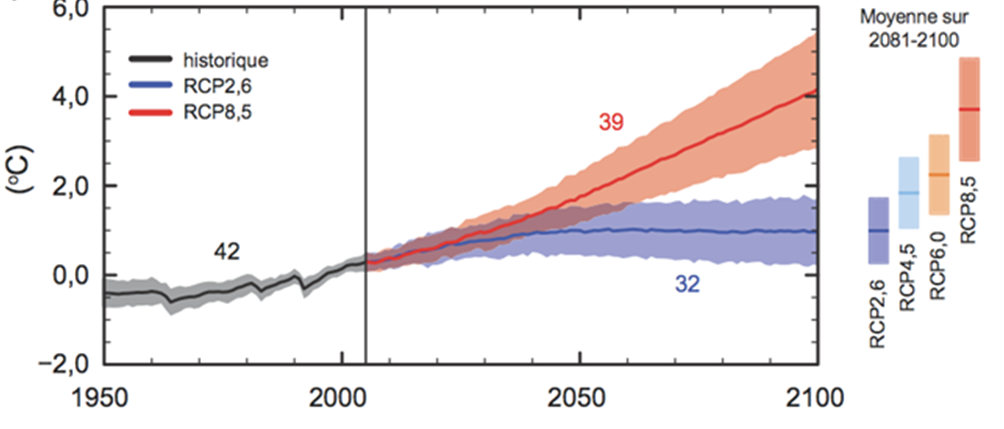
[来源:第五次政府间气候变化专门委员会评估报告的图 SPM7,见参考文献[1])
在人为因素引起气候变化的背景下,科学挑战是双重的:一方面,在观测到的事件中分离出人类的影响痕迹;另一方面,要预测气候变暖的变化趋势。第二点的研究是使用对未来气候进行数字模拟,或“气候预测”(图1,[1])加以研究。目前的气候预测会考虑21世纪四种可能的温室气体浓度轨迹(“典型浓度路径”,RCP),该路径与温室气体排放的社会经济情景有关。在RCP2.6低排放的情景下,21世纪地球表面增温1℃(± 0.7)(即相比于工业化前水平增长1.6℃);在RCP8.5高排放的情景下,地表增温3.7ºC (± 1.1),即相比于工业化前水平增长4.3ºC 。
对极端天气事件近期或未来趋势的研究通常针对每种类型的事件进行。因此,本文会依次研究极端温度、极端水文、热带气旋(包括飓风和台风)和特大热带风暴。我们将看到,一些研究表明,某些类型极端事件在频次和/或强度上已经可以检测到变化,其他类型的极端事件在21世纪可能会出现或增加。然而,这些定性的可靠的成果不应掩盖极端事件研究所面临的两大难题:
- 第一个是自然气候变率在这些现象中的主导作用,它往往使人为信号不明确,需要高质量的观测和/或大量的模拟才能探测到变化。
- 第二个是气候模型的不完善性,因此需要继续完善、评估它们,并尽可能依靠多种独立的模型。
2. 极端温度
一个多世纪以来观测到的全球变暖现象不仅影响均温,还会影响温度的整个统计分布,即某一时刻和某一地方全部可能出现的温度分布范围,在这一分布的两端意味着罕见的温度事件—极端低温和极端高温。极端天气的出现通常产生巨大的社会环境影响。传统上极端温度是依据其发生的频次,或者按照统计学术语,通过其分布的分位数来定义的。例如:通常的说法是,如果某天的温度位于期望值的前10%(即这个温度在分布上“超过了第90个百分位数或第9个十分位数”),将其描述位天气异常热。按照这种理解方式,我们可以认为在参考时期内,10%的天数都异常热。一个对称定义可用于异常寒冷的天气,季节性温度周期通常也会考虑在内。如此一来,我们便可讨论冬季的暖日或者夏季的冷天。为了研究两个极端事件的演变,我们要么考虑频次(低于或高于现在温度十分位数的天数)的演变,要么考虑强度的变化,例如将其定义为10%极端天数的平均温度。
2.1. 极端天气日的出现
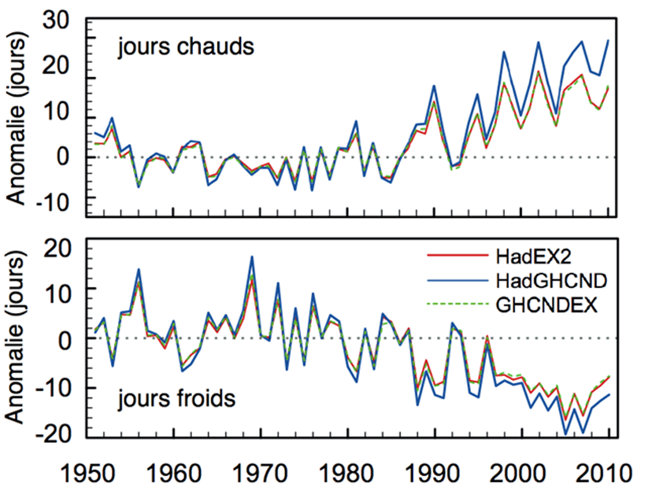
[来源:改编自政府间气候变化专门委员会第五次报告图2.32,报告见参考文献[1]]
随着气候变暖,整个温度分布就会发生变化(图2)。按照极端天气的定义,极冷天气出现的频次预计会减少,极端高温天气出现的频次会增加(既定的气温阈值)。或者,极冷天气变得没那么冷了(既定的频次阈值)。
全球范围内,异常暖的天数自1950年开始就一直大幅增加(图3,[1]),其中20世纪90年代和21世纪前10年热天出现的频次比以往更多。对比来看,我们观测到的异常冷的天数减少了。与此同时,整体趋势是相较于低温日、月记录,高温日、月记录会更加频繁地被打破。这些结果在区域范围(尤其是在欧洲)也被观测到了。
2.2. 热浪与寒潮
除了日统计数据之外,热浪(即连续数日的炎热天气)往往更频繁、更强烈和/或更长。但寒潮天数自1950年之后大幅减少。虽然最近的热浪,如2003年8月西欧出现的热浪,在性质上符合我们对气候变暖的预期,但近些年欧洲观测到的少数冬季寒潮(2009年10月冬季、2010年12月、2012年2月)似乎与全球变暖的观点相矛盾。
在全球变暖的背景下寒潮在局部偶尔会出现,这并非悖论。从长期看,这是气象灾害和气候趋势之间的区别。
变暖是个背景过程,叠加在气候系统自然内部变率之上[阅读“气候变化:以北大西洋涛动为例”]。即使气候变化会继续造成寒冷天气事件,但由于受全球变暖影响,预计它们的频率和/或强度有望降低[参见“把单个天气事件归因于气候变化:2003年热浪”]。这恰恰又是我们再一次看到的:最近寒潮的凉爽只是相对于1939/40年和1962/63年的寒冬而言的,这两个冬天在大气环流方面是相似的。
最后,不能排除最近几年的气候变暖(在北极尤为显著)可能会暂时扰乱我们所在纬度的气团循环,并增加了在欧洲产生寒潮的可能性。然而,关于这一点科学界存在颇多争议。
2.3. 21世纪的气候演变
不管情景何,21世纪全球变暖或多或少地会继续下去。因此,近些年观测的极端温度趋势在气候预估中得以证实,则不足为奇:极端高温越来越频繁和强烈,极端低温越来越罕见和不那么明显。然而,这些变化的程度主要取决于温室气体排放情景的选择。同一情景下,模型不同,变化的程度也不同,并且仍然受气候内部变率的强烈调节。
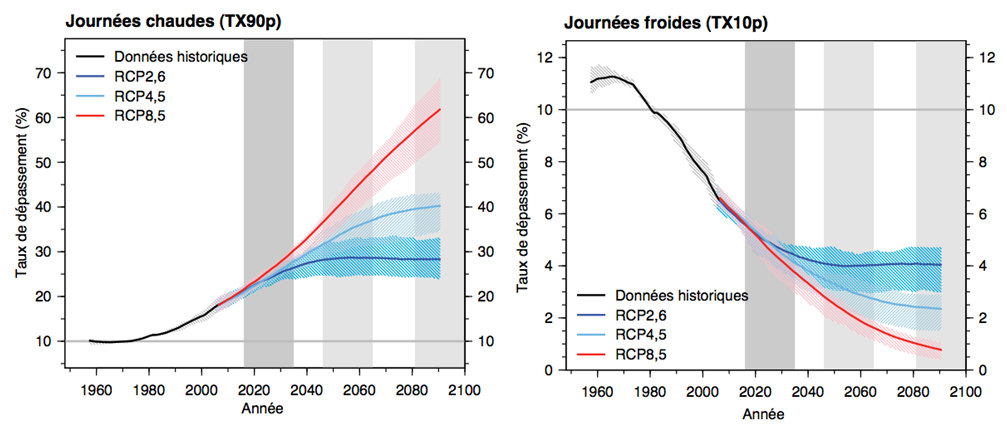
[来源: 政府间气候变化专门委员会第五次报告图 WGI-AT9,见参考文献[1]]
在全球和年尺度上,平均而言,到2100年,从不同的气候模型模拟结果来看,观测到日温超过当前第90百分位数的概率从目前的10%(每十天有一天)增长到RCP2.6情景下的25%(每4天有一天),甚至在2100年达到RCP8.5情景下的60%(超过一半的天数)。相反,在RCP2.6和RCP8.5中,异常寒冷天气的频率分别降至4%和1%(图4)。这种演变还会影响非常罕见的事件。例如,当前气候下极端高温事件平均每20年出现一次(又称20年回归期),而在2100年RCP8.5场景下平均每两年出现一次。同样在RCP8.5情景下,极端低温事件的回归期从20年延长至100多年。虽然趋势如此,出现极端低温天气的可能性依然存在。即使在路径浓度高的情景下,在21世纪一些低温记录仍有望在局部区域被打破。但是相较于高温记录,低温纪录被打破的频次会低很多。例如,在美国,目前出现高温记录和出现低温记录的比例是2:1:在中等情景下,估计2050年左右为20:1,2100年为50:1。
除了与情景选择和内部气候变率相关的不确定性外,极端温度的未来演变对数值气候模式的选择很敏感,特别是在区域和季节尺度上。在欧洲,RCP8.5情景下超过夏季温度第90个百分位数(或第9个十分位数),即当前气候的10%的概率在30%-90%之间。这取决于2070-2100年未来夏季的气候模型。
这些不确定性还会改变多日事件的特征。例如,尽管未来的预测一直认为欧洲夏季热浪的频率、强度和持续时间会增加,然而既定情境下,它们到2100年的演变会因所采用的数字模型的不同而有三倍的差异。

[© 朱利安·卡帝奥克斯]
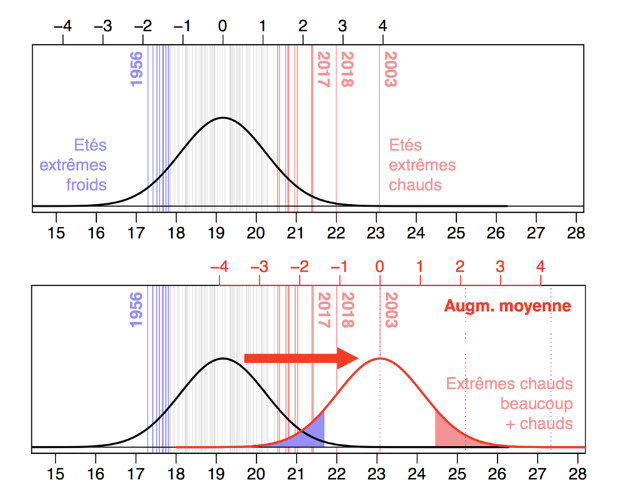
最后,如果极端温度的变化主要取决于平均变暖的幅度(分布的变动),那么它们受到变率变化(分布形状与宽度,见图5)的调节。预测显示,在欧洲夏季变异的微增会使极端高温事件出现的可能性更大。冬季变率略有减少,就会使极端低温事件出现的可能性更小。这些现象分别与夏季土壤干燥与冬季雪量减少有关。

[来源:布歇尔(Boucher)等,参考文献[2]]
2003年的炎热夏季是21世纪欧洲夏季的典型代表吗?就西欧夏季而言,2003年热浪温度与1961-1990均温的差值约为3℃。根据RCP8.5情景(图6a,[2]),它相当于21世纪40年代的普通夏季的情况。甚至在2100年成为一个极端寒冷的夏天。然而,在RCP2.6情景下,直到2100年,它仍然是一个异常热的夏季。此外,局部地区(即在法国)和以几天为尺度,在RCP8.5场景下(图6b,[2]),2003年8月最热的几天依旧会是异常炎热。因此,该问题的答案取决于情景选择和时空范围。
3. 极端水文事件
温室效应除了会使温度升高,还有可能改变全球水文循环(大气、海洋和大陆间的水循环;阅读“我们是否面临缺水的危险?”)以及相关极端事件(尤其是强降雨和干旱)。原因如下:
- 表面增温加剧蒸发,在水资源丰富的地区尤其如此(如海洋和湿润的大陆)。
- 根据克劳修斯-克拉佩龙方程(阅读“热力学:积雨云中上升的气团”),一个较暖的大气温度每升高一度,其最大的水蒸气含量增加约7%。在温暖的气候条件下,当天气条件有利于降水时,可能会动用更大的大气水库。
- 最后,降雨模式会受到大气环流可能发生变化的影响,因为正是这种环流输送了大部分水蒸气,从而在特定地点导致降水。
因为其时空异质性和人类对大陆水流和储存的直接影响(除了气候变化之外),水文极端现象的响应特别难以理解。
现有的观测表明,在世界某些地区,特别是在欧洲和北美,有较长的测量序列可用的地区,强降雨的次数和/或强度已经有所增加。对于法国,目前还没有对极端降水趋势的系统评估。
3.1. “地中海事件”
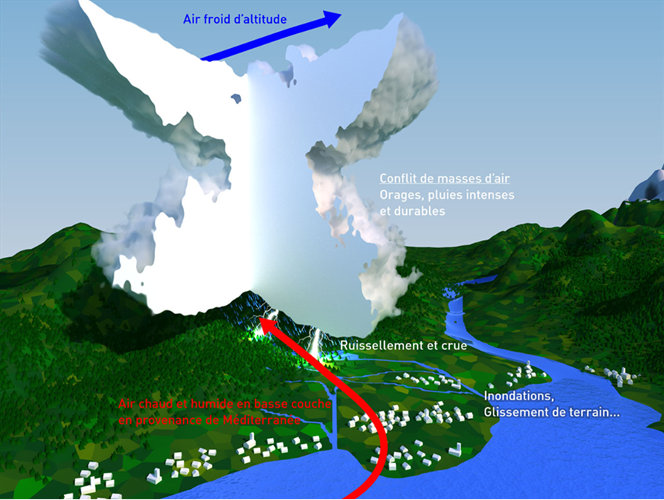
[来源:法国气象组织]
法国东南部受极为湿润的南风和东南风影响,该区域观测到的“地中海事件”与法国本土最高降水事件一致(图7)。这些事件是关注的焦点。一些研究表明最近此类事件发生的强度在增加。然而,将这些变化转化为洪水更加困难,因为在许多集水区,它们受到日益增加的人为活动 (例如城市化、森林砍伐、农业) 的影响(在全球范围内更是如此)。
3.2. 干旱
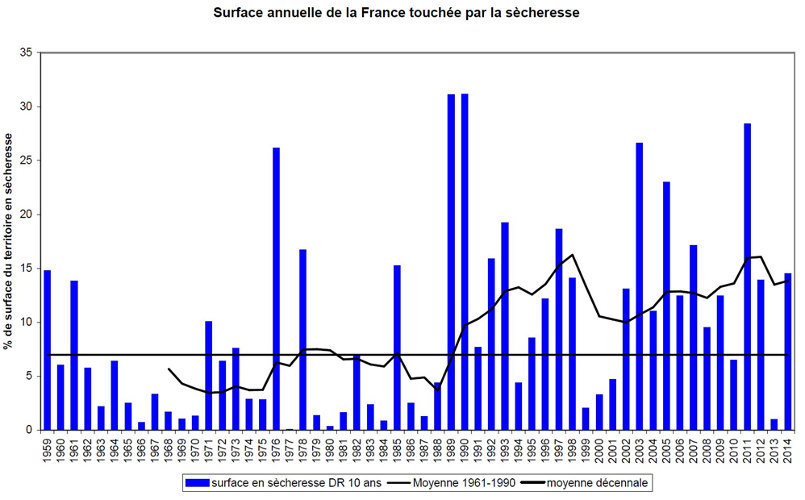
[来源: © 法国气象组织, “气候变动与安全威胁项目”结果, 参见参考文献[3]]
干旱是由或多或少持续的缺水造成的。干旱指标可用于描述干旱特点。气象干旱是最容易描述和显示了地区间的不同趋势的,有时主要受自然气候变异影响(例如发生在萨赫勒地区,或者最近在加利福尼亚)。虽然空间观测工作取得了进展,但因为缺少全球原位测量网络,对农业干旱的近期趋势评估更加困难。另一种方法就是模拟土壤含水量随观测到的气象参数变化而发生的变化。这种由法国气象局在本国实施的方法表明,自1958年以来部分地区土壤干旱情况有所增加(图8),尤其是地中海区域,以及法国西部[3]。
3.3. 未来全球水文变化
预测显示,未来会出现一些质量上的强劲变化,包括全球降水时空差异增大。这可以用 “湿的越湿,干的越干”的格言来概括为。如果这些精辟的格言仍然是科学界争论的主题,那么地中海盆地的干涸以及更广泛地说,干旱和半干旱地区向极地的扩张似乎是不可避免的。结果是,欧洲北部(最湿)和南部(最干)之间的差异预期会继续增大。最近一些研究表明,大部分数字模型都低估了北半球中纬度地区的夏季干旱趋势。
这些模式还表明,由于全球变暖,强降水事件将相对普遍地加剧,包括在将经历平均干旱的地区,但在亚热带地区例外。在模拟中,随着温室气体浓度增加的情景越来越高,这种强降雨的加剧更加明显。降水累积分析周期越短(日-时累积),强降水预测频率越高、强度越大。这种强化发生的速度有时超过预测和观测到的变化,这些变化表现为温度每升高一度大气水蒸气强度增加超过7%。然而,应该谨慎看待这些数据。因为大多数模型水平分辨率有限,而且对极端事件相关的过程描述也过于简化。
因为降水时间变化增加(连续无雨的天数增多)以及蒸散加剧(地表蒸发和植物向大气的水汽输送),在更暖的气候条件下,水文循环增强也会导致世界很多地区干旱风险增加,包括一些21世纪出现年均降水增加的地区。总之,全球变暖因此影响降水分布的两端,使得强降水事件和干旱出现的可能性都增加了。
地中海型气候(地中海附近,也包括澳大利亚、南非或美洲的部分地区)可能尤其受到这些水文变化的影响。但是总体上,干旱地区预计会向中纬度扩展。“富者愈富,穷者愈穷”的范式虽然过于简化,但反映出了气候水源供给量差距的拉大。在法国,预计土壤有效水分含量会减少,多数河流的低水位也会降低。
4. 热带气旋
热带气旋,在大西洋也称飓风或在太平洋称台风。就其威力及影响的人口而言,热带气旋是目前为止最具破坏性的气象事件。(阅读“热带气旋:形成和结构”和“热带气旋:影响和危害”)。自20世纪70年代以来,随着卫星的出现,对气旋进行系统的观测才成为可能。因此,整个20世纪所估计的所有趋势都存在问题(图9)。

此外,已经观测到的气旋对影响海盆的自然气候变异非常敏感。20世纪70、80年代,大西洋海盆的气旋活动相对平静,这可能与大西洋年代际振荡(AMO)的冷期有关,这也造成了当时萨赫勒地区的严重干旱。这种变化模式与北大西洋海表面温度几十年的异常振荡具有一致性。之后几十年里,大西洋海域的飓风活动表现出更加猛烈的特点,由于缺少高质量的数据,尤其是卫星数据,因此难以和此前大西洋年代际振荡的正位相相比较。因此,基于先前的观测,计算热带气旋活动长期趋势并非易事。一些研究试图强调过去40年里最强烈气旋呈上升趋势,但科学界对此几乎没有达成共识。
模拟热带气旋的困难在于如何在数字模型中再现热带气旋。事实上,这些气旋规模小(几十到几百千米),需要在精细的计算网格上(约50千米)进行气候模拟,从而更真实地再现。可一个模型的网格可以看做是点构成的网络,点之间的距离限制了可模拟的最小气旋的规模。
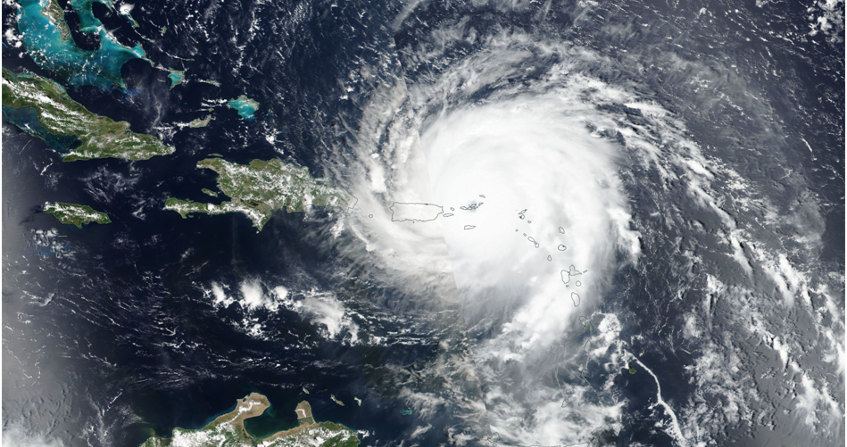
虽然模拟存在局限性,但迄今为止开展的工作集中在21世纪末的气旋活动趋势上。因此,气候模型表明,热带气旋的总数会保持稳定,或者随着气候变暖数量甚至会减少。这是因为此时适合气旋形成的条件减弱了。另一方面,一旦形成条件满足,气旋就会从海洋表面50米海水中吸收热量,获取能量。因此,在一个更加温暖的世界,最强气旋的强度会有所增加:最大风力更大,带来的降雨更强。2017年巴布达岛、圣马丁岛和圣巴泰勒米岛遭遇了5级飓风伊玛(Irma,封面图片)的袭击。伊玛是典型的强气旋,其出现的概率预计会随着大西洋海盆增温而增加。最近的研究还显示,受热带气旋影响的地区可能会向两极扩张(超出热带)。
同时还要注意,气旋的危害程度,不仅取决于气旋本身内在的特点(强度、轨迹等),还取决于与气旋相关的现象,比如风暴潮。21世纪预计会观测到海平面上升,因此气旋发生时,沿海地区也易受到气旋现象的影响而被淹没。例如2015年发生在瓦努阿图的气旋帕姆就导致城市被淹没。另外,在气候预测中存在着一种似乎非常明显的趋势,该趋势涉及与气旋现象有关的降水强度。21世纪末,这种强度在模型中会大幅增加。根据克劳修斯-克拉贝龙方程,有时每升高一度,强度增加超过7%。当前沿海城市更加密集,更易受到洪水的威胁。因此,在此背景下,气旋危害程度的其它方面更为重要。最近,气旋哈维(2017年8月17日至9月2日)戏剧性的说明了在气旋系统生命期内大量累积降水的影响,并因气旋在休斯顿市上空的停滞而恶化。
5. 温带风暴
中纬度地区的风暴——以及更普遍的大气环流——与赤道和两极之间的温差有关(参见大气环流:其组织)。因此,它们最近和未来的演变取决于全球变暖的经向对比。在北半球,从表面上来看,北极浮冰预计未来会继续融化,导致极地变暖更加明显,进而降低极地和赤道的温度梯度。另一方面,对流层顶(海拔约10千米)的增温峰值加大了这一温度梯度。因此,中纬度大气运动(包括低气压和风暴)的演变取决于这两个区域(热带对流层上部和北极对流层下部)在增温方面的差距。更多区域因素,如北大西洋变暖的分布,也会调节欧洲低气压区的演变。此外,如果把该纬度范围气候系统巨大的自然变异性(阅读“气候变动:北大西洋涛动”)考虑在内,以及只有一小部分低气压演变成真正的风暴这一事实,我们就可以理解,以目前知识,仍无法特别明确全球变暖对这些现象产生的影响。
如果我们再加上这些纬度地区气候系统的巨大自然变异性(参见气候变异性:北大西洋涛动的例子),以及只有一小部分低气压演变成真正的风暴的事实,我们就可以理解,以目前的知识水平,全球变暖对这些现象的影响仍然非常不确定。
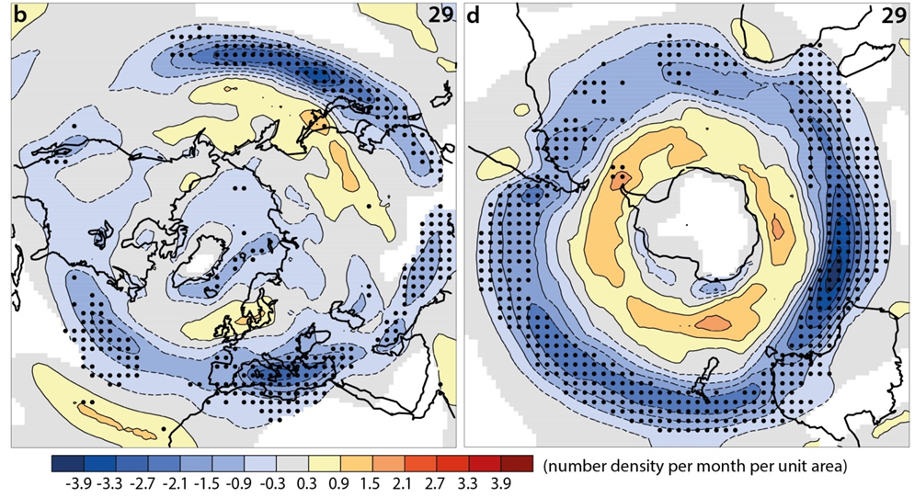
[来源:改自政府间气候变化专门委员会第五次报告图12.20]
基于大气观测的研究以及再分析表明,在20世纪,风暴在斯堪的纳维亚国家的发生次数呈上升趋势。在其他地区,尤其是法国,在以前没有发现任何可靠的趋势。在21世纪的情景中,虽然大多数数字模型似乎支持中纬度低气压活动会向两极转移(尤其是在南半球)(图10)。鉴于相关现象的复杂性,我们应该谨慎对待这种转移趋势。因此,关于人为变暖对热带外风暴产生的影响做出的结论还为时过早。然而,由于空气团的湿度增加,而且根据前边提到的克劳修斯-克拉贝龙方程,相关降水预计会更加充沛。
6. 结论:极端现象更加频繁或者更加强劲
极端天气事件研究是一项重大的科学研究和社会挑战。气候变化正在改变,且将继续改变气象灾害相关的概率。然而,并非像一些危言耸听或气候怀疑论的观点所言:这些变化总是朝着同一个方向发展。所以,全球变暖会使一些极端事件更加频繁,且/或更加强烈(热浪、连续强降水、干旱),而让另一些事件(寒潮)出现的可能性降低。这些科学信息可能会更加复杂:
- 就气旋而言,目前的知识状况表明,总数略有减少,但最强类别的气旋数量有所增加。
- 至于中纬度风暴,它们随气候变化的演变在很大程度上仍然不确定(这并不意味着“误解”)。
我们虽然已经掌握一定的知识,但还有许多科学问题尚未解决。世界气候研究计划已经将这一主题作为作为未来十年的优先事项之一。这一问题从不同层面构成了挑战,比如观测网络的建立、观测网络的运行和同质化、数字气候模型的改进以及评估其模拟极端事件能力,开发统计工具来检测、归因和理解其气候演变以及研究它们在不同时间尺度(季节、十年等)的可预测性。
最后,应该再次强调,即使气候变化预计会影响极端天气事件,但是不能一出现极端事件,就全部归咎于气候变化。更具体来说,我们不应该把一些气象事件全部归咎于人类,更应该多思考人类的影响如何改变气象事件的风险。
7. 要点
- 人类导致的气候变化已经并继续影响气象灾害发生的概率。
- 大多数极端事件(比如热浪、大雨、气旋)发生得越来越频繁,且/或更强烈,比如像寒潮一类极端事件不大可能出现,像风暴一类事件的情况则相反。
- 我们不能把所有观测到的气象事件全都归咎于人类;另一方面,我们可以估算人类是如何影响这些事件发生的概率的。
- 由于气候多变性和历史数据的异质性使得很难在观测中发现趋势。
- 完善后的数字气候模拟工具将会减少预测未来极端事件演变中的不确定性。
参考资料及说明
封面照片:小安的列斯群岛上的飓风艾尔玛 (2017.09.06) [来源: © 美国宇航局/戈达德太空飞行中心地球科学数据与信息系统 (ESDIS) 项目]
[1] Intergovernmental Panel on Climate Change (IPCC), 2013, Fifth Assessment Report, Scientific Elements, Contribution of Working Group I (http://ipcc.ch/report/ar5/wg1/).
[2] Boucher et al (2015) Projection of future climate change, La Météorologie, n°88, p.56-68. Doi: 10.4267/2042/56362
[3] ClimSec project. See Soubeyroux et al (2012) Soil droughts in France and climate change: Results and applications of the ClimSec project. La Météorologie nº78, p.21-30. doi: 10.4267/2042/47512 and CNRM website: https: //www.umr-cnrm.fr/spip.php?article605&lang=en
环境百科全书由环境和能源百科全书协会出版 (www.a3e.fr),该协会与格勒诺布尔阿尔卑斯大学和格勒诺布尔INP有合同关系,并由法国科学院赞助。
引用这篇文章: CATTIAUX Julien, CHAUVIN Fabrice, DOUVILLE Hervé, RIBES Aurélien (2024年3月14日), 极端天气和气候变化, 环境百科全书,咨询于 2026年7月29日 [在线ISSN 2555-0950]网址: https://www.encyclopedie-environnement.org/zh/climat-zh/extreme-weather-events-and-climate-change/.
环境百科全书中的文章是根据知识共享BY-NC-SA许可条款提供的,该许可授权复制的条件是:引用来源,不作商业使用,共享相同的初始条件,并且在每次重复使用或分发时复制知识共享BY-NC-SA许可声明。