Stratification and instabilities in natural fluid environments
PDF
What is the relationship between a fog layer, a rainbow cocktail or piles of geological layers? These structures are all superimpositions of distinct layers, like a yarrow! The air in the atmosphere, the water in lakes or oceans and colourful cocktails are fluid media subject to gravity. When they are in equilibrium, the heaviest parts are located at the bottom, the lightest parts at the top, this separation can give rise to a stratification phenomenon. But things get more complicated when instabilities set these fluids in motion. Meteorology, climatology and the dispersion of pollutants find serious challenges here.
1. Fluids at rest… almost
It is the law of hydrostatics that governs the state of equilibrium of a fluid structure at rest. It requires that the pressure decreases with altitude so that, at the bottom of a horizontal layer, the pressure is higher than at the top. The difference between these pressures leads to an upward vertical force exactly opposite to the weight of the fluid layer. The article Pressure, temperature and heat is a reminder of this equilibrium of a fluid at rest, of the origin of the pressure forces capable of compensating for the weight of a layer of this fluid and of this law of hydrostatics.
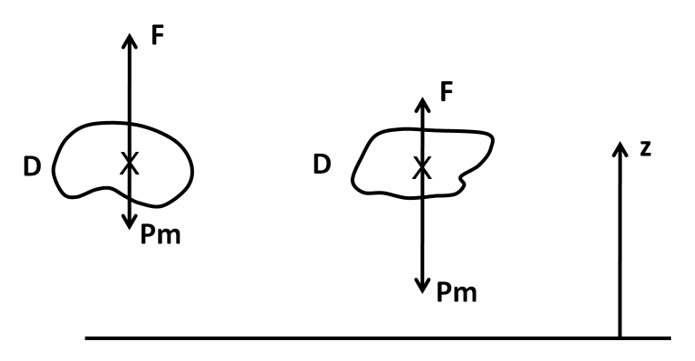
Let us imagine a small area within the fluid medium, of any shape and of volume V. It can be occupied by the fluid itself, by another fluid, or by a solid body. The resultant of the pressure forces exerted by the external medium on the surface of this domain is a vertical force, directed upwards: Archimedes’ thrust. Its value F is given by the formula F = ρgV, where ρ is the density of the fluid and g is gravity. It is exactly the weight P of the “displaced fluid“, i.e. the fluid that should occupy the volume V.
The medium in domain D in Figure 1 also has its own weight Pm, directed downwards. This domain is therefore subject to both:
- to the Archimedes Thrust F facing upwards,
- at its weight Pm pointing downwards.
There are various reasons why the density may vary within the fluid. Temperature can cause expansion of portions of the fluid range. In addition, fluids such as air and water are mixtures and are rarely homogeneous in composition. These variations always result in certain portions of the fluid range becoming lighter or heavier and moving within the surrounding environment. We can observe this rise above the radiators of heated apartments, but also outside when smoke comes out of chimneys. Similarly, in certain Mediterranean volcanic regions, where the deep water is warmer than that of the surface layers, upward currents are produced locally and are often sought after by bathers and some curists. Conversely, these mechanisms can impose dives to the depths for portions heavier than the surrounding fluid.
The presence of airborne particles or droplets, known as aerosols, is another example of local variation in density.
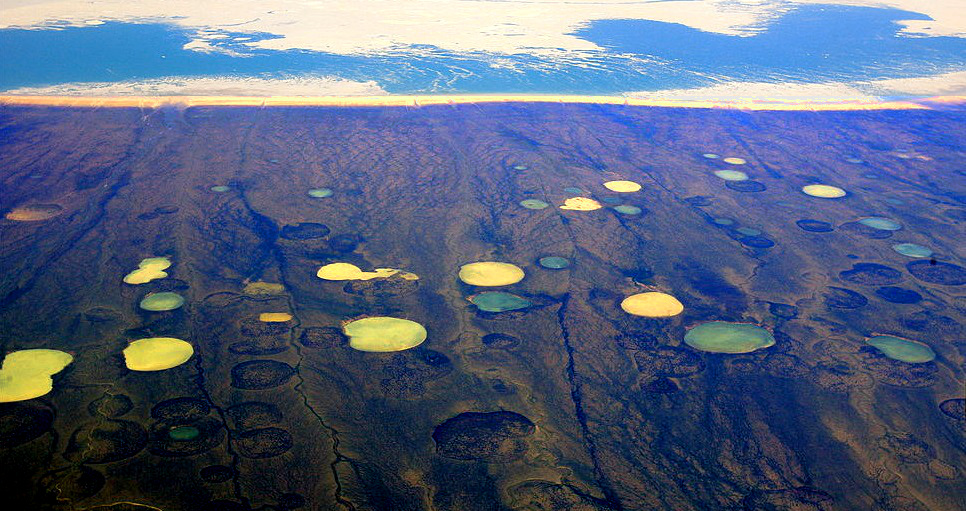
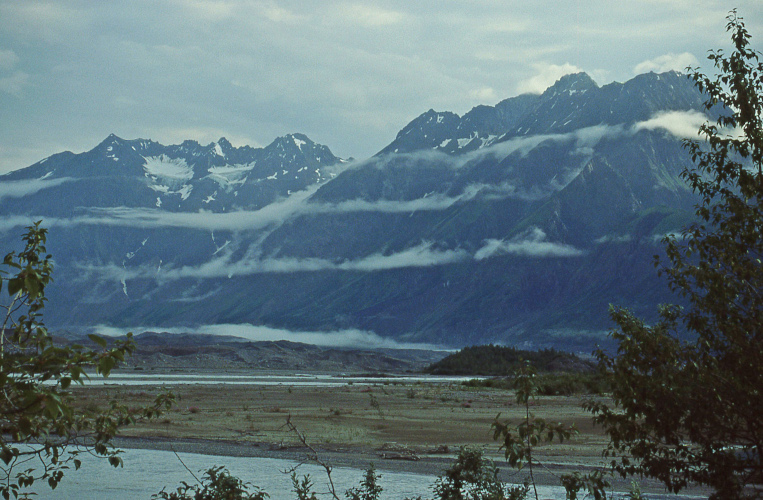
- In the air, it often appears as patches of mist or fog, apparently lying on bodies of water or fields (Figure 2).
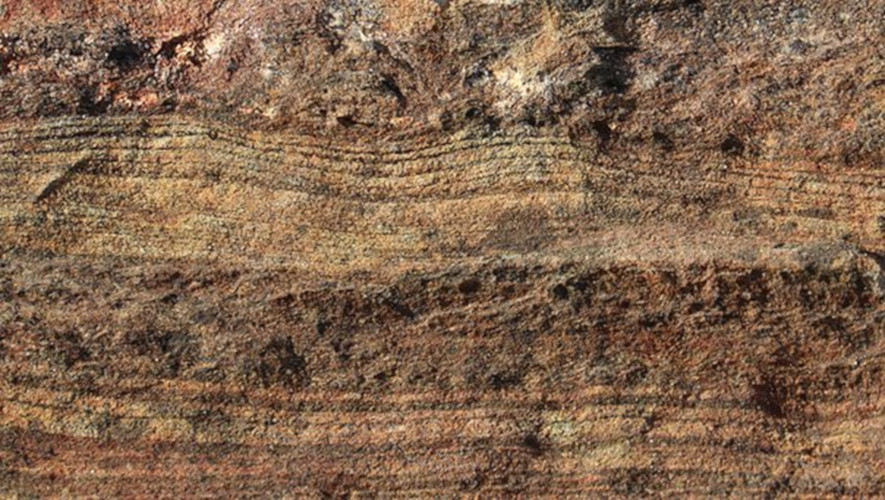
- In ponds and lakes, suspended sludge tends to sink to the bottom where it forms layers of silt.
- In the oceans, which are subject to such a slow global circulation that the law of hydrostatics may apply, a phenomenon such as the plunge of the Gulf Stream in the vicinity of Greenland can be explained by the fact that its waters become heavier than their environment because they are both colder and saltier (read: The slow and powerful ocean circulation).
2. Stratification under the influence of gravity
It should be noted, however, that the influence of pressure on the density of water is practically negligible compared to the influence of temperature, which justifies the fact that water is often considered incompressible, whereas it is quite expandable. Typical values for its compressibility and expandability are 4. 10-10 Pa-1 and 2. 10-4 K-1, respectively. More concretely, these values mean that in order to vary the density of water by 0.1%, a temperature difference of 5°C is sufficient, whereas a pressure difference of 20 times atmospheric pressure, i.e. a depth difference of 200 m, is required to achieve the same 0.1% variation.
3. A few examples
[Source: Pixabay]

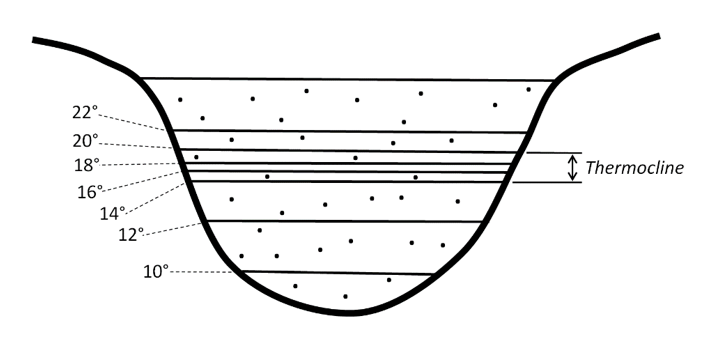
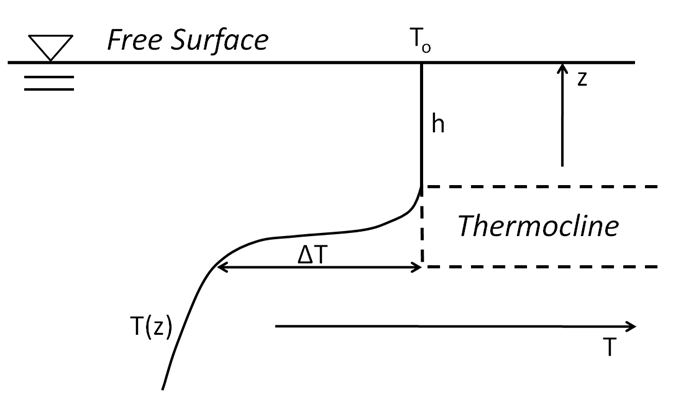
On the contrary, at depth, reduced to pure conduction in a quasi-immobile environment, heat exchanges are very low so that the temperature remains almost invariable. Between these two zones, there is a rather thin zone called the thermocline, where the temperature can vary by about ten degrees (Figures 5 and 6). The temperature of the water above the thermocline experiences significant seasonal variations due to variations in sunlight, while the temperature of the deep layers does not vary. See Figure 2 in the article The Marine Environment.
4. Decanting and stratification have limitations
First, when a water droplet or a grain of dust falls into the surrounding air, due to its apparent weight, it takes the place of the air below it, and this air must rise above it.
- This object, a droplet or grain, is then subjected to an upward friction force over its entire surface, which is proportional to the square of its mean radius (r2).
- On the contrary, its apparent weight is proportional to the volume, i.e. the cube of its mean radius (r3).
On large enough objects, the competition between these opposing forces is decided in favour of weight, which forces the object to fall. But when the radius r becomes very small, the competition between these forces is won by friction, which prevents the object from falling. In practice, for polluting particles in the air as well as for droplets in fog, the critical radius below which objects can no longer settle is of the order of ten microns.
In sludge, suspended solid particles are subject to the same competition, but the density of these particles is quite close to that of water. As a result, the critical radius is much larger, of the order of a hundred microns.
Other mechanisms also help to prevent the stable suspension of very small objects. One of them is Brownian motion, which is analogous to the agitation of molecules, although it is much less intense at the micron scale than at the nanometer scale (Read: Diffusion, the ultimate step in good mixing). This motion causes each object to collide with many surrounding particles and molecules, giving it an effective cross-section much larger than its radius, and requiring larger passage sections for its trajectory.
5. When instabilities arise
Fluid domains heated from below can become unstable when the temperature difference between the bottom and the surface exceeds a critical threshold. This is the Rayleigh-Taylor instability [4]. This critical threshold is very low in the case of the lower layers of the Earth’s atmosphere. It is this instability which, in periods of very calm high pressure, after a complete night’s rest and in the absence of wind, systematically creates air agitation as soon as the sun rises, which agitates the leaves and makes the flags flutter.
In water, this instability is easy to observe as soon as a container is placed on the fire. It is then influenced by th

Under more controlled conditions, such as some laboratory experiments where the depth of the liquid layer is much less than its horizontal extent, the formation of cells with a horizontal dimension close to the depth is observed. These cells, which are generally identical, are animated by a well-organized convection movement. The liquid rises on one side, in a kind of chimney, and descends on the other in a kind of well (Figure 7). In the chimney the apparent weight Pa of the liquid is directed upwards, while it is directed downwards in the well. Together these two forces form a torque which may be able to set the entire cell in motion, despite the braking provided by the viscosity of the liquid.
Video 1: Instability of Rayleigh-Taylor and its characteristic “mushrooms” illustrated with hot coloured water injected into cold water. [Source: Jens Niemeyer]
The organization of the convective cell array depends strongly on the geometrical parameters of the experiment. It can be a very regular hexagonal array, especially when the upper plane is a free surface. Between two solid walls forming a parallelepipedic cavity, one can rather observe parallel rollers. In nature very varied situations can be observed.
Video 2: Rayleigh-Bénard convective cells in heated oil mixed with small aluminium particles.
6. Some geophysical examples of convection
6.1. Thawing of the tundra
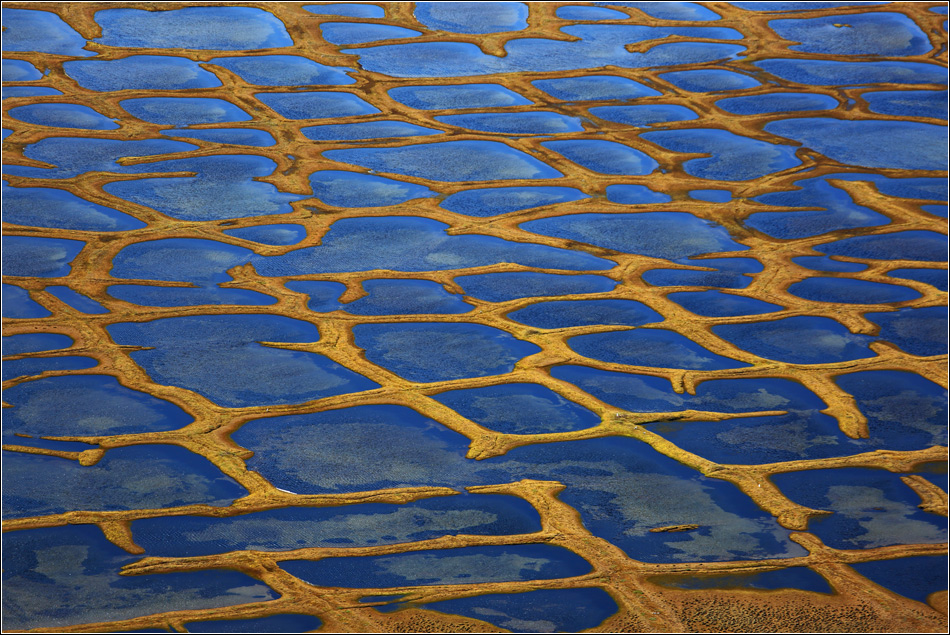
The phenomenon seems to be explained as follows: an earthy soil that thaws becomes a mud, certainly thick, but fluid, especially below 4°C, the temperature at which the density of water reaches its maximum. The mud at the bottom, in contact with the ground still frozen at 0 or 1°C, is therefore lighter than the mud at the surface, at least when it does not exceed 7°C (water at 7°C has the same density as water at 1°C). A network of chimneys can therefore be formed where the lighter mud will rise from the bottom. But in the vicinity of wells, the water it contains tends to fall back to the bottom, leaving these dried-up bulges on the surface. At the scale of each cell there is then a layer of almost pure water, covering the mud that returns to the bottom. Here, the stirring causes a real separation of the liquid and solid phases in an initially homogeneous medium.
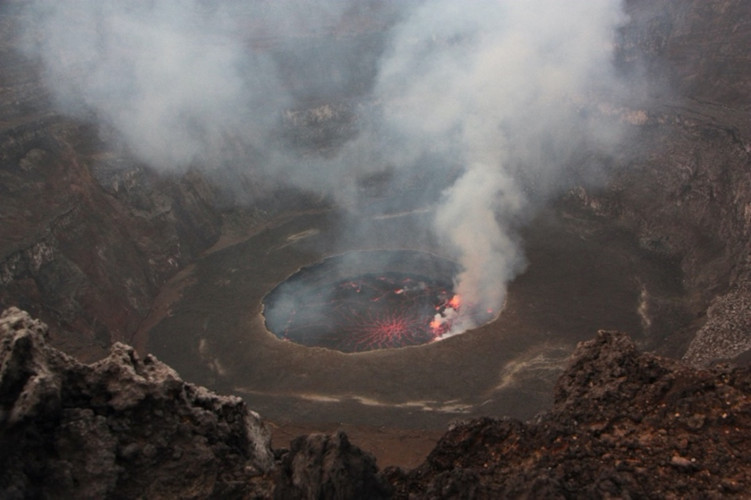

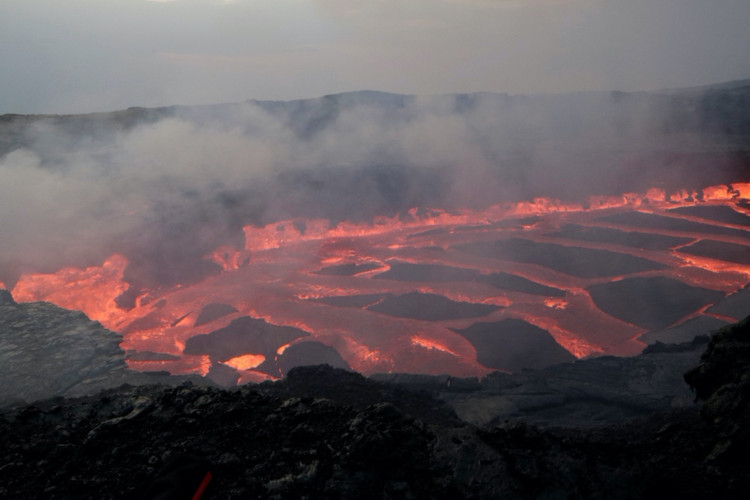
6.3. The particular case of the Erta Ale

7. Messages to remember
- In all geophysical fluids gravity imposes a variation in density, decreasing with altitude.
- Stratification is manifested by jumps in density, giving rise to layers of material of different densities, such as fog in the air or mud on the bottom of lakes or seas.
- In large water basins, sunlight causes the seasonal formation of a thermocline, which separates a warm, light surface layer from deep water whose temperature remains almost invariant.
- Very small airborne objects, such as liquid droplets or fine particles, cannot settle due to the friction of the surrounding fluid, which would outweigh their apparent weight.
- Hydrodynamic instabilities, especially in fluids heated from below, can destroy certain equilibriums and oppose possible stratification.
- The lava present in some volcanic craters is also a natural fluid. Variations in temperature induce strong variations in viscosity that give rise to remarkable convective structures.
Notes and References
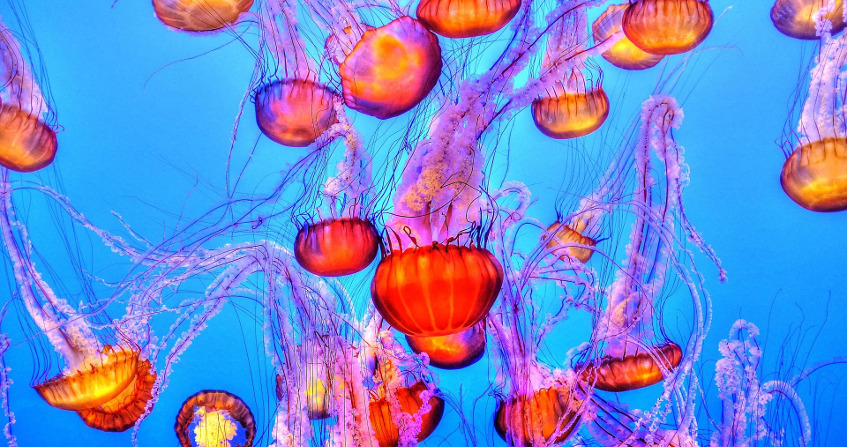
Cover image.
[1] Pedlosky J., Geophysical fluid Dynamics, Springer-Verlag,2nd edition, 1987
[2] A state variable is any quantity, such as density, pressure, temperature and concentration of each species in a mixture, that characterizes the equilibrium in which the fluid is in equilibrium. These quantities are related by the equation of state of the fluid.
[3] Hydrometeors are airborne objects made up of sets of water drops or ice particles suspended in the air: rain, drizzle, snow, hail, fog.
[4] Drazin P. G. and Reid W. H., Hydrodynamic stability, Cambridge University Press, 1981
The Encyclopedia of the Environment by the Association des Encyclopédies de l'Environnement et de l'Énergie (www.a3e.fr), contractually linked to the University of Grenoble Alpes and Grenoble INP, and sponsored by the French Academy of Sciences.
To cite this article: PADET Jacques (January 5, 2025), Stratification and instabilities in natural fluid environments, Encyclopedia of the Environment, Accessed July 27, 2026 [online ISSN 2555-0950] url : https://www.encyclopedie-environnement.org/en/physics/stratification-instabilities-natural-fluid-environments/.
The articles in the Encyclopedia of the Environment are made available under the terms of the Creative Commons BY-NC-SA license, which authorizes reproduction subject to: citing the source, not making commercial use of them, sharing identical initial conditions, reproducing at each reuse or distribution the mention of this Creative Commons BY-NC-SA license.